Agricultural Activator Adjuvant Market Size and Share Forecast Outlook (2024 to 2034)

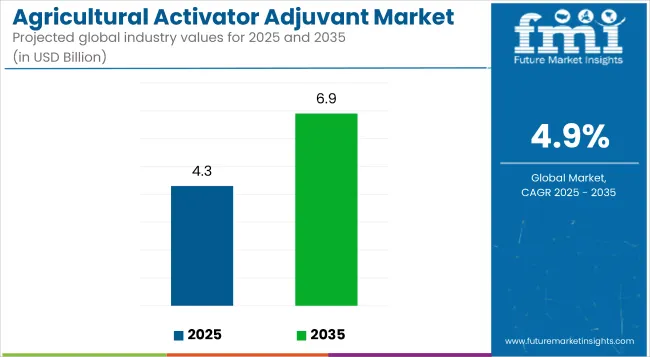
The global agricultural activator market is anticipated to be worth USD 6.6 billion by 2034. According to the estimates, the market is projected to clock a 4.9% CAGR until 2034. In 2024, the agricultural activator adjuvant industry is valued at USD 4.1 billion.

Attribute Details
Agricultural Activator Adjuvant Market Size, 2023 USD 3.8 billion
Agricultural Activator Adjuvant Market Size, 2024 USD 4.1 billion
Agricultural Activator Adjuvant Market Size, 2034 USD 6.6 billion
Value CAGR (2024 to 2034) 4.9%

Key Industry Highlights Transforming the Agricultural Activator Adjuvant Sector

Emphasis on Developing Crop-specific Adjuvants Surges in the Market

An obvious trend in the market is a deliberate focus on adjuvant development customized for certain crops and their particular agronomic traits. Businesses recognize the benefits of providing customized formulas to maximize outcomes for certain crops. This transition in the industry reflects a customer-centric strategy, where companies are aligning their product portfolios to meet the various demands of farmers using multiple farming techniques. Increasingly, crop-specific adjuvant targeting and customization influence consumer happiness and commercial competitiveness.

In a recent development, Bharat Petroleum Corporation Ltd., a leading energy provider, launched the MAK ADJOL Banana in July 2023. MAK ADJOL Banana is a revolutionary adjuvant product in the Agri Spray segment and was developed in collaboration with the National Research Centre for Banana (NRCB).

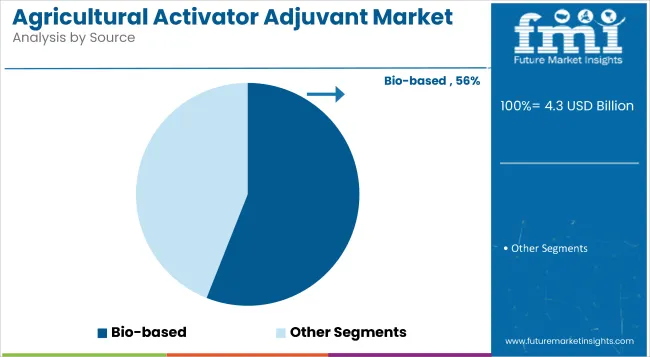
Growing Shift toward Bio-based and Environmentally Products

There is a noticeable trend in the agriculture industry favoring ecological and bio-based adjuvants in response to increased environmental concerns. Industry stakeholders are placing a higher priority on formulations with reduced chemical residues and a lower environmental effect. This trend enables companies to realign their product portfolios to satisfy changing customer needs for environmentally friendly and green solutions. It also coincides with larger corporate social responsibility programs and legislative pressures highlighting sustainable practices.

Rising Integration with Precision Agriculture Technologies Creates Lucrative Opportunities

The combination of adjuvants with precision agricultural technology offers a profitable prospect. Developing adjuvants that work in unison with precision agricultural instruments, including drones and sensors, aligns with the modern farmer's pursuit of efficiency. To fully capitalize on this potential, businesses must develop novel products, integrate with cutting-edge farming technology, and establish themselves as key players in the quickly changing precision agriculture market.

To expand the variety of its adjuvant solutions and boost crop input spraying efficiency, Stoller announced the introduction of four innovations in September 2023. The company claims that application-related costs account for 25% of overall production costs on average. New technologies can assist in mitigating operational problems and even financial losses. Following its recent acquisition by Corteva Agriscience, Stoller asserts that it has increased its adjuvant segment research and development (R&D).

Trends and Developments in the Agricultural Activator Adjuvant Market

Attribute Details
Trends
  • The broad implementation of Integrated Pest Management (IPM) techniques impacts adjuvant usage in the agriculture industry.
  • The emergence of data-driven decision-support systems in agriculture is impacting the development of adjuvants.
  • Businesses operating in the agricultural adjuvant industry emphasize programs to lower their offerings' carbon footprint.
  • As the problems posed by climate unpredictability increase, there is a noticeable market trend toward creating adjuvants that boost resilience.
  • Agricultural practices are changing due to the introduction of digital farming solutions, typified by advanced farm management software and data analytics. Adjuvants improve the overall effectiveness of crop protection and yield optimization and are progressively becoming vital parts of digital farming techniques.
Opportunities
  • Blending adjuvants with biostimulants allows for more complete solutions. This strategy caters to farmers seeking integrated solutions by addressing pesticide optimization and improving plant growth.
  • Adjuvant producers can provide goods that work with organic agricultural methods since organic farming is becoming increasingly popular.
  • There is a chance for businesses to create water-soluble adjuvants since agriculture is placing a greater emphasis on water conservation.
  • The increasing difficulties brought about by climatic unpredictability provide a chance to create adjuvants specially made to increase crop resilience.
  • An innovative opportunity is the use of nanotechnology in adjuvant compositions. Investing in developing novel adjuvants that use nanoparticles and nanoemulsions can provide businesses with a competitive edge.
Challenges
  • Adjuvants and conventional agrochemicals are at risk due to the emergence of alternative technologies, including RNA-based insecticides and biological control techniques.
  • Market threats can stem from pest resistance and uncertainties over the effectiveness of agrochemicals. Ongoing research and development are crucial to meet these issues and guarantee that adjuvant products remain relevant.

Agricultural Activator Adjuvant Industry Analysis by Top Investment Segments

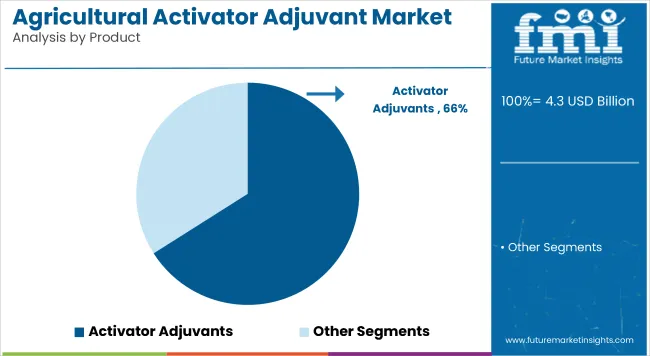
Activator Adjuvant Dominate as the Leading Product in the Market

Segment Activator Adjuvant (Product)
Value CAGR (2024 to 2034) 4.8%

Based on the product, the activator adjuvant segment is predicted to rise at a 4.8% CAGR through 2034. This growth is attributable to these factors:

  • Activator adjuvants are flexible and can be applied to a variety of crops. Their versatility to numerous crop kinds increases their market attractiveness, making them a popular alternative for farmers who grow various crops and need a single adjuvant solution for several applications.
  • Activator adjuvants are consistent with the increased emphasis on sustainable agricultural techniques. These adjuvants help to lessen environmental impact by boosting agrochemical application efficiency. Farmers are increasingly looking for sustainable solutions, which is driving up demand for activator adjuvants.

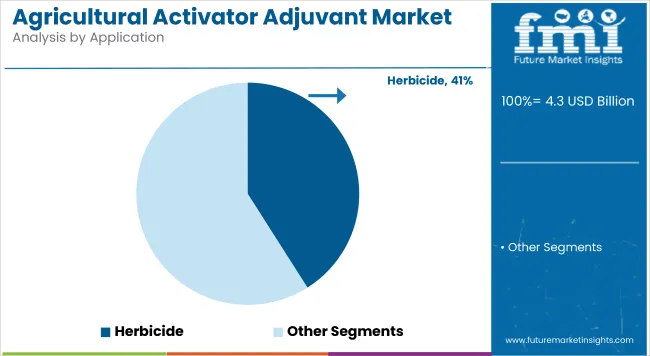
Herbicides Continue to be the Leading Application in the Market

Segment Herbicides (Application)
Value CAGR (2024 to 2034) 4.7%

Based on application, the herbicides segment is projected to expand at a 4.7% CAGR through 2034. This increase can be attributed to the following factors:

  • The strategic application of herbicides is part of a global movement toward integrated pest control techniques. Herbicides are a key component of weed management tactics, which increases their demand in the agricultural activator adjuvant market. Integrated approaches include a variety of control measures.
  • An obstacle to agriculture is the emergence of weeds resistant to herbicides. Farmers use herbicides with various action modes more often to successfully manage weed resistance. This tactic comprises adding adjuvants to herbicides to improve their efficacy, which has increased demand for herbicides with activator adjuvants.

Analysis of Top Countries Producing and Using Agricultural Activator Adjuvants

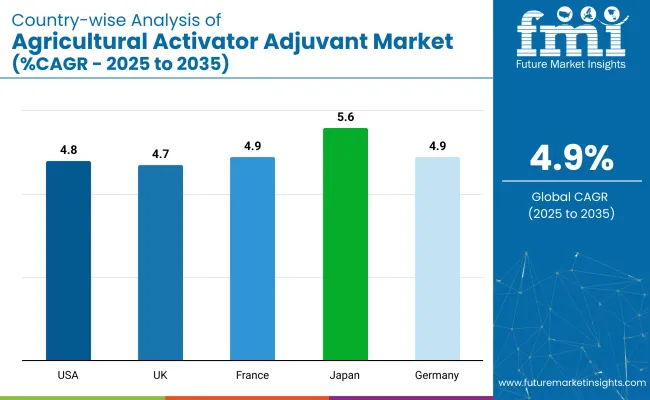
Country Value CAGR (2024 to 2034)
United States 5.2%
United Kingdom 5.5%
China 5.6%
Japan 6.1%
South Korea 7.3%

Trend of Data-centric Farming Bolsters Growth in the United States

The sales of agricultural adjuvants in the United States are estimated to rise at a 5.2% CAGR through 2034. The key factors are:

  • Demand for smart adjuvants is driven by the implementation of smart agricultural techniques, such as data analytics and Internet of Things (IoT) sensors. The development of data-centric farming is supported by companies creating activator adjuvants and utilizing real-time data for accurate application, environmental monitoring, and data-driven insights. These goods are positioned as crucial elements in the era of smart agriculture because of their strategic alignment.
  • The United States agricultural industry is facing issues due to climatic unpredictability, which has increased demand for activator adjuvants that improve crop resilience. Company contributions to climate-resilient farming practices are represented by formulas that account for the effects of climatic variations on pesticide effectiveness. Farmers who deal with erratic weather patterns find resonance in this resilience-focused strategy, which encourages the use of plant productivity adjuvants.

Rising Focus on Regenerative Agriculture Spurs Demand in the United Kingdom

The demand for agricultural adjuvants in the United Kingdom is anticipated to surge at a 5.5% CAGR through 2034. The key drivers are:

  • The United Kingdom's growing interest in regenerative agricultural approaches opens up a niche market for agrarian adjuvants, promoting biodiversity and soil health. Businesses can profit from this trend by marketing adjuvants as parts of regenerative farming techniques, which restore ecosystems and increase overall farm resilience. In addition to improving market penetration, this strategic positioning supports the United Kingdom's goals for sustainability.
  • Opportunities for the growth of the activator adjuvant market are created by the increasing popularity of Integrated Pest Management (IPM) techniques in the United Kingdom's agriculture industry. Complying with Integrated Pest Management (IPM) plans, which prioritize a comprehensive approach to managing pests and diseases, enables enterprises to partner in the United Kingdom's sustainable agricultural agenda.

Government-driven Modernization Initiatives Foster Growth in China

China's agricultural adjuvant market growth is estimated to rise at a 5.6% CAGR through 2034. The key factors are:

  • China's government-led efforts to modernize its agriculture industry are an essential growth accelerator. Precision farming and new technologies are receiving more attention as part of this strategy. Businesses that match the objectives of these modernization programs with their activator adjuvants will have an advantage in a market dominated by government-backed techniques for productivity growth, sustainability, and efficiency.
  • The ubiquity of e-commerce platforms for agrochemical sales in China creates a novel distribution channel for activator adjuvants. Companies that use digital platforms for their sales and marketing have access to a large and geographically diverse market. Strategic collaborations with key e-commerce businesses in China's agriculture industry increase product visibility and aid in market development.

Advanced Agricultural Technology Adoption Boosts Market Expansion in Japan

The demand for agricultural adjuvants in China is predicted to increase at a 6.1% CAGR through 2034. The key drivers are:

  • Japan is in a unique position to benefit from its early embrace of cutting-edge agriculture technology like robots and precision farming. Adjuvant activators that are easily integrated with these technologies complement Japan's tech-driven agricultural landscape by optimizing the performance of automated farming equipment and precise applications.
  • Specialty and quality crop enhancers are highly valued by Japan's discriminating customer base. Adjuvant activators that enhance crop quality, production, and nutritional value align with the market's need for high-quality agricultural products. In this quality-focused industry, companies that position their adjuvants as crop characteristic enhancers that appeal to high-value consumer preferences tend to gain momentum.

Rising Popularity of Urban Agriculture and Rooftop Farming Surges Sales in South Korea

The sales of agricultural adjuvants in South Korea are estimated to rise at a 7.3% CAGR through 2034. The key factors are:

  • South Korea's rising interest in urban agriculture and rooftop gardening is leading to an increased demand for specialized solutions. Activator adjuvants designed to meet the specific needs of urban and rooftop farming operations are gaining popularity in this growing market area.
  • The implementation of smart irrigation systems in South Korea increases the demand for activator adjuvants that improve the efficiency of water-based applications. Products that smoothly interact with smart irrigation technology, optimize water use, and enhance agrochemical efficacy gain momentum.

Competitive Landscape of the Agricultural Activator Adjuvant Market

The agricultural activator adjuvant market is highly competitive, with leading rivals constantly competing to gain market share and strategic positioning. Large global firms, local businesses, and up-and-coming competitors create a competitive environment emphasizing sustainable farming methods, innovation, and strategic alliances. Established businesses use their wide distribution networks, research and development skills, and renowned brands to retain a strong presence in the market.

Recent Developments

  • In December 2023, the Brazilian Association of Agricultural Adjuvant Manufacturers (APLICA) was established in Brazil. According to the industry leaders, the group wants to function as a catalyst for innovation and continuous improvement in the sector, implementing best practices in the manufacturing, use, and handling of solutions.
  • In April 2023, INNVICTIS launched Inntero, a new adjuvant technology. The new technology offers seven unique, multi-functional, and robust adjuvants for a low application rate.

Leading Companies in the Agricultural Activator Adjuvant Industry

  • BASF SE
  • DowDuPont Inc.
  • Akzo Nobel N.V.
  • Croda International Plc
  • Evonik Industries AG
  • Nufarm Limited
  • Solvay S.A.
  • Brandt Consolidated, Inc.
  • Clariant AG
  • Wilbur-Ellis Company

Top Segments Studied in the Agricultural Activator Adjuvant Market

By Product:

  • Activator Adjuvants
    • Surfactants
    • Oil-based Adjuvants
  • Utility Adjuvants
    • Compatibility Agents
    • Drift Control Agents
    • Buffering Agents
    • Water Conditioning Agents
    • Others

By Application:

  • Herbicides
  • Insecticides
  • Fungicides
  • Others

By Source:

  • Petroleum-based
  • Bio-based

By Formulation:

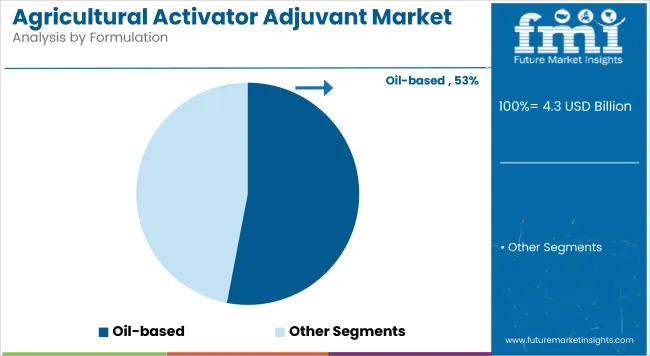
  • Oil-based
  • Others

CropType:

  • Organic
    • Cereals & Grains
    • Oilseeds & Pulses
    • Fruits & Vegetables
    • Others
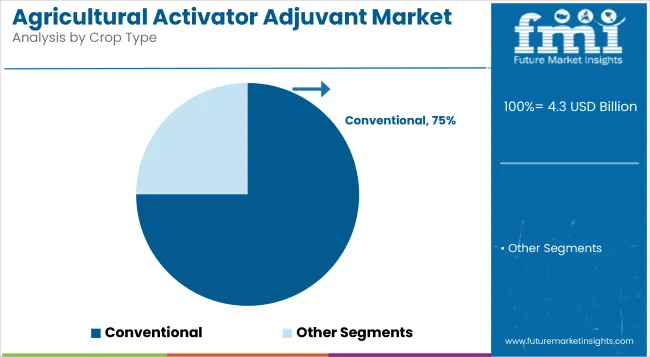
  • Conventional
    • Cereals & Grains
    • Oilseeds & Pulses
    • Fruits & Vegetables
    • Others

By Region:

  • North America
  • Latin America
  • Western Europe
  • Eastern Europe
  • Asia Pacific (APAC)
  • Middle East & Africa (MEA)
  • Japan

Table of Content

  • 1. Executive Summary
  • 2. Market Overview
  • 3. Market Background
  • 4. Global Market Analysis 2019 to 2023 and Forecast, 2024 to 2034
  • 5. Global Market Analysis 2019 to 2023 and Forecast 2024 to 2034, By Adoption Stage
    • 5.1. In-formulation
    • 5.2. Tank-Mix
  • 6. Global Market Analysis 2019 to 2023 and Forecast 2024 to 2034, By Application
    • 6.1. Oil-based Adjuvants
      • 6.1.1. Herbicides
      • 6.1.2. Insecticides
      • 6.1.3. Fungicides
      • 6.1.4. Others
    • 6.2. Surfactants
      • 6.2.1. Herbicides
      • 6.2.2. Insecticides
      • 6.2.3. Fungicides
      • 6.2.4. Others
  • 7. Global Market Analysis 2019 to 2023 and Forecast 2024 to 2034, By Crop Type
    • 7.1. Cereals & Grains
      • 7.1.1. Corn
      • 7.1.2. Wheat
      • 7.1.3. Rice
      • 7.1.4. Others
    • 7.2. Oilseeds & Pulses
      • 7.2.1. Soybeans
      • 7.2.2. Others
    • 7.3. Fruits & Vegetables
      • 7.3.1. Banana
      • 7.3.2. Citrus Fruits
      • 7.3.3. Root & Tuber Vegetables
      • 7.3.4. Leafy Vegetables
      • 7.3.5. Others
  • 8. Global Market Analysis 2019 to 2023 and Forecast 2024 to 2034, By Region
    • 8.1. North America
    • 8.2. Latin America
    • 8.3. Western Europe
    • 8.4. Eastern Europe
    • 8.5. South Asia and Pacific
    • 8.6. East Asia
    • 8.7. Middle East and Africa
  • 9. North America Market Analysis 2019 to 2023 and Forecast 2024 to 2034, By Country
  • 10. Latin America Market Analysis 2019 to 2023 and Forecast 2024 to 2034, By Country
  • 11. Western Europe Market Analysis 2019 to 2023 and Forecast 2024 to 2034, By Country
  • 12. Eastern Europe Market Analysis 2019 to 2023 and Forecast 2024 to 2034, By Country
  • 13. South Asia and Pacific Market Analysis 2019 to 2023 and Forecast 2024 to 2034, By Country
  • 14. East Asia Market Analysis 2019 to 2023 and Forecast 2024 to 2034, By Country
  • 15. Middle East and Africa Market Analysis 2019 to 2023 and Forecast 2024 to 2034, By Country
  • 16. Key Countries Market Analysis
  • 17. Market Structure Analysis
  • 18. Competition Analysis
    • 18.1. Solvay
    • 18.2. BASF SE
    • 18.3. Croda International Plc
    • 18.4. Nufarm
    • 18.5. CHS Inc.
    • 18.6. Clariant
    • 18.7. Innvictis
    • 18.8. Helena Agri-Enterprises, LLC
    • 18.9. Stepan Company
    • 18.10. Miller Chemical & Fertilizer, LLC
  • 19. Assumptions & Acronyms Used
  • 20. Research Methodology

List of Tables

Table 1: Global Market Value (US$ Million) Forecast by Region, 2019 to 2034

Table 2: Global Market Volume (Litre) Forecast by Region, 2019 to 2034

Table 3: Global Market Value (US$ Million) Forecast by Adoption Stage, 2019 to 2034

Table 4: Global Market Volume (Litre) Forecast by Adoption Stage, 2019 to 2034

Table 5: Global Market Value (US$ Million) Forecast by Application, 2019 to 2034

Table 6: Global Market Volume (Litre) Forecast by Application, 2019 to 2034

Table 7: Global Market Value (US$ Million) Forecast by Crop Type, 2019 to 2034

Table 8: Global Market Volume (Litre) Forecast by Crop Type, 2019 to 2034

Table 9: North America Market Value (US$ Million) Forecast by Country, 2019 to 2034

Table 10: North America Market Volume (Litre) Forecast by Country, 2019 to 2034

Table 11: North America Market Value (US$ Million) Forecast by Adoption Stage, 2019 to 2034

Table 12: North America Market Volume (Litre) Forecast by Adoption Stage, 2019 to 2034

Table 13: North America Market Value (US$ Million) Forecast by Application, 2019 to 2034

Table 14: North America Market Volume (Litre) Forecast by Application, 2019 to 2034

Table 15: North America Market Value (US$ Million) Forecast by Crop Type, 2019 to 2034

Table 16: North America Market Volume (Litre) Forecast by Crop Type, 2019 to 2034

Table 17: Latin America Market Value (US$ Million) Forecast by Country, 2019 to 2034

Table 18: Latin America Market Volume (Litre) Forecast by Country, 2019 to 2034

Table 19: Latin America Market Value (US$ Million) Forecast by Adoption Stage, 2019 to 2034

Table 20: Latin America Market Volume (Litre) Forecast by Adoption Stage, 2019 to 2034

Table 21: Latin America Market Value (US$ Million) Forecast by Application, 2019 to 2034

Table 22: Latin America Market Volume (Litre) Forecast by Application, 2019 to 2034

Table 23: Latin America Market Value (US$ Million) Forecast by Crop Type, 2019 to 2034

Table 24: Latin America Market Volume (Litre) Forecast by Crop Type, 2019 to 2034

Table 25: Western Europe Market Value (US$ Million) Forecast by Country, 2019 to 2034

Table 26: Western Europe Market Volume (Litre) Forecast by Country, 2019 to 2034

Table 27: Western Europe Market Value (US$ Million) Forecast by Adoption Stage, 2019 to 2034

Table 28: Western Europe Market Volume (Litre) Forecast by Adoption Stage, 2019 to 2034

Table 29: Western Europe Market Value (US$ Million) Forecast by Application, 2019 to 2034

Table 30: Western Europe Market Volume (Litre) Forecast by Application, 2019 to 2034

Table 31: Western Europe Market Value (US$ Million) Forecast by Crop Type, 2019 to 2034

Table 32: Western Europe Market Volume (Litre) Forecast by Crop Type, 2019 to 2034

Table 33: Eastern Europe Market Value (US$ Million) Forecast by Country, 2019 to 2034

Table 34: Eastern Europe Market Volume (Litre) Forecast by Country, 2019 to 2034

Table 35: Eastern Europe Market Value (US$ Million) Forecast by Adoption Stage, 2019 to 2034

Table 36: Eastern Europe Market Volume (Litre) Forecast by Adoption Stage, 2019 to 2034

Table 37: Eastern Europe Market Value (US$ Million) Forecast by Application, 2019 to 2034

Table 38: Eastern Europe Market Volume (Litre) Forecast by Application, 2019 to 2034

Table 39: Eastern Europe Market Value (US$ Million) Forecast by Crop Type, 2019 to 2034

Table 40: Eastern Europe Market Volume (Litre) Forecast by Crop Type, 2019 to 2034

Table 41: South Asia and Pacific Market Value (US$ Million) Forecast by Country, 2019 to 2034

Table 42: South Asia and Pacific Market Volume (Litre) Forecast by Country, 2019 to 2034

Table 43: South Asia and Pacific Market Value (US$ Million) Forecast by Adoption Stage, 2019 to 2034

Table 44: South Asia and Pacific Market Volume (Litre) Forecast by Adoption Stage, 2019 to 2034

Table 45: South Asia and Pacific Market Value (US$ Million) Forecast by Application, 2019 to 2034

Table 46: South Asia and Pacific Market Volume (Litre) Forecast by Application, 2019 to 2034

Table 47: South Asia and Pacific Market Value (US$ Million) Forecast by Crop Type, 2019 to 2034

Table 48: South Asia and Pacific Market Volume (Litre) Forecast by Crop Type, 2019 to 2034

Table 49: East Asia Market Value (US$ Million) Forecast by Country, 2019 to 2034

Table 50: East Asia Market Volume (Litre) Forecast by Country, 2019 to 2034

Table 51: East Asia Market Value (US$ Million) Forecast by Adoption Stage, 2019 to 2034

Table 52: East Asia Market Volume (Litre) Forecast by Adoption Stage, 2019 to 2034

Table 53: East Asia Market Value (US$ Million) Forecast by Application, 2019 to 2034

Table 54: East Asia Market Volume (Litre) Forecast by Application, 2019 to 2034

Table 55: East Asia Market Value (US$ Million) Forecast by Crop Type, 2019 to 2034

Table 56: East Asia Market Volume (Litre) Forecast by Crop Type, 2019 to 2034

Table 57: Middle East and Africa Market Value (US$ Million) Forecast by Country, 2019 to 2034

Table 58: Middle East and Africa Market Volume (Litre) Forecast by Country, 2019 to 2034

Table 59: Middle East and Africa Market Value (US$ Million) Forecast by Adoption Stage, 2019 to 2034

Table 60: Middle East and Africa Market Volume (Litre) Forecast by Adoption Stage, 2019 to 2034

Table 61: Middle East and Africa Market Value (US$ Million) Forecast by Application, 2019 to 2034

Table 62: Middle East and Africa Market Volume (Litre) Forecast by Application, 2019 to 2034

Table 63: Middle East and Africa Market Value (US$ Million) Forecast by Crop Type, 2019 to 2034

Table 64: Middle East and Africa Market Volume (Litre) Forecast by Crop Type, 2019 to 2034

List of Figures

Figure 1: Global Market Value (US$ Million) by Adoption Stage, 2024 to 2034

Figure 2: Global Market Value (US$ Million) by Application, 2024 to 2034

Figure 3: Global Market Value (US$ Million) by Crop Type, 2024 to 2034

Figure 4: Global Market Value (US$ Million) by Region, 2024 to 2034

Figure 5: Global Market Value (US$ Million) Analysis by Region, 2019 to 2034

Figure 6: Global Market Volume (Litre) Analysis by Region, 2019 to 2034

Figure 7: Global Market Value Share (%) and BPS Analysis by Region, 2024 to 2034

Figure 8: Global Market Y-o-Y Growth (%) Projections by Region, 2024 to 2034

Figure 9: Global Market Value (US$ Million) Analysis by Adoption Stage, 2019 to 2034

Figure 10: Global Market Volume (Litre) Analysis by Adoption Stage, 2019 to 2034

Figure 11: Global Market Value Share (%) and BPS Analysis by Adoption Stage, 2024 to 2034

Figure 12: Global Market Y-o-Y Growth (%) Projections by Adoption Stage, 2024 to 2034

Figure 13: Global Market Value (US$ Million) Analysis by Application, 2019 to 2034

Figure 14: Global Market Volume (Litre) Analysis by Application, 2019 to 2034

Figure 15: Global Market Value Share (%) and BPS Analysis by Application, 2024 to 2034

Figure 16: Global Market Y-o-Y Growth (%) Projections by Application, 2024 to 2034

Figure 17: Global Market Value (US$ Million) Analysis by Crop Type, 2019 to 2034

Figure 18: Global Market Volume (Litre) Analysis by Crop Type, 2019 to 2034

Figure 19: Global Market Value Share (%) and BPS Analysis by Crop Type, 2024 to 2034

Figure 20: Global Market Y-o-Y Growth (%) Projections by Crop Type, 2024 to 2034

Figure 21: Global Market Attractiveness by Adoption Stage, 2024 to 2034

Figure 22: Global Market Attractiveness by Application, 2024 to 2034

Figure 23: Global Market Attractiveness by Crop Type, 2024 to 2034

Figure 24: Global Market Attractiveness by Region, 2024 to 2034

Figure 25: North America Market Value (US$ Million) by Adoption Stage, 2024 to 2034

Figure 26: North America Market Value (US$ Million) by Application, 2024 to 2034

Figure 27: North America Market Value (US$ Million) by Crop Type, 2024 to 2034

Figure 28: North America Market Value (US$ Million) by Country, 2024 to 2034

Figure 29: North America Market Value (US$ Million) Analysis by Country, 2019 to 2034

Figure 30: North America Market Volume (Litre) Analysis by Country, 2019 to 2034

Figure 31: North America Market Value Share (%) and BPS Analysis by Country, 2024 to 2034

Figure 32: North America Market Y-o-Y Growth (%) Projections by Country, 2024 to 2034

Figure 33: North America Market Value (US$ Million) Analysis by Adoption Stage, 2019 to 2034

Figure 34: North America Market Volume (Litre) Analysis by Adoption Stage, 2019 to 2034

Figure 35: North America Market Value Share (%) and BPS Analysis by Adoption Stage, 2024 to 2034

Figure 36: North America Market Y-o-Y Growth (%) Projections by Adoption Stage, 2024 to 2034

Figure 37: North America Market Value (US$ Million) Analysis by Application, 2019 to 2034

Figure 38: North America Market Volume (Litre) Analysis by Application, 2019 to 2034

Figure 39: North America Market Value Share (%) and BPS Analysis by Application, 2024 to 2034

Figure 40: North America Market Y-o-Y Growth (%) Projections by Application, 2024 to 2034

Figure 41: North America Market Value (US$ Million) Analysis by Crop Type, 2019 to 2034

Figure 42: North America Market Volume (Litre) Analysis by Crop Type, 2019 to 2034

Figure 43: North America Market Value Share (%) and BPS Analysis by Crop Type, 2024 to 2034

Figure 44: North America Market Y-o-Y Growth (%) Projections by Crop Type, 2024 to 2034

Figure 45: North America Market Attractiveness by Adoption Stage, 2024 to 2034

Figure 46: North America Market Attractiveness by Application, 2024 to 2034

Figure 47: North America Market Attractiveness by Crop Type, 2024 to 2034

Figure 48: North America Market Attractiveness by Country, 2024 to 2034

Figure 49: Latin America Market Value (US$ Million) by Adoption Stage, 2024 to 2034

Figure 50: Latin America Market Value (US$ Million) by Application, 2024 to 2034

Figure 51: Latin America Market Value (US$ Million) by Crop Type, 2024 to 2034

Figure 52: Latin America Market Value (US$ Million) by Country, 2024 to 2034

Figure 53: Latin America Market Value (US$ Million) Analysis by Country, 2019 to 2034

Figure 54: Latin America Market Volume (Litre) Analysis by Country, 2019 to 2034

Figure 55: Latin America Market Value Share (%) and BPS Analysis by Country, 2024 to 2034

Figure 56: Latin America Market Y-o-Y Growth (%) Projections by Country, 2024 to 2034

Figure 57: Latin America Market Value (US$ Million) Analysis by Adoption Stage, 2019 to 2034

Figure 58: Latin America Market Volume (Litre) Analysis by Adoption Stage, 2019 to 2034

Figure 59: Latin America Market Value Share (%) and BPS Analysis by Adoption Stage, 2024 to 2034

Figure 60: Latin America Market Y-o-Y Growth (%) Projections by Adoption Stage, 2024 to 2034

Figure 61: Latin America Market Value (US$ Million) Analysis by Application, 2019 to 2034

Figure 62: Latin America Market Volume (Litre) Analysis by Application, 2019 to 2034

Figure 63: Latin America Market Value Share (%) and BPS Analysis by Application, 2024 to 2034

Figure 64: Latin America Market Y-o-Y Growth (%) Projections by Application, 2024 to 2034

Figure 65: Latin America Market Value (US$ Million) Analysis by Crop Type, 2019 to 2034

Figure 66: Latin America Market Volume (Litre) Analysis by Crop Type, 2019 to 2034

Figure 67: Latin America Market Value Share (%) and BPS Analysis by Crop Type, 2024 to 2034

Figure 68: Latin America Market Y-o-Y Growth (%) Projections by Crop Type, 2024 to 2034

Figure 69: Latin America Market Attractiveness by Adoption Stage, 2024 to 2034

Figure 70: Latin America Market Attractiveness by Application, 2024 to 2034

Figure 71: Latin America Market Attractiveness by Crop Type, 2024 to 2034

Figure 72: Latin America Market Attractiveness by Country, 2024 to 2034

Figure 73: Western Europe Market Value (US$ Million) by Adoption Stage, 2024 to 2034

Figure 74: Western Europe Market Value (US$ Million) by Application, 2024 to 2034

Figure 75: Western Europe Market Value (US$ Million) by Crop Type, 2024 to 2034

Figure 76: Western Europe Market Value (US$ Million) by Country, 2024 to 2034

Figure 77: Western Europe Market Value (US$ Million) Analysis by Country, 2019 to 2034

Figure 78: Western Europe Market Volume (Litre) Analysis by Country, 2019 to 2034

Figure 79: Western Europe Market Value Share (%) and BPS Analysis by Country, 2024 to 2034

Figure 80: Western Europe Market Y-o-Y Growth (%) Projections by Country, 2024 to 2034

Figure 81: Western Europe Market Value (US$ Million) Analysis by Adoption Stage, 2019 to 2034

Figure 82: Western Europe Market Volume (Litre) Analysis by Adoption Stage, 2019 to 2034

Figure 83: Western Europe Market Value Share (%) and BPS Analysis by Adoption Stage, 2024 to 2034

Figure 84: Western Europe Market Y-o-Y Growth (%) Projections by Adoption Stage, 2024 to 2034

Figure 85: Western Europe Market Value (US$ Million) Analysis by Application, 2019 to 2034

Figure 86: Western Europe Market Volume (Litre) Analysis by Application, 2019 to 2034

Figure 87: Western Europe Market Value Share (%) and BPS Analysis by Application, 2024 to 2034

Figure 88: Western Europe Market Y-o-Y Growth (%) Projections by Application, 2024 to 2034

Figure 89: Western Europe Market Value (US$ Million) Analysis by Crop Type, 2019 to 2034

Figure 90: Western Europe Market Volume (Litre) Analysis by Crop Type, 2019 to 2034

Figure 91: Western Europe Market Value Share (%) and BPS Analysis by Crop Type, 2024 to 2034

Figure 92: Western Europe Market Y-o-Y Growth (%) Projections by Crop Type, 2024 to 2034

Figure 93: Western Europe Market Attractiveness by Adoption Stage, 2024 to 2034

Figure 94: Western Europe Market Attractiveness by Application, 2024 to 2034

Figure 95: Western Europe Market Attractiveness by Crop Type, 2024 to 2034

Figure 96: Western Europe Market Attractiveness by Country, 2024 to 2034

Figure 97: Eastern Europe Market Value (US$ Million) by Adoption Stage, 2024 to 2034

Figure 98: Eastern Europe Market Value (US$ Million) by Application, 2024 to 2034

Figure 99: Eastern Europe Market Value (US$ Million) by Crop Type, 2024 to 2034

Figure 100: Eastern Europe Market Value (US$ Million) by Country, 2024 to 2034

Figure 101: Eastern Europe Market Value (US$ Million) Analysis by Country, 2019 to 2034

Figure 102: Eastern Europe Market Volume (Litre) Analysis by Country, 2019 to 2034

Figure 103: Eastern Europe Market Value Share (%) and BPS Analysis by Country, 2024 to 2034

Figure 104: Eastern Europe Market Y-o-Y Growth (%) Projections by Country, 2024 to 2034

Figure 105: Eastern Europe Market Value (US$ Million) Analysis by Adoption Stage, 2019 to 2034

Figure 106: Eastern Europe Market Volume (Litre) Analysis by Adoption Stage, 2019 to 2034

Figure 107: Eastern Europe Market Value Share (%) and BPS Analysis by Adoption Stage, 2024 to 2034

Figure 108: Eastern Europe Market Y-o-Y Growth (%) Projections by Adoption Stage, 2024 to 2034

Figure 109: Eastern Europe Market Value (US$ Million) Analysis by Application, 2019 to 2034

Figure 110: Eastern Europe Market Volume (Litre) Analysis by Application, 2019 to 2034

Figure 111: Eastern Europe Market Value Share (%) and BPS Analysis by Application, 2024 to 2034

Figure 112: Eastern Europe Market Y-o-Y Growth (%) Projections by Application, 2024 to 2034

Figure 113: Eastern Europe Market Value (US$ Million) Analysis by Crop Type, 2019 to 2034

Figure 114: Eastern Europe Market Volume (Litre) Analysis by Crop Type, 2019 to 2034

Figure 115: Eastern Europe Market Value Share (%) and BPS Analysis by Crop Type, 2024 to 2034

Figure 116: Eastern Europe Market Y-o-Y Growth (%) Projections by Crop Type, 2024 to 2034

Figure 117: Eastern Europe Market Attractiveness by Adoption Stage, 2024 to 2034

Figure 118: Eastern Europe Market Attractiveness by Application, 2024 to 2034

Figure 119: Eastern Europe Market Attractiveness by Crop Type, 2024 to 2034

Figure 120: Eastern Europe Market Attractiveness by Country, 2024 to 2034

Figure 121: South Asia and Pacific Market Value (US$ Million) by Adoption Stage, 2024 to 2034

Figure 122: South Asia and Pacific Market Value (US$ Million) by Application, 2024 to 2034

Figure 123: South Asia and Pacific Market Value (US$ Million) by Crop Type, 2024 to 2034

Figure 124: South Asia and Pacific Market Value (US$ Million) by Country, 2024 to 2034

Figure 125: South Asia and Pacific Market Value (US$ Million) Analysis by Country, 2019 to 2034

Figure 126: South Asia and Pacific Market Volume (Litre) Analysis by Country, 2019 to 2034

Figure 127: South Asia and Pacific Market Value Share (%) and BPS Analysis by Country, 2024 to 2034

Figure 128: South Asia and Pacific Market Y-o-Y Growth (%) Projections by Country, 2024 to 2034

Figure 129: South Asia and Pacific Market Value (US$ Million) Analysis by Adoption Stage, 2019 to 2034

Figure 130: South Asia and Pacific Market Volume (Litre) Analysis by Adoption Stage, 2019 to 2034

Figure 131: South Asia and Pacific Market Value Share (%) and BPS Analysis by Adoption Stage, 2024 to 2034

Figure 132: South Asia and Pacific Market Y-o-Y Growth (%) Projections by Adoption Stage, 2024 to 2034

Figure 133: South Asia and Pacific Market Value (US$ Million) Analysis by Application, 2019 to 2034

Figure 134: South Asia and Pacific Market Volume (Litre) Analysis by Application, 2019 to 2034

Figure 135: South Asia and Pacific Market Value Share (%) and BPS Analysis by Application, 2024 to 2034

Figure 136: South Asia and Pacific Market Y-o-Y Growth (%) Projections by Application, 2024 to 2034

Figure 137: South Asia and Pacific Market Value (US$ Million) Analysis by Crop Type, 2019 to 2034

Figure 138: South Asia and Pacific Market Volume (Litre) Analysis by Crop Type, 2019 to 2034

Figure 139: South Asia and Pacific Market Value Share (%) and BPS Analysis by Crop Type, 2024 to 2034

Figure 140: South Asia and Pacific Market Y-o-Y Growth (%) Projections by Crop Type, 2024 to 2034

Figure 141: South Asia and Pacific Market Attractiveness by Adoption Stage, 2024 to 2034

Figure 142: South Asia and Pacific Market Attractiveness by Application, 2024 to 2034

Figure 143: South Asia and Pacific Market Attractiveness by Crop Type, 2024 to 2034

Figure 144: South Asia and Pacific Market Attractiveness by Country, 2024 to 2034

Figure 145: East Asia Market Value (US$ Million) by Adoption Stage, 2024 to 2034

Figure 146: East Asia Market Value (US$ Million) by Application, 2024 to 2034

Figure 147: East Asia Market Value (US$ Million) by Crop Type, 2024 to 2034

Figure 148: East Asia Market Value (US$ Million) by Country, 2024 to 2034

Figure 149: East Asia Market Value (US$ Million) Analysis by Country, 2019 to 2034

Figure 150: East Asia Market Volume (Litre) Analysis by Country, 2019 to 2034

Figure 151: East Asia Market Value Share (%) and BPS Analysis by Country, 2024 to 2034

Figure 152: East Asia Market Y-o-Y Growth (%) Projections by Country, 2024 to 2034

Figure 153: East Asia Market Value (US$ Million) Analysis by Adoption Stage, 2019 to 2034

Figure 154: East Asia Market Volume (Litre) Analysis by Adoption Stage, 2019 to 2034

Figure 155: East Asia Market Value Share (%) and BPS Analysis by Adoption Stage, 2024 to 2034

Figure 156: East Asia Market Y-o-Y Growth (%) Projections by Adoption Stage, 2024 to 2034

Figure 157: East Asia Market Value (US$ Million) Analysis by Application, 2019 to 2034

Figure 158: East Asia Market Volume (Litre) Analysis by Application, 2019 to 2034

Figure 159: East Asia Market Value Share (%) and BPS Analysis by Application, 2024 to 2034

Figure 160: East Asia Market Y-o-Y Growth (%) Projections by Application, 2024 to 2034

Figure 161: East Asia Market Value (US$ Million) Analysis by Crop Type, 2019 to 2034

Figure 162: East Asia Market Volume (Litre) Analysis by Crop Type, 2019 to 2034

Figure 163: East Asia Market Value Share (%) and BPS Analysis by Crop Type, 2024 to 2034

Figure 164: East Asia Market Y-o-Y Growth (%) Projections by Crop Type, 2024 to 2034

Figure 165: East Asia Market Attractiveness by Adoption Stage, 2024 to 2034

Figure 166: East Asia Market Attractiveness by Application, 2024 to 2034

Figure 167: East Asia Market Attractiveness by Crop Type, 2024 to 2034

Figure 168: East Asia Market Attractiveness by Country, 2024 to 2034

Figure 169: Middle East and Africa Market Value (US$ Million) by Adoption Stage, 2024 to 2034

Figure 170: Middle East and Africa Market Value (US$ Million) by Application, 2024 to 2034

Figure 171: Middle East and Africa Market Value (US$ Million) by Crop Type, 2024 to 2034

Figure 172: Middle East and Africa Market Value (US$ Million) by Country, 2024 to 2034

Figure 173: Middle East and Africa Market Value (US$ Million) Analysis by Country, 2019 to 2034

Figure 174: Middle East and Africa Market Volume (Litre) Analysis by Country, 2019 to 2034

Figure 175: Middle East and Africa Market Value Share (%) and BPS Analysis by Country, 2024 to 2034

Figure 176: Middle East and Africa Market Y-o-Y Growth (%) Projections by Country, 2024 to 2034

Figure 177: Middle East and Africa Market Value (US$ Million) Analysis by Adoption Stage, 2019 to 2034

Figure 178: Middle East and Africa Market Volume (Litre) Analysis by Adoption Stage, 2019 to 2034

Figure 179: Middle East and Africa Market Value Share (%) and BPS Analysis by Adoption Stage, 2024 to 2034

Figure 180: Middle East and Africa Market Y-o-Y Growth (%) Projections by Adoption Stage, 2024 to 2034

Figure 181: Middle East and Africa Market Value (US$ Million) Analysis by Application, 2019 to 2034

Figure 182: Middle East and Africa Market Volume (Litre) Analysis by Application, 2019 to 2034

Figure 183: Middle East and Africa Market Value Share (%) and BPS Analysis by Application, 2024 to 2034

Figure 184: Middle East and Africa Market Y-o-Y Growth (%) Projections by Application, 2024 to 2034

Figure 185: Middle East and Africa Market Value (US$ Million) Analysis by Crop Type, 2019 to 2034

Figure 186: Middle East and Africa Market Volume (Litre) Analysis by Crop Type, 2019 to 2034

Figure 187: Middle East and Africa Market Value Share (%) and BPS Analysis by Crop Type, 2024 to 2034

Figure 188: Middle East and Africa Market Y-o-Y Growth (%) Projections by Crop Type, 2024 to 2034

Figure 189: Middle East and Africa Market Attractiveness by Adoption Stage, 2024 to 2034

Figure 190: Middle East and Africa Market Attractiveness by Application, 2024 to 2034

Figure 191: Middle East and Africa Market Attractiveness by Crop Type, 2024 to 2034

Figure 192: Middle East and Africa Market Attractiveness by Country, 2024 to 2034

Frequently Asked Questions

How Big is the Agricultural Activator Adjuvant Market?

The agricultural activator adjuvant market is valued at USD 4.1 billion in 2024.

What is the Projected CAGR of the Agricultural Activator Adjuvant Market?

The agricultural activator adjuvant market size is estimated to increase at a 4.9% CAGR through 2034.

What is the Future Outlook for the Agricultural Activator Adjuvant Market?

The agricultural activator adjuvant market is anticipated to be worth USD 6.6 billion by 2034.

Which is the Leading Product in the Agricultural Activator Adjuvant Market?

Activator adjuvants witness high demand in the industry.

Which Country is Rising at a Higher CAGR in the Agricultural Activator Adjuvant Market?

The agricultural activator adjuvant market in South Korea is predicted to rise at a 7.3% CAGR through 2034.

Explore Similar Insights

Future Market Insights

Agricultural Activator Adjuvant Market