The Cytogenetic Systems Market is estimated to be valued at USD 2.3 billion in 2025 and is projected to reach USD 6.6 billion by 2035, registering a compound annual growth rate (CAGR) of 11.0% over the forecast period.
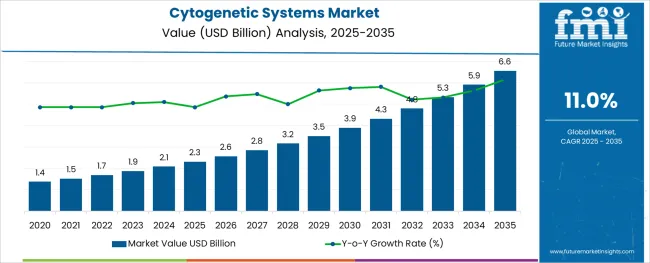
The cytogenetic systems market is expanding steadily due to the increasing need for precise genetic analysis and diagnosis. Advancements in molecular biology and genetics have driven demand for sophisticated cytogenetic technologies capable of detecting chromosomal abnormalities and genetic mutations. Fluorescence in situ hybridization has become a critical technology in identifying genetic disorders, providing high sensitivity and specificity.
Diagnostic laboratories have been upgrading their capabilities to incorporate these technologies, responding to growing clinical demands. Public health initiatives promoting early genetic screening and personalized medicine have also contributed to market growth.
The integration of automated and high-throughput cytogenetic platforms has enhanced laboratory efficiency. As genetic testing becomes more accessible, the market is expected to grow, led by fluorescence in situ hybridization technology, applications in genetic disorder diagnosis, and widespread use in diagnostic laboratory centers.
The market is segmented by Technology, Application, and End User and region. By Technology, the market is divided into Fluorescence In Situ Hybridization (FISH), Flow Cytometry, Multiplex-Fluorescence In Situ Hybridization (M-FISH), and Comparative Genomic Hybridization (CGH). In terms of Application, the market is classified into Genetic Disorders, Neoplastic Diseases, Personalized Medicine, and Others.
Based on End User, the market is segmented into Diagnostic Laboratory Centers, Hospitals, Clinics, and Research Institutes. Regionally, the market is classified into North America, Latin America, Western Europe, Eastern Europe, Balkan & Baltic Countries, Russia & Belarus, Central Asia, East Asia, South Asia & Pacific, and the Middle East & Africa.
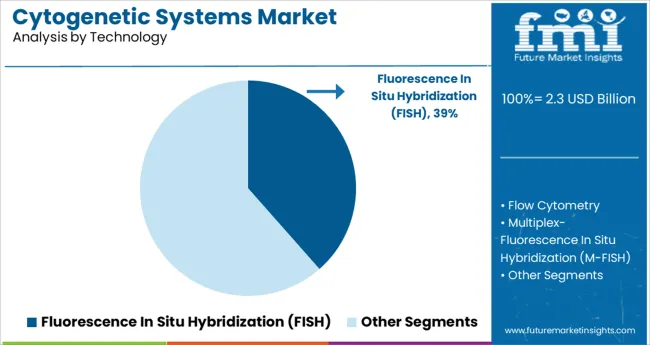
The Fluorescence in Situ Hybridization segment is projected to hold 38.5% of the cytogenetic systems market revenue in 2025. This technology’s growth is driven by its ability to provide precise localization of specific DNA sequences on chromosomes, enabling detailed genetic mapping. It is widely used to detect structural and numerical chromosome abnormalities associated with various genetic disorders and cancers.
Laboratories favor FISH for its high sensitivity and ability to analyze both dividing and non-dividing cells. The technique supports rapid diagnosis which aids in timely clinical decision-making.
As advances in probe design and imaging technologies continue, FISH remains a preferred cytogenetic technique in clinical settings.
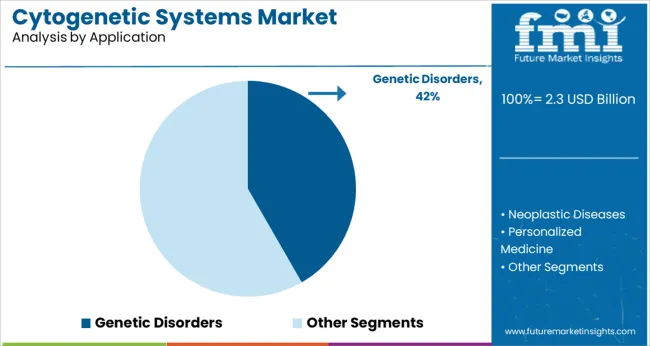
The Genetic Disorders segment is expected to account for 41.7% of the market revenue in 2025. This segment’s growth has been fueled by increased awareness and diagnosis of inherited conditions and chromosomal abnormalities. Cytogenetic testing plays a vital role in identifying genetic disorders early, allowing for better management and counseling.
Growing prevalence of genetic diseases and the demand for prenatal and postnatal screening have expanded this segment.
As genetic research progresses, more conditions are being linked to chromosomal abnormalities, broadening the application scope of cytogenetic systems.
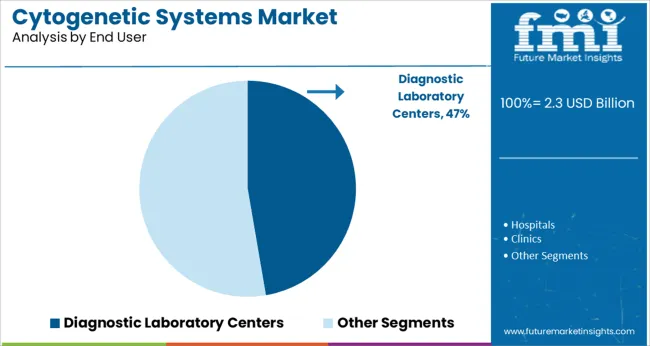
Diagnostic Laboratory Centers are projected to represent 47.3% of the cytogenetic systems market revenue in 2025. This segment leads due to the central role of these facilities in genetic testing and disease diagnosis. Laboratories are equipped with advanced cytogenetic platforms to provide comprehensive genetic analysis services.
The segment benefits from increasing investment in diagnostic infrastructure and a rising number of tests performed for hereditary and acquired genetic conditions.
Diagnostic centers are also adopting automation to improve throughput and reduce turnaround times. With growing demand for genetic diagnostics, these centers continue to drive market growth.
The rising demand of early diagnosis of severe life-threatening diseases such as cancer and diagnosis of disorders due to chromosomal anomalies in developing embryos, is one of the major factors that is expected to augment the growth of the Cytogenetic Systems market over the analysis period.
In addition, expansion of geriatric population pool, rising exposure to dangerous chemicals and ultraviolet rays, increase in numbers of people adopting bad habits such as smoking and drinking and the sedentary lifestyle are some other factors that are anticipated to accelerate the growth of the market in the near future.
The growth of the global cytogenetics market is majorly driven by increase in incidence of genetic disorders and cancer. Other factors boosting the market growth include increase in focus on targeted cancer treatment, rise in aging population, and increase in prevalence of chronic diseases. Conversely, transition from fluorescence in situ hybridization to array based is expected to provide lucrative growth opportunities for the global market.
There are some factors which are expected to impede the growth of the Cytogenetic Systems market over the analysis period, such as technical limitations and complexities associated with the equipment.
However, high cost of cytogenetic instruments, and lack of awareness about advanced technological methodologies, especially in low and middle income countries and high cost of sophisticated devices are also expected to hinder the market growth during the forecast period.
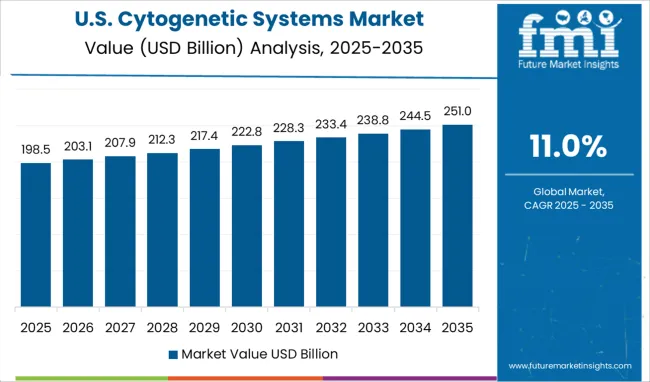
In terms of regional platform, North America holds a significant market share in Cytogenetic Systems market. The region is expected to surge at over 42.1% share from 2025 to 2035.
North America is expected to witness promising growth, attributed to rising awareness about molecular cytogenetics, growing number of diagnostic laboratories and research institutions focused on cytogenetics in the region.
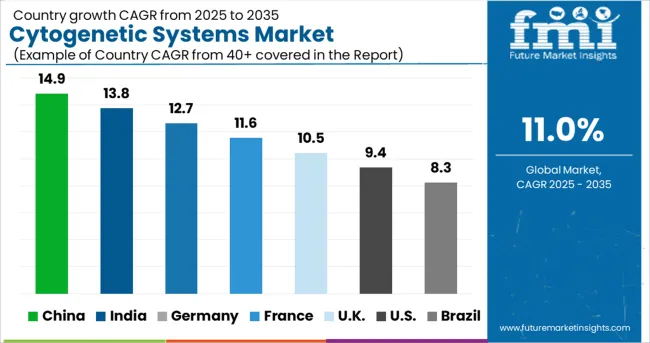
According to Future Market Insights, Europe is expected to provide immense growth opportunities for Cytogenetic Systems, and is expected to reach at a highest share of 27.3% in 2025.
Europe is expected to witness the largest market growth, owing to the presence of a huge population in need, high birth rate, rising caseload of pre and postnatal disorders, and increasing number of cases of different types of cancer.
There are many prominent market players in the cytogenetic systems market, working hand-in-hand to provide the best-in-class cytogenetic systems for enhancing the global cytogenetic arena. However, there are many global start-ups in the cytogenetic systems market, who are stepping forward in matching the requirements of the cytogenetic systems domain.
Global Startups of Cytogenetic Systems Market:
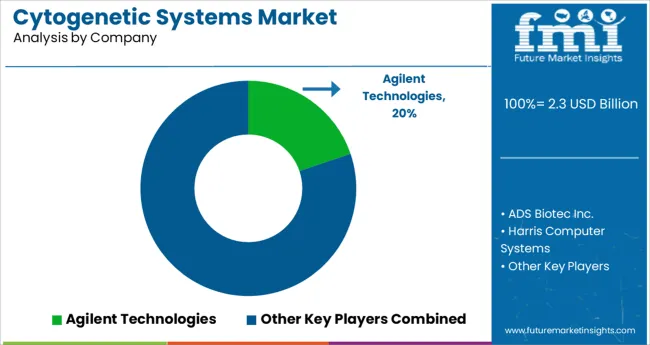
Some of the key participants present in the global Cytogenetic Systems market include ADS Biotec Inc., Genial Genetics, Laboratory Imaging s.r.o., MetaSystems, Agilent Technologies, Cytocell Ltd, Leica Biosystems Nussloch GmbH, Applied Spectral Imaging, Irvine Scientific, PerkinElmer Inc., Bio-Rad Laboratories, Inc. and Abbott Laboratories, among others.
Attributed to the presence of such high number of participants, the market is highly competitive. While global players such as ADS Biotec Inc., Genial Genetics, Laboratory Imaging s.r.o., and MetaSystems account for a considerable market size, several regional level players are also operating across key growth regions, particularly in North America.
Recent Developments
| Report Attribute | Details |
|---|---|
| Growth Rate | CAGR of 11.0% from 2025 to 2035 |
| Market Value in 2025 | USD 1,688.5 Million |
| Market Value in 2035 | USD 5,327.8 Million |
| Base Year for Estimation | 2024 |
| Historical Data | 2020 to 2024 |
| Forecast Period | 2025 to 2035 |
| Quantitative Units | Revenue in USD Million and CAGR from 2025 to 2035 |
| Report Coverage | Revenue Forecast, Volume Forecast, Company Ranking, Competitive Landscape, Growth Factors, Trends and Pricing Analysis |
| Segments Covered | Technology, Application, End User, Region |
| Regions Covered | North America, Latin America, Europe, Asia Pacific, Middle East &, Africa |
| Key Countries Profiled | USA, Canada, Brazil, Mexico, Germany, UK, France, Spain, Italy, China, Japan, South Korea, GCC, South Africa, Israel |
| Key Companies Profiled | ADS Biotec Inc., Harris Computer Systems, Laboratory Imaging s.r.o, MetaSystems, Agilent Technologies, OGT Ltd., Leica Biosystems Nussloch GmbH, Applied Spectral Imaging, PerkinElmer Inc., Bio-Rad Laboratories, Abbott Laboratories |
| Customization | Available Upon Request |
The global cytogenetic systems market is estimated to be valued at USD 2.3 billion in 2025.
It is projected to reach USD 6.6 billion by 2035.
The market is expected to grow at a 11.0% CAGR between 2025 and 2035.
The key product types are fluorescence in situ hybridization (fish), flow cytometry, multiplex-fluorescence in situ hybridization (m-fish) and comparative genomic hybridization (cgh).
genetic disorders segment is expected to dominate with a 41.7% industry share in 2025.


Our Research Products

The "Full Research Suite" delivers actionable market intel, deep dives on markets or technologies, so clients act faster, cut risk, and unlock growth.

The Leaderboard benchmarks and ranks top vendors, classifying them as Established Leaders, Leading Challengers, or Disruptors & Challengers.

Locates where complements amplify value and substitutes erode it, forecasting net impact by horizon

We deliver granular, decision-grade intel: market sizing, 5-year forecasts, pricing, adoption, usage, revenue, and operational KPIs—plus competitor tracking, regulation, and value chains—across 60 countries broadly.

Spot the shifts before they hit your P&L. We track inflection points, adoption curves, pricing moves, and ecosystem plays to show where demand is heading, why it is changing, and what to do next across high-growth markets and disruptive tech

Real-time reads of user behavior. We track shifting priorities, perceptions of today’s and next-gen services, and provider experience, then pace how fast tech moves from trial to adoption, blending buyer, consumer, and channel inputs with social signals (#WhySwitch, #UX).

Partner with our analyst team to build a custom report designed around your business priorities. From analysing market trends to assessing competitors or crafting bespoke datasets, we tailor insights to your needs.
Supplier Intelligence
Discovery & Profiling
Capacity & Footprint
Performance & Risk
Compliance & Governance
Commercial Readiness
Who Supplies Whom
Scorecards & Shortlists
Playbooks & Docs
Category Intelligence
Definition & Scope
Demand & Use Cases
Cost Drivers
Market Structure
Supply Chain Map
Trade & Policy
Operating Norms
Deliverables
Buyer Intelligence
Account Basics
Spend & Scope
Procurement Model
Vendor Requirements
Terms & Policies
Entry Strategy
Pain Points & Triggers
Outputs
Pricing Analysis
Benchmarks
Trends
Should-Cost
Indexation
Landed Cost
Commercial Terms
Deliverables
Brand Analysis
Positioning & Value Prop
Share & Presence
Customer Evidence
Go-to-Market
Digital & Reputation
Compliance & Trust
KPIs & Gaps
Outputs
Full Research Suite comprises of:
Market outlook & trends analysis
Interviews & case studies
Strategic recommendations
Vendor profiles & capabilities analysis
5-year forecasts
8 regions and 60+ country-level data splits
Market segment data splits
12 months of continuous data updates
DELIVERED AS:
PDF EXCEL ONLINE
Systems Administration Management Tools Market Size and Share Forecast Outlook 2025 to 2035
VRF Systems Market Growth - Trends & Forecast 2025 to 2035
Cloud Systems Management Software Market Size and Share Forecast Outlook 2025 to 2035
Hi-Fi Systems Market Size and Share Forecast Outlook 2025 to 2035
Cough systems Market
Backpack Systems Market Size and Share Forecast Outlook 2025 to 2035
Unmanned Systems Market Analysis - Size, Share, & Forecast Outlook 2025 to 2035
DC Power Systems Market Trends - Growth, Demand & Forecast 2025 to 2035
Catheter Systems Market
Reporter Systems Market
Aerostat Systems Market
Cryogenic Systems Market Size and Share Forecast Outlook 2025 to 2035
Molecular Cytogenetics Market Size and Share Forecast Outlook 2025 to 2035
Air Brake Systems Market Growth & Demand 2025 to 2035
Metrology Systems Market
Fluid Bed Systems Market
Cognitive Systems Spending Market Report – Growth & Forecast 2016-2026
Nurse Call Systems Market Insights - Size, Share & Forecast 2025 to 2035
Excitation Systems Market Analysis – Growth, Demand & Forecast 2025 to 2035
Fire Alarm Systems Market by Solution by Application & Region Forecast till 2035

Thank you!
You will receive an email from our Business Development Manager. Please be sure to check your SPAM/JUNK folder too.
Chat With
MaRIA