The dechlorination chemical market is projected to grow from USD 1.5 billion in 2025 to USD 2.5 billion by 2035, advancing at a CAGR of 5.7%. Growth is supported by rising wastewater treatment volumes, stricter discharge regulations, and increased reliance on chemical neutralization in municipal, industrial, and environmental remediation applications. Dechlorination agents play a critical role in ensuring regulatory compliance for effluent quality by neutralizing free chlorine and chloramines that can harm aquatic ecosystems, corrode distribution infrastructure, or disrupt downstream biological treatment processes. Their use is expanding across power generation cooling systems, food & beverage plants, pulp & paper mills, and large-scale irrigation projects.
Sodium bisulfite and sodium metabisulfite remain the dominant chemical categories due to their cost-effectiveness, dosing efficiency, and compatibility with automated feed systems, while activated carbon and ascorbic acid solutions gain traction in sensitive applications requiring non-sulfur alternatives. Municipal wastewater treatment represents the largest application segment, followed by industrial water management, where high throughput and variable chlorine loads necessitate reliable and rapid chemical reduction. Regionally, Asia Pacific leads global expansion with rising urbanization and water reuse projects, while North America and Europe maintain steady demand driven by stringent environmental standards. Competitive dynamics focus on formulation purity, delivery reliability, and technical dosing support as suppliers strengthen long-term partnerships with utilities and industrial operators.
One of the strongest drivers of market expansion is the rising demand for treated water across urban and industrial regions. As municipalities upgrade filtration and disinfection infrastructures, the need for precise dechlorination chemicals increases to ensure water is safe for downstream distribution, aquatic discharge, and industrial reuse. Residual chlorine can harm aquatic ecosystems, interfere with biological treatment processes, and corrode equipment. Dechlorination chemicals help utilities achieve regulatory compliance while supporting sustainable water recycling practices. With population growth and urbanization expanding global water consumption, the importance of controlled dechlorination continues to rise.
Industrial sectors are also contributing significantly to market growth. Power plants, petrochemical facilities, textile factories, pharmaceutical plants, and food processors rely on dechlorination chemicals to neutralize chlorine before wastewater discharge or reuse. In industries using membranes and advanced filtration systems, dechlorination is necessary to protect equipment from oxidative damage. As industries adopt zero-liquid-discharge (ZLD) frameworks and closed-loop water systems, the need for accurate and efficient dechlorination solutions is intensifying. Growing investment in industrial water recycling is expected to strengthen long-term demand for high-performance chemicals.
Regional trends show strong adoption across North America and Europe, where water quality regulations are stringent and industrial wastewater frameworks are well established. Rapid growth in Asia-Pacific, the Middle East, and Latin America is driven by expanding industrialization, infrastructure development, and greater investment in wastewater treatment facilities.
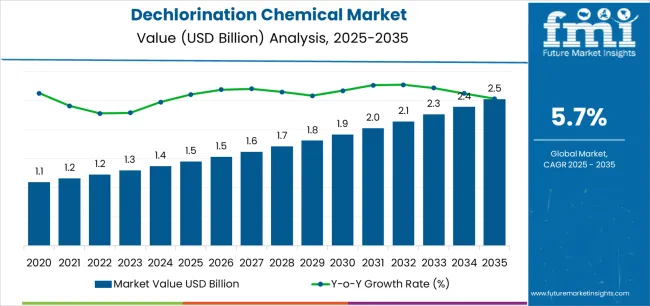
The overall market size is expected to grow by approximately 1.7 times during the same period, supported by increasing demand for safe water treatment solutions worldwide, driving demand for efficient chlorine neutralization systems and increasing investments in municipal wastewater infrastructure and industrial water quality management projects globally.
However, handling complexity of sulfur-based chemicals and potential regulatory constraints on chemical discharge may pose challenges to market expansion.
Between 2025 and 2030, the dechlorination chemical market is projected to expand from USD 1.45 billion to USD 1.94 billion, resulting in a value increase of USD 486 million, which represents 45.0% of the total forecast growth for the decade.
This phase of development will be shaped by rising demand for municipal water treatment and industrial wastewater management applications, product innovation in liquid formulation technologies and automated dosing systems, as well as expanding integration with zero liquid discharge initiatives and advanced water quality monitoring platforms.
Companies are establishing competitive positions through investment in production capacity expansion, sustainable chemical manufacturing solutions, and strategic market expansion across water treatment, food processing, and industrial applications.
From 2030 to 2035, the market is forecast to grow from USD 1.94 billion to USD 2.5 billion, adding another USD 594 million, which constitutes 55.0% of the overall ten-year expansion. This period is expected to be characterized by the expansion of specialized chemical formulations, including high-purity grades and integrated dechlorination solutions tailored for specific industry requirements, strategic collaborations between chemical manufacturers and water treatment technology providers, and an enhanced focus on production efficiency and environmental sustainability.
The growing emphasis on water quality optimization and sustainable manufacturing processes will drive demand for advanced, high-performance dechlorination chemical solutions across diverse municipal and industrial applications.
| Metric | Value |
|---|---|
| Market Value (2025) | USD 1.5 billion |
| Market Forecast Value (2035) | USD 2.5 billion |
| Forecast CAGR (2025 to 2035) | 5.7% |
The dechlorination chemical market grows by enabling municipal utilities and industrial facilities to neutralize residual chlorine in treated water before discharge, ensuring compliance with increasingly stringent environmental regulations worldwide. Water treatment operations face mounting pressure to eliminate chlorine residuals that can harm aquatic ecosystems, with dechlorination chemicals providing rapid and cost-effective neutralization while offering safer handling characteristics compared to alternative technologies. The expansion of municipal water infrastructure in emerging economies, coupled with aging water treatment facility retrofits in developed markets, creates sustained demand for reliable dechlorination solutions that integrate seamlessly with existing chlorination systems.
Government mandates for wastewater discharge quality and zero liquid discharge adoption in water-stressed regions drive increased consumption across industrial water management applications. The food and beverage industry's reliance on dechlorination chemicals for process water treatment, combined with pharmaceutical and electronics sectors requiring ultrapure water systems, creates stable demand across regulated end-use segments. However, the complexity of sulfur-based chemical handling and storage requirements may limit adoption among smaller facilities lacking specialized infrastructure, while potential regulatory restrictions on sulfite discharge concentrations could impact application practices in environmentally sensitive regions.
The market is segmented by chemical type, end use, form, and region. By chemical type, the market is divided into sulfur-based chemicals, sodium bisulfite, sodium metabisulfite, sodium sulfite, and sulfur dioxide. Based on end use, the market is categorized into water treatment, food & beverages, textile, pharmaceuticals, and others. By form, the market is segmented into liquid and solid. Regionally, the market is divided into Asia-Pacific, North America, Europe, Latin America, and Middle East & Africa.
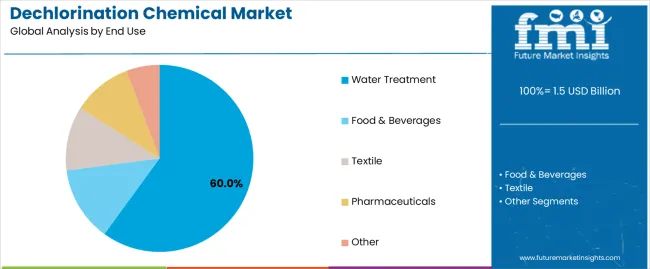
Water treatment applications dominate the dechlorination chemical market with approximately 60.0% market share in 2025, reflecting the critical role of dechlorination in municipal wastewater treatment, drinking water production, and industrial effluent management systems worldwide.
The water treatment segment's market leadership is reinforced by expanding municipal infrastructure investments, increasingly stringent discharge regulations, and growing industrial adoption of advanced wastewater treatment systems requiring effective chlorine residual removal.
The food & beverages segment represents the second-largest application category, capturing 18.0% market share through specialized requirements for process water treatment and beverage production applications. The textile segment accounts for 12.0% market share, serving manufacturers requiring dechlorination in dyeing and finishing operations. The pharmaceuticals segment captures 6.0% market share through ultrapure water system requirements, while other applications represent 4.0% of the market.
Key market dynamics supporting application growth include:
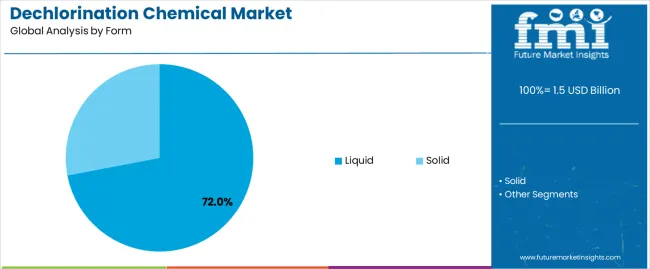
The liquid form segment dominates the dechlorination chemical market with approximately 72.0% market share in 2025, driven by ease of handling, automated dosing capabilities, and seamless integration with existing water treatment infrastructure.
Liquid formulations offer advantages in municipal and large-scale industrial applications where continuous chemical feed systems and precise dosing control are essential for maintaining consistent water quality and operational efficiency. The segment's leadership is reinforced by compatibility with automated monitoring and control systems, reduced dust exposure concerns compared to solid handling, and simplified storage requirements in temperature-controlled environments.
The solid form segment maintains 28.0% market share, serving applications where concentrated chemical delivery is preferred, storage space is limited, or intermittent batch treatment operations are employed. Solid formulations provide advantages in transportation efficiency, extended shelf life under proper storage conditions, and flexibility for facilities lacking liquid chemical handling infrastructure.
Key factors driving liquid segment dominance include:
The market is driven by three concrete demand factors tied to regulatory compliance and environmental protection outcomes. First, stringent environmental regulations governing chlorine residual discharge create mandatory dechlorination requirements, with global water quality standards increasingly limiting allowable chlorine concentrations in effluent discharge to protect aquatic ecosystems and downstream water users.
Municipal utilities across developed and emerging markets face enforcement actions and penalties for non-compliance, driving consistent chemical consumption for chlorine neutralization before discharge. Second, expanding municipal water infrastructure and industrial wastewater treatment capacity increase total addressable market, with global wastewater treatment investment projected to exceed USD 200 billion annually, requiring comprehensive chemical treatment solutions including effective dechlorination capabilities.
Market restraints include handling and safety concerns associated with sulfur-based chemicals, particularly sodium bisulfite and metabisulfite formulations that release sulfur dioxide gas under acidic conditions or elevated temperatures, requiring specialized ventilation systems and worker protection protocols that increase operational complexity and cost.
Raw material price volatility for sulfur feedstocks can impact production costs and profitability margins during periods of supply chain disruption or commodity price fluctuations affecting chemical manufacturers and end users. Alternative dechlorination technologies including activated carbon filtration, ultraviolet treatment, and catalytic reduction systems provide competition in specific applications, particularly where chemical handling concerns or discharge limitations favor non-chemical approaches.
Key trends indicate accelerated adoption of automated chemical dosing systems integrating real-time monitoring and control capabilities, enabling optimized chemical consumption and consistent treatment performance while reducing manual intervention and operational costs. Liquid formulation preferences continue strengthening in municipal and large-scale industrial applications, driven by automation compatibility and simplified handling compared to solid chemical dissolution requirements.
Asia-Pacific market expansion leads global growth, with China and India implementing comprehensive wastewater treatment infrastructure and industrial environmental compliance programs. Pharmaceutical and food-grade formulation development addresses high-purity application requirements in regulated industries demanding stringent quality specifications and comprehensive documentation.
However, the market thesis could face disruption if alternative chlorine neutralization technologies achieve cost parity with chemical approaches or if regulatory frameworks shift toward limiting sulfite discharge concentrations in environmentally sensitive watersheds.
| Country | CAGR (2025 to 2035) |
|---|---|
| India | 6.4% |
| China | 6.1% |
| South Korea | 5.9% |
| Brazil | 5.1% |
| USA | 4.8% |
| UK | 4.6% |
| Germany | 4.4% |
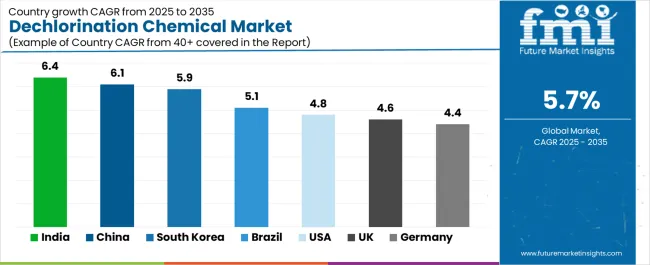
The dechlorination chemical market is gaining momentum worldwide, with India taking the lead thanks to industrial zero liquid discharge projects and municipal water reuse infrastructure build-out driving chemical treatment demand. Close behind, China benefits from stricter effluent norms and large industrial wastewater base, positioning itself as a strategic manufacturing hub in the Asia-Pacific region.
South Korea shows steady advancement, where electronics and semiconductor ultrapure water dechlorination needs strengthen its role in high-technology water treatment applications. Brazil is focusing on pulp & paper and beverage capacity expansion, signaling an ambition to capitalize on growing opportunities in Latin American industrial markets.
The USA stands out for its aging plant retrofits and tight discharge permits, and the UK and Germany continue to record consistent progress in urban wastewater upgrades and pharma/food-grade water applications. Together, India and China anchor the global expansion story, while the rest build stability and diversity into the market's growth path.
The report covers an in-depth analysis of 40+ countries top-performing countries are highlighted below.
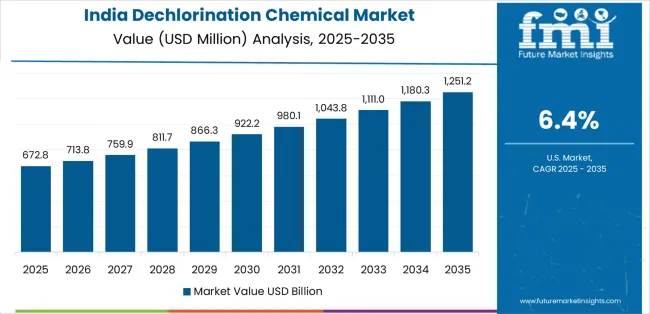
India demonstrates the strongest growth potential in the Dechlorination Chemical Market with a CAGR of 6.4% through 2035. The country's leadership position stems from industrial zero liquid discharge project mandates, municipal water reuse infrastructure development, and aggressive wastewater treatment facility construction, driving the adoption of effective chlorine neutralization systems.
Growth is concentrated in major industrial regions, including Maharashtra, Gujarat, Tamil Nadu, and Uttar Pradesh, where textile manufacturers, chemical processors, pharmaceutical facilities, and municipal utilities are implementing dechlorination solutions for environmental compliance and water quality management.
Distribution channels through established chemical distributors and direct manufacturer relationships expand deployment across industrial facilities and municipal water treatment plants. The country's National Water Mission and revised wastewater discharge standards provide policy support for advanced chemical treatment system adoption.
Key market factors:
In Beijing, Shanghai, Guangzhou, and Shenzhen, the adoption of dechlorination chemical systems is accelerating across industrial wastewater treatment facilities, municipal water plants, and food processing centers, driven by stricter effluent norms and comprehensive environmental enforcement programs. The market demonstrates strong growth momentum with a CAGR of 6.1% through 2035, linked to comprehensive industrial water quality standards and increasing focus on environmental protection initiatives.
Chinese manufacturers and utilities are implementing advanced chemical dosing systems and wastewater treatment platforms to enhance environmental compliance while meeting growing regulatory requirements across industrial sectors. The country's Water Pollution Prevention and Action Plan creates sustained demand for effective dechlorination chemicals, while increasing emphasis on industrial water reuse drives adoption of chemical treatment solutions supporting water reclamation programs.
South Korea's advanced industrial sector demonstrates sophisticated implementation of dechlorination chemical systems, with documented applications supporting electronics manufacturing ultrapure water systems, semiconductor fabrication facilities, and pharmaceutical production requiring exceptionally low chlorine residuals.
The country's manufacturing infrastructure in major industrial centers, including Seoul, Incheon, Busan, and Daejeon, showcases integration of high-purity dechlorination chemicals with existing water treatment systems, leveraging expertise in precision chemical dosing and quality control.
Korean manufacturers emphasize stringent water quality standards and comprehensive monitoring, creating demand for pharmaceutical-grade and electronics-grade dechlorination solutions that support advanced manufacturing operations. The market maintains steady growth through focus on high-specification applications and export-oriented industries, with a CAGR of 5.9% through 2035.
Key development areas:
Brazil's market expansion is driven by diverse industrial demand, including pulp and paper operations in São Paulo and Paraná, beverage manufacturing across multiple regions, and municipal wastewater treatment facility upgrades in metropolitan areas.
The country demonstrates promising growth potential with a CAGR of 5.1% through 2035, supported by industrial expansion programs and environmental compliance initiatives. Brazilian manufacturers face implementation challenges related to infrastructure limitations and technical support availability, requiring comprehensive supplier relationships and training programs.
However, growing pulp and paper production capacity and beverage industry expansion create compelling business cases for dechlorination chemical adoption, particularly in forest product regions where wastewater treatment performance has a direct impact on environmental compliance and operational continuity.
Market characteristics:
The USA market leads in established water treatment infrastructure based on comprehensive municipal dechlorination operations and industrial wastewater management systems supporting regulatory compliance. The country shows solid potential with a CAGR of 4.8% through 2035, driven by aging infrastructure retrofit programs and increasingly stringent discharge permit requirements across major industrial regions, including California, Texas, Pennsylvania, and Ohio.
American municipalities and industrial facilities are upgrading chemical dosing systems for improved performance and regulatory compliance, particularly in states with strict water quality standards and aging treatment facilities requiring modernization to meet current environmental regulations. Technology deployment channels through established chemical distributors and comprehensive technical support services expand coverage across municipal utilities and industrial water treatment operations.
Leading market segments:
In England, Scotland, Wales, and Northern Ireland, water treatment facilities are implementing dechlorination chemical solutions to enhance river water quality and improve discharge compliance, with documented applications supporting urban wastewater treatment upgrades and industrial effluent management programs.
The market shows moderate growth potential with a CAGR of 4.6% through 2035, linked to river health mandates, municipal infrastructure investment programs, and comprehensive environmental protection initiatives.
British water utilities are adopting advanced dosing systems and quality monitoring platforms to enhance treatment performance while maintaining environmental standards demanded by UK Environment Agency regulations and European Union water quality directives. The country's established water services sector creates sustained demand for reliable dechlorination solutions that integrate with existing treatment infrastructure.
Market development factors:
Germany's Dechlorination Chemical Market demonstrates sophisticated implementation focused on high-purity formulations and precision dosing optimization, with documented integration supporting pharmaceutical manufacturing water systems, food processing operations, and industrial wastewater treatment facilities.
The country maintains steady growth momentum with a CAGR of 4.4% through 2035, driven by manufacturers' emphasis on quality standards and stringent purity specifications that align with regulatory requirements for pharmaceutical and food applications.
Major industrial regions, including North Rhine-Westphalia, Bavaria, Baden-Württemberg, and Lower Saxony, showcase advanced deployment of automated dosing platforms where systems integrate seamlessly with existing quality control systems and comprehensive manufacturing management programs.
Key market characteristics:
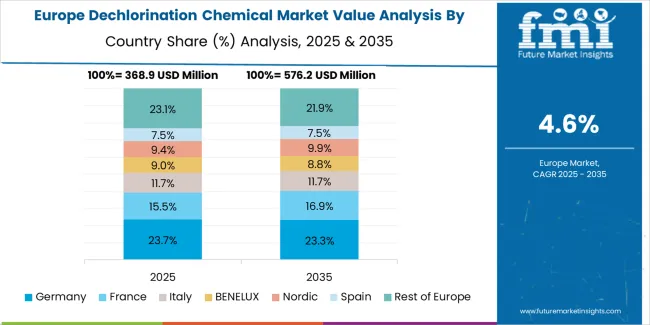
The dechlorination chemical market in Europe is projected to grow from USD 392 million in 2025 to USD 683 million by 2035, registering a CAGR of 5.7% over the forecast period. Germany is expected to maintain its leadership position with approximately 22.0% of European consumption, supported by stringent pharma/food-grade water requirements and comprehensive industrial wastewater facility upgrades across major manufacturing centers.
The United Kingdom follows with approximately 15.0% market share, driven by river quality improvement programs and municipal water treatment retrofits addressing aging infrastructure. France holds approximately 14.0% share, balancing drinking-water treatment operations with industrial effluent management across diverse sectors. Italy commands approximately 12.0% market share through beverage, food processing, and textile applications, while Spain accounts for approximately 10.0%, emphasizing municipal water reuse initiatives and beverage production facilities.
The Nordic region represents approximately 9.0% collectively, led by Sweden and Denmark, where markets favor advanced low-toxicity dosing technologies and automation systems. Benelux countries capture approximately 8.0%, supported by chemicals logistics infrastructure and contract water operators.
The remaining approximately 10.0% is distributed across Central & Eastern Europe, notably Poland, Czechia, and Hungary, where EU-funded wastewater infrastructure projects and industrial park developments are steadily lifting consumption.
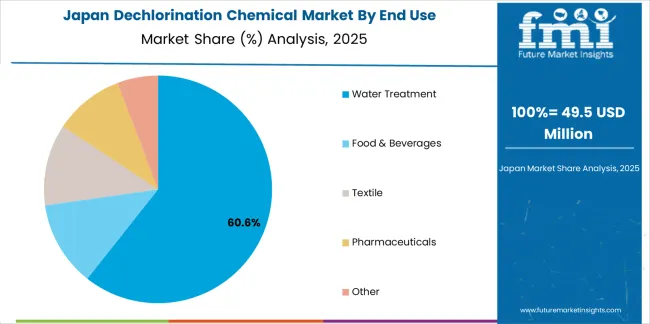
The Japanese Dechlorination Chemical Market demonstrates a mature and quality-focused landscape, characterized by sophisticated integration of pharmaceutical-grade and electronics-grade formulation systems with existing precision water treatment infrastructure across semiconductor fabrication facilities, pharmaceutical manufacturers, and food processing centers.
Japan's emphasis on manufacturing excellence and quality standards drives demand for high-purity dechlorination solutions that support rigorous ultrapure water requirements and comprehensive documentation programs in regulated manufacturing operations.
The market benefits from strong partnerships between international chemical providers like Solvay, BASF, and domestic specialty chemical leaders, including Mitsubishi Chemical, Sumitomo Chemical, and Kurita Water Industries, creating comprehensive service ecosystems that prioritize formulation consistency and technical support programs.
Manufacturing centers in Tokyo, Osaka, Nagoya, and other major industrial areas showcase advanced quality control implementations where chemical systems achieve consistent performance through integrated monitoring programs and automated dosing platforms achieving chlorine residuals below 0.01 ppm for semiconductor applications.
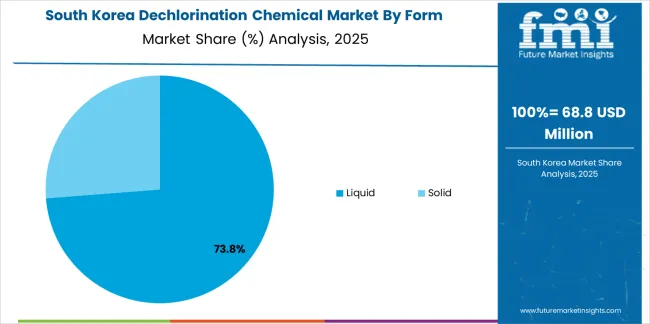
The South Korean Dechlorination Chemical Market is characterized by strong international technology provider presence, with companies like Solvay, BASF, and Kemira maintaining significant positions through comprehensive supply chain integration and technical services capabilities for electronics manufacturing, semiconductor ultrapure water systems, and pharmaceutical production applications.
The market is demonstrating growing emphasis on high-purity formulations and precision dosing capabilities, as Korean manufacturers increasingly demand specialized solutions that integrate with domestic advanced manufacturing infrastructure and sophisticated water quality control systems deployed across Samsung, SK Hynix, LG, and other major semiconductor and electronics complexes.
Local chemical companies and regional specialty suppliers are gaining market share through strategic partnerships with global providers, offering specialized services including Korean market customization and technical support programs for ultrapure water applications requiring chlorine residuals below 0.005 ppm. The competitive landscape shows increasing collaboration between multinational chemical companies and Korean technology specialists, creating hybrid service models that combine international chemical expertise with local technical knowledge.
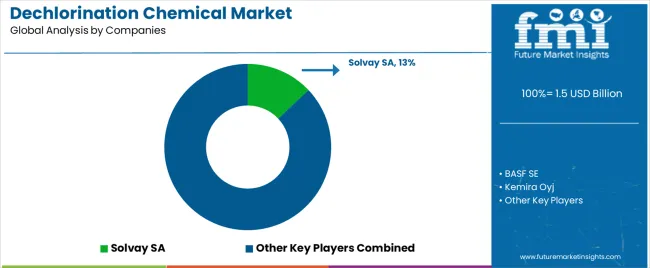
The Dechlorination Chemical Market features approximately 20-25 players with moderate concentration, where the leading company Solvay SA holds approximately 13.0% of global market share, while the top three companies collectively control roughly 32-38% of the market through established production facilities and extensive chemical distribution relationships. Competition centers on product reliability, technical service capabilities, and comprehensive supply chain management rather than price competition alone.
Market leaders include Solvay SA, BASF SE, and Kemira Oyj, which maintain competitive advantages through comprehensive chemical production portfolios, global manufacturing networks, and deep expertise in the water treatment chemicals and specialty formulations sectors, creating high switching costs for customers relying on consistent supply and technical support. These companies leverage economies of scale, research and development capabilities, and ongoing customer relationships to defend market positions while expanding into adjacent applications and geographical markets.
Challengers encompass Chemtrade Logistics and INEOS Calabrian, which compete through regional market presence and diversified chemical portfolios serving multiple end-use sectors. Technology specialists, including Esseco USA LLC, Hawkins Inc., and Hydrite Chemical, focus on specific regional markets or vertical applications, offering differentiated capabilities in specialized formulations, customization services, and localized distribution networks.
Regional players including Jay Dinesh Chemicals in India and Guangdong Hanyan Activated Carbon Technology Co., Ltd. in China create competitive pressure through cost-effective solutions and localized service capabilities, particularly in high-growth markets where domestic presence provides advantages in customer service, regulatory compliance, and supply chain responsiveness. Market dynamics favor companies that combine reliable production capacity with comprehensive distribution networks and technical support offerings that address the complete product lifecycle from manufacturing through application optimization, safety training, and regulatory compliance support. Recent industry consolidation, including Hawkins Inc.'s acquisition of WaterSurplus and Southern Ionics' capacity expansion, demonstrates ongoing investment in market position strengthening and service capability enhancement.
Dechlorination chemicals represent essential water treatment solutions that enable municipalities and industrial facilities to neutralize residual chlorine in treated water before discharge, delivering rapid chlorine reduction to protect aquatic ecosystems and ensure environmental regulatory compliance in municipal and industrial wastewater management operations.
With the market projected to grow from USD 1.5 billion in 2025 to USD 2.5 billion by 2035 at a 5.7% CAGR, these chemical solutions offer compelling advantages - proven effectiveness in chlorine neutralization, cost-effective performance at scale, and seamless integration with existing infrastructure - making them essential for water treatment applications (60.0% market share), food & beverages operations (18.0% share), and textile manufacturing seeking reliable chlorine residual management solutions that support quality standards and regulatory compliance.
Scaling market adoption and technological advancement requires coordinated action across environmental policy, water quality standards development, chemical manufacturers, application industries, and sustainable chemistry investment capital.
| Item | Value |
|---|---|
| Quantitative Units | USD 1.5 billion |
| Chemical Type | Sulfur-based Chemicals, Sodium Bisulfite, Sodium Metabisulfite, Sodium Sulfite, Sulfur Dioxide |
| End Use | Water Treatment, Food & Beverages, Textile, Pharmaceuticals, Other |
| Form | Liquid, Solid |
| Regions Covered | Asia-Pacific, North America, Europe, Latin America, Middle East & Africa |
| Country Covered | India, China, South Korea, Brazil, the U.S., the U.K., Germany, and 40+ countries |
| Key Companies Profiled | Solvay SA, BASF SE, Kemira Oyj, Chemtrade Logistics, INEOS Calabrian, Esseco USA LLC, Hawkins Inc., Hydrite Chemical, Jay Dinesh Chemicals, Guangdong Hanyan Activated Carbon Technology Co., Ltd. |
| Additional Attributes | Dollar sales by chemical type, end use, and form categories, regional adoption trends across Asia-Pacific, North America, and Europe, competitive landscape with chemical manufacturers and distributors, application requirements and specifications, integration with municipal and industrial water treatment systems, innovations in formulation technology and automated dosing systems, and development of specialized grades with purity and performance capabilities. |
The global dechlorination chemical market is estimated to be valued at USD 1.5 billion in 2025.
The market size for the dechlorination chemical market is projected to reach USD 2.5 billion by 2035.
The dechlorination chemical market is expected to grow at a 5.7% CAGR between 2025 and 2035.
The key product types in dechlorination chemical market are water treatment, food & beverages, textile, pharmaceuticals and other.
In terms of form, liquid segment to command 72.0% share in the dechlorination chemical market in 2025.


Our Research Products

The "Full Research Suite" delivers actionable market intel, deep dives on markets or technologies, so clients act faster, cut risk, and unlock growth.

The Leaderboard benchmarks and ranks top vendors, classifying them as Established Leaders, Leading Challengers, or Disruptors & Challengers.

Locates where complements amplify value and substitutes erode it, forecasting net impact by horizon

We deliver granular, decision-grade intel: market sizing, 5-year forecasts, pricing, adoption, usage, revenue, and operational KPIs—plus competitor tracking, regulation, and value chains—across 60 countries broadly.

Spot the shifts before they hit your P&L. We track inflection points, adoption curves, pricing moves, and ecosystem plays to show where demand is heading, why it is changing, and what to do next across high-growth markets and disruptive tech

Real-time reads of user behavior. We track shifting priorities, perceptions of today’s and next-gen services, and provider experience, then pace how fast tech moves from trial to adoption, blending buyer, consumer, and channel inputs with social signals (#WhySwitch, #UX).

Partner with our analyst team to build a custom report designed around your business priorities. From analysing market trends to assessing competitors or crafting bespoke datasets, we tailor insights to your needs.
Supplier Intelligence
Discovery & Profiling
Capacity & Footprint
Performance & Risk
Compliance & Governance
Commercial Readiness
Who Supplies Whom
Scorecards & Shortlists
Playbooks & Docs
Category Intelligence
Definition & Scope
Demand & Use Cases
Cost Drivers
Market Structure
Supply Chain Map
Trade & Policy
Operating Norms
Deliverables
Buyer Intelligence
Account Basics
Spend & Scope
Procurement Model
Vendor Requirements
Terms & Policies
Entry Strategy
Pain Points & Triggers
Outputs
Pricing Analysis
Benchmarks
Trends
Should-Cost
Indexation
Landed Cost
Commercial Terms
Deliverables
Brand Analysis
Positioning & Value Prop
Share & Presence
Customer Evidence
Go-to-Market
Digital & Reputation
Compliance & Trust
KPIs & Gaps
Outputs
Full Research Suite comprises of:
Market outlook & trends analysis
Interviews & case studies
Strategic recommendations
Vendor profiles & capabilities analysis
5-year forecasts
8 regions and 60+ country-level data splits
Market segment data splits
12 months of continuous data updates
DELIVERED AS:
PDF EXCEL ONLINE
Chemical Hydraulic Valves Market Size and Share Forecast Outlook 2025 to 2035
Chemical Vapor Deposition Market Forecast Outlook 2025 to 2035
Chemical Recycling Service Market Forecast Outlook 2025 to 2035
Chemical Dosing Equipment Market Size and Share Forecast Outlook 2025 to 2035
Chemical Filling System Market Size and Share Forecast Outlook 2025 to 2035
Chemical Absorbent Pads Market Size and Share Forecast Outlook 2025 to 2035
Chemical Indicator Inks Market Size and Share Forecast Outlook 2025 to 2035
Chemical Boiler Market Size and Share Forecast Outlook 2025 to 2035
Chemical Hardener Compounds Market Size and Share Forecast Outlook 2025 to 2035
Chemical Anchors Market Size and Share Forecast Outlook 2025 to 2035
Chemical Peel Market Size and Share Forecast Outlook 2025 to 2035
Chemical Protective Gloves Market Size and Share Forecast Outlook 2025 to 2035
Chemical Injection Pump Market Size and Share Forecast Outlook 2025 to 2035
Chemical Liquid Hydrogen Market Size and Share Forecast Outlook 2025 to 2035
Chemical Sensors Market Size and Share Forecast Outlook 2025 to 2035
Chemical Resistant EVA Film Market Size and Share Forecast Outlook 2025 to 2035
Chemical Resistant Fabrics Market Size and Share Forecast Outlook 2025 to 2035
Chemical Resistant Coating Market Size and Share Forecast Outlook 2025 to 2035
Chemical Distribution Market Size and Share Forecast Outlook 2025 to 2035
Chemical & Petrochemical IECS Market Size and Share Forecast Outlook 2025 to 2035

Thank you!
You will receive an email from our Business Development Manager. Please be sure to check your SPAM/JUNK folder too.
Chat With
MaRIA