Reports
- Global Locations -
Headquarters
Future Market Insights, Inc.
Christiana Corporate, 200
Continental Drive, Suite 401,
Newark, Delaware - 19713,
United States
Americas
Future Market Insights, Inc.
616 Corporate Way, Suite 2-9018,
Valley Cottage, NY 10989, United States
MEA
Future Market Insights
1602-6 Jumeirah Bay X2 Tower, Plot No: JLT-PH2-X2A,
Jumeirah Lakes Towers, Dubai,
United Arab Emirates
Europe
Future Market Insights
3rd Floor, 207 Regent Street,
W1B 3HH London
United Kingdom
Asia Pacific
Future Market Insights
Office No. 401-A, 4th Floor,
VANTAGE 9, S.No. 36/1/1,
Baner, Pune 411045, India
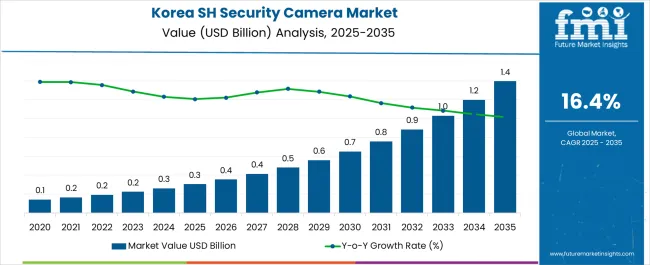
Sales of smart home security camera in Korea are poised to surge at a staggering 17.2% CAGR through 2034. The overall demand for smart home security camera in Korea is set to rise, crossing a valuation of US$ 259.7 million in 2024. By 2034, sales projections for smart home security camera in Korea indicate reaching a valuation of US$ 1,268.7 million.
Attributes | Details |
---|---|
Industry Size in Korea in 2024 | US$ 259.7 million |
Expected Industry Size of Korea by 2034 | US$ 1,268.7 million |
Forecasted CAGR between 2024 to 2034 | 17.2% |
Don't pay for what you don't need
Customize your report by selecting specific countries or regions and save 30%!
The table presents a comparative overview of smart home security camera and their adoption rates in Korea, Japan, and globally. According to the analysis, the escalating security and safety concerns at home and in public places are driving the need for monitoring and security in Korea. Smart home security camera integrated with renowned voice assistants like Bixby, Alexa, or Google Assistant are witnessing increasing demand in Korea, enabling consumers to manage and access their camera using voice requests.
Japan is experiencing a rising trend in adopting face recognition technology for access control in residential settings such as apartment complexes and gated communities. Smart camera with facial recognition capabilities may permit or refuse access based on the faces of authorized inhabitants, improving security and convenience.
On a global scale, businesses are employing multi-layered authentication systems to access camera feeds and settings, including face recognition, biometrics, and user-specific PINs or passwords. Smart home security camera providers are differentiating their products with advanced authentication methods.
Industry Analysis of Smart Home Security Camera in Korea:
Attributes | Industry Analysis of Smart Home Security Camera in Korea |
---|---|
Korea CAGR between 2024 and 2034 | 17.2% |
Industry Size of Korea in 2024 | US$ 259.7 million |
Key Trends in Korea | Rising integration with voice assistants |
Key Challenge | Increasing privacy concerns due to potential misuse of information |
Demand for Smart Home Security Camera in Japan:
Attributes | Demand for Smart Home Security Camera in Japan |
---|---|
CAGR (2024 to 2034) | 15.4% |
Valuation (2024) | US$ 554.5 million |
Key Trend | Increasing usage of facial recognition capabilities |
Key Challenge | Balancing affordability and advanced features is challenging |
Opportunity Assessment in Global Smart Home Security Camera Market:
Attributes | Opportunity Assessment in Global Smart Home Security Camera Market |
---|---|
CAGR (2024 to 2034) | 12.9% |
Valuation (2024) | US$ 8,658.00 million |
Key Trend | Growing integration of multi-layered authentication |
Key Challenge | Rising network congestion due to increasing smart devices |
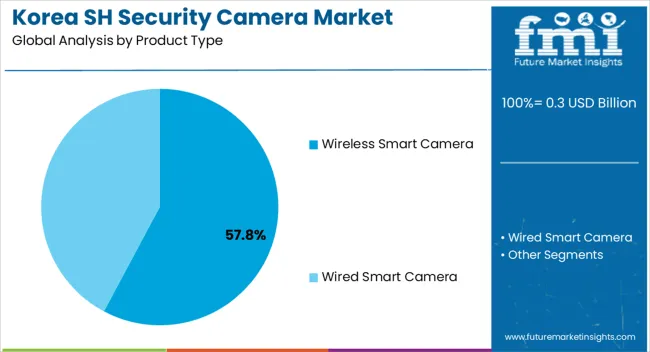
Leading Connectivity for Smart Home Security Camera in Korea | Wired Smart Camera |
---|---|
Total Value Share (2024) | 71.10% |
Wired connections are typically considered more secure than wireless connections because they are less susceptible to hacking or signal interference. The perceived security advantage of wired connections can be a key selling feature in an industry where data security and privacy are crucial. Korea is well-known for its sophisticated internet infrastructure, which includes high-speed broadband and ubiquitous fiber optic access. This deployment of wired smart camera is supported by this robust infrastructure, allowing for high-definition video streaming and continuous surveillance without the risk of signal losses or latency difficulties. The rapid growth of infrastructure is expected to boost demand for connected smart home security camera in the future years.
Leading Sales Channel for Smart Home Security Camera in Korea | Physical Stores |
---|---|
Total Value Share (2024) | 69.10% |
For the younger generation in Korea, the future of brick-and-mortar shops appears secure, at least in the short term. In 2021, more than 65% of Koreans favored offline shopping, citing the ability to personally inspect products, and buying a smart home security camera is no exception. Traditional and independent markets coexist with chain businesses, such as department stores and hypermarkets, in the Korean retail scene. Physical stores are preferred in Korea due to social and cultural reasons. In addition to the value of human relationships, the tactile sensation of physically examining items is important. Koreans place a high emphasis on in-person conversations with vendors, asking for tailored advice, and developing a relationship of trust. The comfort and familiarity of conventional retail locations, together with a need for instant satisfaction, continue to fuel the appeal of physical stores, even while eCommerce is rising.
Get the data you need at a Fraction of the cost
Personalize your report by choosing insights you need
and save 40%!
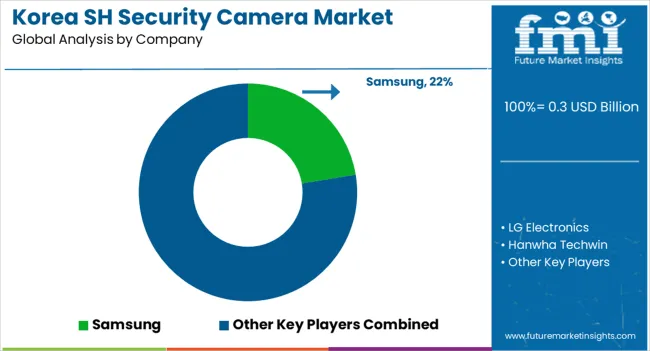
The smart home security camera industry in Korea features an evolving competitive landscape with a mix of domestic and foreign competitors striving for a competitive edge. Growing security concerns and the emergence of smart home ecosystems drive healthy industry growth. Domestic firms like Samsung and LG are fierce competitors, utilizing their established presence and brand image to offer complete security solutions integrated into their larger product ranges. These firms concentrate on developing synergies within their product ecosystems to deliver end-to-end smart home solutions, thereby increasing their competitive position.
International firms, such as Google's Nest and Amazon's Ring, are also making strides in the Korean industry. These firms bring their worldwide expertise and technical advancements to the forefront to seize a portion of the rising demand for smart home security camera. Their focus on cloud-based solutions and AI-powered features has piqued the interest of tech-savvy Korean customers.
Strategies for Key Players to Tap into Potential Growth Opportunities
Recent Development Observed in Smart Home Security Camera in Korea
Attribute | Details |
---|---|
Estimated Industry Size in 2024 | US$ 259.7 million |
Projected Industry Size in 2034 | US$ 1,268.7 million |
Anticipated CAGR between 2024 to 2034 | 17.2% CAGR |
Historical Analysis of Demand for Smart Home Security Camera in Korea | 2019 to 2023 |
Demand Forecast for Smart Home Security Camera in Korea | 2024 to 2034 |
Report Coverage | Industry Size, Industry Trends, Analysis of key factors influencing Smart Home Security Camera Adoption in Korea, Insights on Global Players and their Industry Strategy in Korea, Ecosystem Analysis of Local and Regional Korean Manufacturers |
Key Cities Analyzed While Studying Opportunities in Smart Home Security Camera in Korea |
|
Key Companies Profiled |
|
1. Executive Summary 1.1. Market Outlook 1.2. Demand-side Trends 1.3. Supply-side Trends 1.4. Technology Roadmap Analysis 1.5. Analysis and Recommendations 2. Market Overview 2.1. Market Coverage / Taxonomy 2.2. Market Definition / Scope / Limitations 3. Market Background 3.1. Market Dynamics 3.1.1. Drivers 3.1.2. Restraints 3.1.3. Opportunity 3.1.4. Trends 3.2. Scenario Forecast 3.2.1. Demand in Optimistic Scenario 3.2.2. Demand in Likely Scenario 3.2.3. Demand in Conservative Scenario 3.3. Opportunity Map Analysis 3.4. Product Life Cycle Analysis 3.5. Supply Chain Analysis 3.5.1. Supply Side Participants and their Roles 3.5.1.1. Producers 3.5.1.2. Mid-Level Participants (Traders/ Agents/ Brokers) 3.5.1.3. Wholesalers and Distributors 3.5.2. Value Added and Value Created at Node in the Supply Chain 3.5.3. List of Raw Material Suppliers 3.5.4. List of Existing and Potential Buyer’s 3.6. Investment Feasibility Matrix 3.7. Value Chain Analysis 3.7.1. Profit Margin Analysis 3.7.2. Wholesalers and Distributors 3.7.3. Retailers 3.8. PESTLE and Porter’s Analysis 3.9. Regulatory Landscape 3.9.1. By Key Regions 3.10. Regional Parent Market Outlook 3.11. Production and Consumption Statistics 3.12. Import and Export Statistics 4. Industry Analysis and Outlook 2018 to 2022 and Forecast, 2023 to 2033 4.1. Historical Market Size Value (US$ Million) & Volume (Units) Analysis, 2018 to 2022 4.2. Current and Future Market Size Value (US$ Million) & Volume (Units) Projections, 2023 to 2033 4.2.1. Y-o-Y Growth Trend Analysis 4.2.2. Absolute $ Opportunity Analysis 5. Industry Analysis and Outlook 2018 to 2022 and Forecast 2023 to 2033, By Camera Type 5.1. Introduction / Key Findings 5.2. Historical Market Size Value (US$ Million) & Volume (Units) Analysis By Camera Type, 2018 to 2022 5.3. Current and Future Market Size Value (US$ Million) & Volume (Units) Analysis and Forecast By Camera Type, 2023 to 2033 5.3.1. Smart Video Doorbell Camera 5.3.2. Smart Indoor Camera 5.3.3. Smart Outdoor Camera 5.4. Y-o-Y Growth Trend Analysis By Camera Type, 2018 to 2022 5.5. Absolute $ Opportunity Analysis By Camera Type, 2023 to 2033 6. Industry Analysis and Outlook 2018 to 2022 and Forecast 2023 to 2033, By Connectivity 6.1. Introduction / Key Findings 6.2. Historical Market Size Value (US$ Million) & Volume (Units) Analysis By Connectivity, 2018 to 2022 6.3. Current and Future Market Size Value (US$ Million) & Volume (Units) Analysis and Forecast By Connectivity, 2023 to 2033 6.3.1. Wired Smart Camera 6.3.2. Wireless Smart Camera 6.4. Y-o-Y Growth Trend Analysis By Connectivity, 2018 to 2022 6.5. Absolute $ Opportunity Analysis By Connectivity, 2023 to 2033 7. Industry Analysis and Outlook 2018 to 2022 and Forecast 2023 to 2033, By Sales Channel 7.1. Introduction / Key Findings 7.2. Historical Market Size Value (US$ Million) & Volume (Units) Analysis By Sales Channel, 2018 to 2022 7.3. Current and Future Market Size Value (US$ Million) & Volume (Units) Analysis and Forecast By Sales Channel, 2023 to 2033 7.3.1. ecommerce/Online 7.3.2. Physical Stores/Offline 7.4. Y-o-Y Growth Trend Analysis By Sales Channel, 2018 to 2022 7.5. Absolute $ Opportunity Analysis By Sales Channel, 2023 to 2033 8. Industry Analysis and Outlook 2018 to 2022 and Forecast 2023 to 2033, By Region 8.1. Introduction 8.2. Historical Market Size Value (US$ Million) & Volume (Units) Analysis By Region, 2018 to 2022 8.3. Current Market Size Value (US$ Million) & Volume (Units) Analysis and Forecast By Region, 2023 to 2033 8.3.1. South Gyeongsang 8.3.2. North Jeolla 8.3.3. South Jeolla 8.3.4. Jeju 8.3.5. Rest of Korea 8.4. Market Attractiveness Analysis By Region 9. South Gyeongsang Industry Analysis and Outlook 2018 to 2022 and Forecast 2023 to 2033 9.1. Historical Market Size Value (US$ Million) & Volume (Units) Trend Analysis By Market Taxonomy, 2018 to 2022 9.2. Market Size Value (US$ Million) & Volume (Units) Forecast By Market Taxonomy, 2023 to 2033 9.2.1. By Camera Type 9.2.2. By Connectivity 9.2.3. By Sales Channel 9.3. Market Attractiveness Analysis 9.3.1. By Camera Type 9.3.2. By Connectivity 9.3.3. By Sales Channel 9.4. Key Takeaways 10. North Jeolla Industry Analysis and Outlook 2018 to 2022 and Forecast 2023 to 2033 10.1. Historical Market Size Value (US$ Million) & Volume (Units) Trend Analysis By Market Taxonomy, 2018 to 2022 10.2. Market Size Value (US$ Million) & Volume (Units) Forecast By Market Taxonomy, 2023 to 2033 10.2.1. By Camera Type 10.2.2. By Connectivity 10.2.3. By Sales Channel 10.3. Market Attractiveness Analysis 10.3.1. By Camera Type 10.3.2. By Connectivity 10.3.3. By Sales Channel 10.4. Key Takeaways 11. South Jeolla Industry Analysis and Outlook 2018 to 2022 and Forecast 2023 to 2033 11.1. Historical Market Size Value (US$ Million) & Volume (Units) Trend Analysis By Market Taxonomy, 2018 to 2022 11.2. Market Size Value (US$ Million) & Volume (Units) Forecast By Market Taxonomy, 2023 to 2033 11.2.1. By Camera Type 11.2.2. By Connectivity 11.2.3. By Sales Channel 11.3. Market Attractiveness Analysis 11.3.1. By Camera Type 11.3.2. By Connectivity 11.3.3. By Sales Channel 11.4. Key Takeaways 12. Jeju Industry Analysis and Outlook 2018 to 2022 and Forecast 2023 to 2033 12.1. Historical Market Size Value (US$ Million) & Volume (Units) Trend Analysis By Market Taxonomy, 2018 to 2022 12.2. Market Size Value (US$ Million) & Volume (Units) Forecast By Market Taxonomy, 2023 to 2033 12.2.1. By Camera Type 12.2.2. By Connectivity 12.2.3. By Sales Channel 12.3. Market Attractiveness Analysis 12.3.1. By Camera Type 12.3.2. By Connectivity 12.3.3. By Sales Channel 12.4. Key Takeaways 13. Rest of Industry Analysis and Outlook 2018 to 2022 and Forecast 2023 to 2033 13.1. Historical Market Size Value (US$ Million) & Volume (Units) Trend Analysis By Market Taxonomy, 2018 to 2022 13.2. Market Size Value (US$ Million) & Volume (Units) Forecast By Market Taxonomy, 2023 to 2033 13.2.1. By Camera Type 13.2.2. By Connectivity 13.2.3. By Sales Channel 13.3. Market Attractiveness Analysis 13.3.1. By Camera Type 13.3.2. By Connectivity 13.3.3. By Sales Channel 13.4. Key Takeaways 14. Market Structure Analysis 14.1. Competition Dashboard 14.2. Competition Benchmarking 14.3. Market Share Analysis of Top Players 14.3.1. By Regional 14.3.2. By Camera Type 14.3.3. By Connectivity 14.3.4. By Sales Channel 15. Competition Analysis 15.1. Competition Deep Dive 15.1.1. Vivint Smart Home Inc. 15.1.1.1. Overview 15.1.1.2. Product Portfolio 15.1.1.3. Profitability by Market Segments 15.1.1.4. Sales Footprint 15.1.1.5. Strategy Overview 15.1.1.5.1. Marketing Strategy 15.1.1.5.2. Product Strategy 15.1.1.5.3. Channel Strategy 15.1.2. ADT LLC 15.1.2.1. Overview 15.1.2.2. Product Portfolio 15.1.2.3. Profitability by Market Segments 15.1.2.4. Sales Footprint 15.1.2.5. Strategy Overview 15.1.2.5.1. Marketing Strategy 15.1.2.5.2. Product Strategy 15.1.2.5.3. Channel Strategy 15.1.3. Simplisafe Inc. 15.1.3.1. Overview 15.1.3.2. Product Portfolio 15.1.3.3. Profitability by Market Segments 15.1.3.4. Sales Footprint 15.1.3.5. Strategy Overview 15.1.3.5.1. Marketing Strategy 15.1.3.5.2. Product Strategy 15.1.3.5.3. Channel Strategy 15.1.4. Brinks Home Security 15.1.4.1. Overview 15.1.4.2. Product Portfolio 15.1.4.3. Profitability by Market Segments 15.1.4.4. Sales Footprint 15.1.4.5. Strategy Overview 15.1.4.5.1. Marketing Strategy 15.1.4.5.2. Product Strategy 15.1.4.5.3. Channel Strategy 15.1.5. Skylinkhome 15.1.5.1. Overview 15.1.5.2. Product Portfolio 15.1.5.3. Profitability by Market Segments 15.1.5.4. Sales Footprint 15.1.5.5. Strategy Overview 15.1.5.5.1. Marketing Strategy 15.1.5.5.2. Product Strategy 15.1.5.5.3. Channel Strategy 15.1.6. Samsung Electronics Co. Ltd. 15.1.6.1. Overview 15.1.6.2. Product Portfolio 15.1.6.3. Profitability by Market Segments 15.1.6.4. Sales Footprint 15.1.6.5. Strategy Overview 15.1.6.5.1. Marketing Strategy 15.1.6.5.2. Product Strategy 15.1.6.5.3. Channel Strategy 15.1.7. Frontpoint Security Solutions LLC 15.1.7.1. Overview 15.1.7.2. Product Portfolio 15.1.7.3. Profitability by Market Segments 15.1.7.4. Sales Footprint 15.1.7.5. Strategy Overview 15.1.7.5.1. Marketing Strategy 15.1.7.5.2. Product Strategy 15.1.7.5.3. Channel Strategy 15.1.8. Arlo Technologies Inc. 15.1.8.1. Overview 15.1.8.2. Product Portfolio 15.1.8.3. Profitability by Market Segments 15.1.8.4. Sales Footprint 15.1.8.5. Strategy Overview 15.1.8.5.1. Marketing Strategy 15.1.8.5.2. Product Strategy 15.1.8.5.3. Channel Strategy 15.1.9. Wyze Labs Inc. 15.1.9.1. Overview 15.1.9.2. Product Portfolio 15.1.9.3. Profitability by Market Segments 15.1.9.4. Sales Footprint 15.1.9.5. Strategy Overview 15.1.9.5.1. Marketing Strategy 15.1.9.5.2. Product Strategy 15.1.9.5.3. Channel Strategy 15.1.10. Blink 15.1.10.1. Overview 15.1.10.2. Product Portfolio 15.1.10.3. Profitability by Market Segments 15.1.10.4. Sales Footprint 15.1.10.5. Strategy Overview 15.1.10.5.1. Marketing Strategy 15.1.10.5.2. Product Strategy 15.1.10.5.3. Channel Strategy 15.1.11. Ring LLC 15.1.11.1. Overview 15.1.11.2. Product Portfolio 15.1.11.3. Profitability by Market Segments 15.1.11.4. Sales Footprint 15.1.11.5. Strategy Overview 15.1.11.5.1. Marketing Strategy 15.1.11.5.2. Product Strategy 15.1.11.5.3. Channel Strategy 16. Assumptions & Acronyms Used 17. Research Methodology
Don't pay for what you don't need
Customize your report by selecting specific countries or regions and save 30%!
Table 1: Industry Analysis and Outlook Value (US$ Million) Forecast by Region, 2018 to 2033 Table 2: Industry Analysis and Outlook Volume (Units) Forecast by Region, 2018 to 2033 Table 3: Industry Analysis and Outlook Value (US$ Million) Forecast by Camera Type, 2018 to 2033 Table 4: Industry Analysis and Outlook Volume (Units) Forecast by Camera Type, 2018 to 2033 Table 5: Industry Analysis and Outlook Value (US$ Million) Forecast by Connectivity, 2018 to 2033 Table 6: Industry Analysis and Outlook Volume (Units) Forecast by Connectivity, 2018 to 2033 Table 7: Industry Analysis and Outlook Value (US$ Million) Forecast by Sales Channel, 2018 to 2033 Table 8: Industry Analysis and Outlook Volume (Units) Forecast by Sales Channel, 2018 to 2033 Table 9: South Gyeongsang Industry Analysis and Outlook Value (US$ Million) Forecast by Camera Type, 2018 to 2033 Table 10: South Gyeongsang Industry Analysis and Outlook Volume (Units) Forecast by Camera Type, 2018 to 2033 Table 11: South Gyeongsang Industry Analysis and Outlook Value (US$ Million) Forecast by Connectivity, 2018 to 2033 Table 12: South Gyeongsang Industry Analysis and Outlook Volume (Units) Forecast by Connectivity, 2018 to 2033 Table 13: South Gyeongsang Industry Analysis and Outlook Value (US$ Million) Forecast by Sales Channel, 2018 to 2033 Table 14: South Gyeongsang Industry Analysis and Outlook Volume (Units) Forecast by Sales Channel, 2018 to 2033 Table 15: North Jeolla Industry Analysis and Outlook Value (US$ Million) Forecast by Camera Type, 2018 to 2033 Table 16: North Jeolla Industry Analysis and Outlook Volume (Units) Forecast by Camera Type, 2018 to 2033 Table 17: North Jeolla Industry Analysis and Outlook Value (US$ Million) Forecast by Connectivity, 2018 to 2033 Table 18: North Jeolla Industry Analysis and Outlook Volume (Units) Forecast by Connectivity, 2018 to 2033 Table 19: North Jeolla Industry Analysis and Outlook Value (US$ Million) Forecast by Sales Channel, 2018 to 2033 Table 20: North Jeolla Industry Analysis and Outlook Volume (Units) Forecast by Sales Channel, 2018 to 2033 Table 21: South Jeolla Industry Analysis and Outlook Value (US$ Million) Forecast by Camera Type, 2018 to 2033 Table 22: South Jeolla Industry Analysis and Outlook Volume (Units) Forecast by Camera Type, 2018 to 2033 Table 23: South Jeolla Industry Analysis and Outlook Value (US$ Million) Forecast by Connectivity, 2018 to 2033 Table 24: South Jeolla Industry Analysis and Outlook Volume (Units) Forecast by Connectivity, 2018 to 2033 Table 25: South Jeolla Industry Analysis and Outlook Value (US$ Million) Forecast by Sales Channel, 2018 to 2033 Table 26: South Jeolla Industry Analysis and Outlook Volume (Units) Forecast by Sales Channel, 2018 to 2033 Table 27: Jeju Industry Analysis and Outlook Value (US$ Million) Forecast by Camera Type, 2018 to 2033 Table 28: Jeju Industry Analysis and Outlook Volume (Units) Forecast by Camera Type, 2018 to 2033 Table 29: Jeju Industry Analysis and Outlook Value (US$ Million) Forecast by Connectivity, 2018 to 2033 Table 30: Jeju Industry Analysis and Outlook Volume (Units) Forecast by Connectivity, 2018 to 2033 Table 31: Jeju Industry Analysis and Outlook Value (US$ Million) Forecast by Sales Channel, 2018 to 2033 Table 32: Jeju Industry Analysis and Outlook Volume (Units) Forecast by Sales Channel, 2018 to 2033 Table 33: Rest of Industry Analysis and Outlook Value (US$ Million) Forecast by Camera Type, 2018 to 2033 Table 34: Rest of Industry Analysis and Outlook Volume (Units) Forecast by Camera Type, 2018 to 2033 Table 35: Rest of Industry Analysis and Outlook Value (US$ Million) Forecast by Connectivity, 2018 to 2033 Table 36: Rest of Industry Analysis and Outlook Volume (Units) Forecast by Connectivity, 2018 to 2033 Table 37: Rest of Industry Analysis and Outlook Value (US$ Million) Forecast by Sales Channel, 2018 to 2033 Table 38: Rest of Industry Analysis and Outlook Volume (Units) Forecast by Sales Channel, 2018 to 2033
Figure 1: Industry Analysis and Outlook Value (US$ Million) by Camera Type, 2023 to 2033 Figure 2: Industry Analysis and Outlook Value (US$ Million) by Connectivity, 2023 to 2033 Figure 3: Industry Analysis and Outlook Value (US$ Million) by Sales Channel, 2023 to 2033 Figure 4: Industry Analysis and Outlook Value (US$ Million) by Region, 2023 to 2033 Figure 5: Industry Analysis and Outlook Value (US$ Million) Analysis by Region, 2018 to 2033 Figure 6: Industry Analysis and Outlook Volume (Units) Analysis by Region, 2018 to 2033 Figure 7: Industry Analysis and Outlook Value Share (%) and BPS Analysis by Region, 2023 to 2033 Figure 8: Industry Analysis and Outlook Y-o-Y Growth (%) Projections by Region, 2023 to 2033 Figure 9: Industry Analysis and Outlook Value (US$ Million) Analysis by Camera Type, 2018 to 2033 Figure 10: Industry Analysis and Outlook Volume (Units) Analysis by Camera Type, 2018 to 2033 Figure 11: Industry Analysis and Outlook Value Share (%) and BPS Analysis by Camera Type, 2023 to 2033 Figure 12: Industry Analysis and Outlook Y-o-Y Growth (%) Projections by Camera Type, 2023 to 2033 Figure 13: Industry Analysis and Outlook Value (US$ Million) Analysis by Connectivity, 2018 to 2033 Figure 14: Industry Analysis and Outlook Volume (Units) Analysis by Connectivity, 2018 to 2033 Figure 15: Industry Analysis and Outlook Value Share (%) and BPS Analysis by Connectivity, 2023 to 2033 Figure 16: Industry Analysis and Outlook Y-o-Y Growth (%) Projections by Connectivity, 2023 to 2033 Figure 17: Industry Analysis and Outlook Value (US$ Million) Analysis by Sales Channel, 2018 to 2033 Figure 18: Industry Analysis and Outlook Volume (Units) Analysis by Sales Channel, 2018 to 2033 Figure 19: Industry Analysis and Outlook Value Share (%) and BPS Analysis by Sales Channel, 2023 to 2033 Figure 20: Industry Analysis and Outlook Y-o-Y Growth (%) Projections by Sales Channel, 2023 to 2033 Figure 21: Industry Analysis and Outlook Attractiveness by Camera Type, 2023 to 2033 Figure 22: Industry Analysis and Outlook Attractiveness by Connectivity, 2023 to 2033 Figure 23: Industry Analysis and Outlook Attractiveness by Sales Channel, 2023 to 2033 Figure 24: Industry Analysis and Outlook Attractiveness by Region, 2023 to 2033 Figure 25: South Gyeongsang Industry Analysis and Outlook Value (US$ Million) by Camera Type, 2023 to 2033 Figure 26: South Gyeongsang Industry Analysis and Outlook Value (US$ Million) by Connectivity, 2023 to 2033 Figure 27: South Gyeongsang Industry Analysis and Outlook Value (US$ Million) by Sales Channel, 2023 to 2033 Figure 28: South Gyeongsang Industry Analysis and Outlook Value (US$ Million) Analysis by Camera Type, 2018 to 2033 Figure 29: South Gyeongsang Industry Analysis and Outlook Volume (Units) Analysis by Camera Type, 2018 to 2033 Figure 30: South Gyeongsang Industry Analysis and Outlook Value Share (%) and BPS Analysis by Camera Type, 2023 to 2033 Figure 31: South Gyeongsang Industry Analysis and Outlook Y-o-Y Growth (%) Projections by Camera Type, 2023 to 2033 Figure 32: South Gyeongsang Industry Analysis and Outlook Value (US$ Million) Analysis by Connectivity, 2018 to 2033 Figure 33: South Gyeongsang Industry Analysis and Outlook Volume (Units) Analysis by Connectivity, 2018 to 2033 Figure 34: South Gyeongsang Industry Analysis and Outlook Value Share (%) and BPS Analysis by Connectivity, 2023 to 2033 Figure 35: South Gyeongsang Industry Analysis and Outlook Y-o-Y Growth (%) Projections by Connectivity, 2023 to 2033 Figure 36: South Gyeongsang Industry Analysis and Outlook Value (US$ Million) Analysis by Sales Channel, 2018 to 2033 Figure 37: South Gyeongsang Industry Analysis and Outlook Volume (Units) Analysis by Sales Channel, 2018 to 2033 Figure 38: South Gyeongsang Industry Analysis and Outlook Value Share (%) and BPS Analysis by Sales Channel, 2023 to 2033 Figure 39: South Gyeongsang Industry Analysis and Outlook Y-o-Y Growth (%) Projections by Sales Channel, 2023 to 2033 Figure 40: South Gyeongsang Industry Analysis and Outlook Attractiveness by Camera Type, 2023 to 2033 Figure 41: South Gyeongsang Industry Analysis and Outlook Attractiveness by Connectivity, 2023 to 2033 Figure 42: South Gyeongsang Industry Analysis and Outlook Attractiveness by Sales Channel, 2023 to 2033 Figure 43: North Jeolla Industry Analysis and Outlook Value (US$ Million) by Camera Type, 2023 to 2033 Figure 44: North Jeolla Industry Analysis and Outlook Value (US$ Million) by Connectivity, 2023 to 2033 Figure 45: North Jeolla Industry Analysis and Outlook Value (US$ Million) by Sales Channel, 2023 to 2033 Figure 46: North Jeolla Industry Analysis and Outlook Value (US$ Million) Analysis by Camera Type, 2018 to 2033 Figure 47: North Jeolla Industry Analysis and Outlook Volume (Units) Analysis by Camera Type, 2018 to 2033 Figure 48: North Jeolla Industry Analysis and Outlook Value Share (%) and BPS Analysis by Camera Type, 2023 to 2033 Figure 49: North Jeolla Industry Analysis and Outlook Y-o-Y Growth (%) Projections by Camera Type, 2023 to 2033 Figure 50: North Jeolla Industry Analysis and Outlook Value (US$ Million) Analysis by Connectivity, 2018 to 2033 Figure 51: North Jeolla Industry Analysis and Outlook Volume (Units) Analysis by Connectivity, 2018 to 2033 Figure 52: North Jeolla Industry Analysis and Outlook Value Share (%) and BPS Analysis by Connectivity, 2023 to 2033 Figure 53: North Jeolla Industry Analysis and Outlook Y-o-Y Growth (%) Projections by Connectivity, 2023 to 2033 Figure 54: North Jeolla Industry Analysis and Outlook Value (US$ Million) Analysis by Sales Channel, 2018 to 2033 Figure 55: North Jeolla Industry Analysis and Outlook Volume (Units) Analysis by Sales Channel, 2018 to 2033 Figure 56: North Jeolla Industry Analysis and Outlook Value Share (%) and BPS Analysis by Sales Channel, 2023 to 2033 Figure 57: North Jeolla Industry Analysis and Outlook Y-o-Y Growth (%) Projections by Sales Channel, 2023 to 2033 Figure 58: North Jeolla Industry Analysis and Outlook Attractiveness by Camera Type, 2023 to 2033 Figure 59: North Jeolla Industry Analysis and Outlook Attractiveness by Connectivity, 2023 to 2033 Figure 60: North Jeolla Industry Analysis and Outlook Attractiveness by Sales Channel, 2023 to 2033 Figure 61: South Jeolla Industry Analysis and Outlook Value (US$ Million) by Camera Type, 2023 to 2033 Figure 62: South Jeolla Industry Analysis and Outlook Value (US$ Million) by Connectivity, 2023 to 2033 Figure 63: South Jeolla Industry Analysis and Outlook Value (US$ Million) by Sales Channel, 2023 to 2033 Figure 64: South Jeolla Industry Analysis and Outlook Value (US$ Million) Analysis by Camera Type, 2018 to 2033 Figure 65: South Jeolla Industry Analysis and Outlook Volume (Units) Analysis by Camera Type, 2018 to 2033 Figure 66: South Jeolla Industry Analysis and Outlook Value Share (%) and BPS Analysis by Camera Type, 2023 to 2033 Figure 67: South Jeolla Industry Analysis and Outlook Y-o-Y Growth (%) Projections by Camera Type, 2023 to 2033 Figure 68: South Jeolla Industry Analysis and Outlook Value (US$ Million) Analysis by Connectivity, 2018 to 2033 Figure 69: South Jeolla Industry Analysis and Outlook Volume (Units) Analysis by Connectivity, 2018 to 2033 Figure 70: South Jeolla Industry Analysis and Outlook Value Share (%) and BPS Analysis by Connectivity, 2023 to 2033 Figure 71: South Jeolla Industry Analysis and Outlook Y-o-Y Growth (%) Projections by Connectivity, 2023 to 2033 Figure 72: South Jeolla Industry Analysis and Outlook Value (US$ Million) Analysis by Sales Channel, 2018 to 2033 Figure 73: South Jeolla Industry Analysis and Outlook Volume (Units) Analysis by Sales Channel, 2018 to 2033 Figure 74: South Jeolla Industry Analysis and Outlook Value Share (%) and BPS Analysis by Sales Channel, 2023 to 2033 Figure 75: South Jeolla Industry Analysis and Outlook Y-o-Y Growth (%) Projections by Sales Channel, 2023 to 2033 Figure 76: South Jeolla Industry Analysis and Outlook Attractiveness by Camera Type, 2023 to 2033 Figure 77: South Jeolla Industry Analysis and Outlook Attractiveness by Connectivity, 2023 to 2033 Figure 78: South Jeolla Industry Analysis and Outlook Attractiveness by Sales Channel, 2023 to 2033 Figure 79: Jeju Industry Analysis and Outlook Value (US$ Million) by Camera Type, 2023 to 2033 Figure 80: Jeju Industry Analysis and Outlook Value (US$ Million) by Connectivity, 2023 to 2033 Figure 81: Jeju Industry Analysis and Outlook Value (US$ Million) by Sales Channel, 2023 to 2033 Figure 82: Jeju Industry Analysis and Outlook Value (US$ Million) Analysis by Camera Type, 2018 to 2033 Figure 83: Jeju Industry Analysis and Outlook Volume (Units) Analysis by Camera Type, 2018 to 2033 Figure 84: Jeju Industry Analysis and Outlook Value Share (%) and BPS Analysis by Camera Type, 2023 to 2033 Figure 85: Jeju Industry Analysis and Outlook Y-o-Y Growth (%) Projections by Camera Type, 2023 to 2033 Figure 86: Jeju Industry Analysis and Outlook Value (US$ Million) Analysis by Connectivity, 2018 to 2033 Figure 87: Jeju Industry Analysis and Outlook Volume (Units) Analysis by Connectivity, 2018 to 2033 Figure 88: Jeju Industry Analysis and Outlook Value Share (%) and BPS Analysis by Connectivity, 2023 to 2033 Figure 89: Jeju Industry Analysis and Outlook Y-o-Y Growth (%) Projections by Connectivity, 2023 to 2033 Figure 90: Jeju Industry Analysis and Outlook Value (US$ Million) Analysis by Sales Channel, 2018 to 2033 Figure 91: Jeju Industry Analysis and Outlook Volume (Units) Analysis by Sales Channel, 2018 to 2033 Figure 92: Jeju Industry Analysis and Outlook Value Share (%) and BPS Analysis by Sales Channel, 2023 to 2033 Figure 93: Jeju Industry Analysis and Outlook Y-o-Y Growth (%) Projections by Sales Channel, 2023 to 2033 Figure 94: Jeju Industry Analysis and Outlook Attractiveness by Camera Type, 2023 to 2033 Figure 95: Jeju Industry Analysis and Outlook Attractiveness by Connectivity, 2023 to 2033 Figure 96: Jeju Industry Analysis and Outlook Attractiveness by Sales Channel, 2023 to 2033 Figure 97: Rest of Industry Analysis and Outlook Value (US$ Million) by Camera Type, 2023 to 2033 Figure 98: Rest of Industry Analysis and Outlook Value (US$ Million) by Connectivity, 2023 to 2033 Figure 99: Rest of Industry Analysis and Outlook Value (US$ Million) by Sales Channel, 2023 to 2033 Figure 100: Rest of Industry Analysis and Outlook Value (US$ Million) Analysis by Camera Type, 2018 to 2033 Figure 101: Rest of Industry Analysis and Outlook Volume (Units) Analysis by Camera Type, 2018 to 2033 Figure 102: Rest of Industry Analysis and Outlook Value Share (%) and BPS Analysis by Camera Type, 2023 to 2033 Figure 103: Rest of Industry Analysis and Outlook Y-o-Y Growth (%) Projections by Camera Type, 2023 to 2033 Figure 104: Rest of Industry Analysis and Outlook Value (US$ Million) Analysis by Connectivity, 2018 to 2033 Figure 105: Rest of Industry Analysis and Outlook Volume (Units) Analysis by Connectivity, 2018 to 2033 Figure 106: Rest of Industry Analysis and Outlook Value Share (%) and BPS Analysis by Connectivity, 2023 to 2033 Figure 107: Rest of Industry Analysis and Outlook Y-o-Y Growth (%) Projections by Connectivity, 2023 to 2033 Figure 108: Rest of Industry Analysis and Outlook Value (US$ Million) Analysis by Sales Channel, 2018 to 2033 Figure 109: Rest of Industry Analysis and Outlook Volume (Units) Analysis by Sales Channel, 2018 to 2033 Figure 110: Rest of Industry Analysis and Outlook Value Share (%) and BPS Analysis by Sales Channel, 2023 to 2033 Figure 111: Rest of Industry Analysis and Outlook Y-o-Y Growth (%) Projections by Sales Channel, 2023 to 2033 Figure 112: Rest of Industry Analysis and Outlook Attractiveness by Camera Type, 2023 to 2033 Figure 113: Rest of Industry Analysis and Outlook Attractiveness by Connectivity, 2023 to 2033 Figure 114: Rest of Industry Analysis and Outlook Attractiveness by Sales Channel, 2023 to 2033
Recommendations
Explore Automotive Insights
View Reports