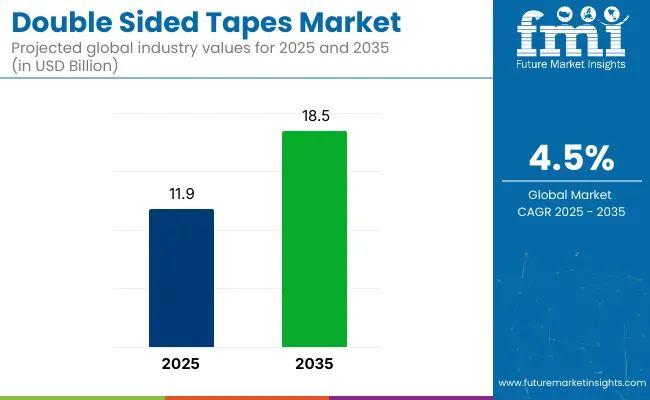
The double-sided tapes market is estimated to account for USD 11.9 billion in 2025 and is projected to reach USD 18.5 billion by 2035, expanding at a CAGR of 4.5% during the forecast period. Sales in 2024 were valued at approximately USD 11.3 billion, highlighting consistent demand from automotive, electronics, construction, and healthcare sectors.

| Attributes | Description |
|---|---|
| Estimated Market Size (2025E) | USD 11.9 billion |
| Projected Market Value (2035F) | USD 18.5 billion |
| Value-based CAGR (2025 to 2035) | 4.5% |
Growth has been driven by the rising use of lightweight bonding solutions that replace mechanical fasteners, screws, and rivets. Double-sided tapes offer enhanced adhesion, aesthetic finish, and improved material compatibility. Their expanding application in device assembly, signage, home furnishings, and mounting operations reflects a growing preference for high-performance adhesives that reduce assembly time and weight, particularly in consumer electronics and automotive interiors where clean bonding and vibration resistance are essential.
In January, 2025 Tesa, international manufacturer of innovative adhesive tapes and self-adhesive product solutions, presents a ground-breaking innovation in its tesafilm range: For the first time, the classic comes to market with a paper-based carrier material. Tesafilm Paper also stands out for its more sustainable material properties.
The carrier material of the adhesive tape comes from certified forests and other controlled sources. The INGEDE-12 test confirms that the product does not impair the recycling of paper and cardboard. "The new tesafilm Paper is a strong innovation with which we are expanding our well-known tesafilm range and continuously optimizing product sustainability. It is in no way inferior to its siblings and convinces with the familiar tesa quality," says Hilde Cambier, Head of New Product and Business Development Consumer at tesa.
Manufacturers in the double-sided tapes market are accelerating the adoption of solvent-free, water-based, and UV-curable adhesive systems, with sustainability serving as a key driver of innovation. Bio-based tapes and recyclable liners are being introduced to align with environmental regulations and customer sustainability goals.
Technological advancements have also improved temperature and UV resistance, tensile strength, and material compatibility. Innovations in pressure-sensitive adhesive (PSA) formulations are enabling tapes to replace traditional joining techniques in lightweight materials, promoting energy efficiency in vehicles and buildings. As low-VOC and halogen-free products gain traction, companies are increasingly balancing performance, safety, and sustainability, responding to stricter compliance standards across regions.
The double-sided tapes market is expected to maintain steady growth through 2035, driven by the need for efficient bonding solutions in miniaturized electronics, EV battery systems, and smart construction. Emerging economies are projected to offer lucrative opportunities, supported by expanding manufacturing bases and infrastructure projects.
Strategic alliances between tape manufacturers and OEMs are anticipated to foster product customization, especially in thermal management, acoustic insulation, and flexible circuit bonding. R&D investments will likely be directed toward nano-adhesives and multifunctional substrates that offer both structural and electrical capabilities. As industries seek faster, cleaner, and more adaptable assembly methods, double-sided tapes are poised to play a pivotal role in next-gen industrial design.
The market is segmented based on adhesive type, technology, backing material, product type, end use, and region. By adhesive type, the market includes acrylic, rubber-based, silicone-based, hot melt, and water-activated adhesives. In terms of technology, the market is categorized into solvent-based, water-based, and hot melt technologies.
Based on backing material, the market comprises foam, film, paper, and other specialty substrates. By product type, the market is segmented into heavy-duty double-sided tape, removable double-sided tape, permanent double-sided tape, transfer tapes, and peel able tapes. In terms of end use, the market serves automotive, paper & print, building & construction, electrical & electronics, and other industrial applications.
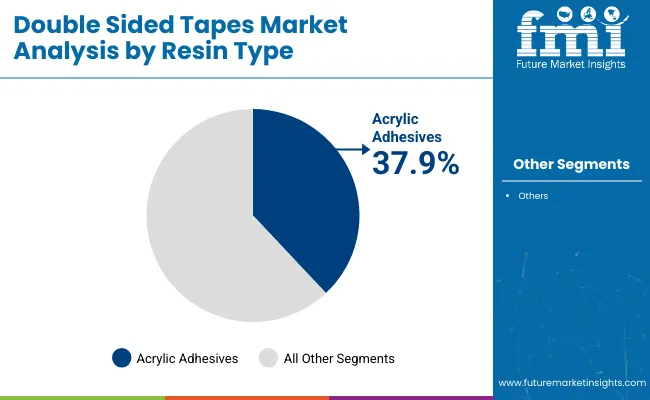
Acrylic adhesives are projected to account for 37.9% of the double-sided tapes market by 2025, emerging as the most widely used adhesive type due to their superior UV resistance, thermal stability, and aging durability. These adhesives are especially favoured in automotive, electronics, construction, and general industrial applications, where long-term bonding strength and resistance to weathering are critical.
Acrylic-based double-sided tapes are compatible with a wide range of substrates-including metal, glass, plastic, and composite materials making them ideal for both structural and decorative bonding. In automotive manufacturing, they are used for nameplates, trim attachment, and interior panelling, offering clean finishes and vibration dampening benefits.
Recent innovations in high-performance acrylic emulsions and low-VOC formulations have also extended their use into medical devices, home appliances, and renewable energy systems. Additionally, acrylic adhesives support die-cutting and laminating processes, enabling custom roll formats and precision applications. As regulations tighten around solvent emissions and material safety, acrylic-based double-sided tapes continue to be a preferred option for long-term, high-performance bonding across sectors.

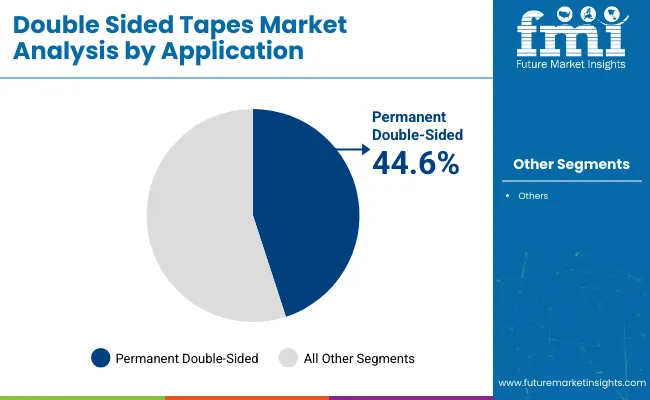
Permanent double-sided tapes are expected to command 44.6% of the global product type share by 2025, owing to their widespread adoption in automotive assembly, HVAC systems, electronics, signage, and furniture manufacturing. These tapes are engineered for strong, long-lasting adhesion, often replacing traditional fastening methods such as screws, rivets, or liquid adhesives.
They are extensively used in metal-to-plastic or plastic-to-plastic bonding, providing seamless finishes, reduced part weight, and simplified assembly. In the building and construction sector, permanent tapes are employed for attaching façade panels, insulation boards, and mirror mounts, where reliability over the product’s lifecycle is essential.
This segment also benefits from foam-based and film-based backings, which allow the tape to conform to uneven surfaces and absorb thermal expansion. Newer grades of permanent double-sided tapes offer resistance to temperature extremes, chemicals, and outdoor exposure, further increasing their usage in harsh and high-load environments.
With rising demand for noise-reducing, non-mechanical fastening solutions, manufacturers are investing in high-tack, pressure-sensitive adhesives and automated tape application systems to meet the precision and speed requirements of industrial users.

Innovations in Electronics and Automotive Industries to Boost Product Demand
The automotive and electronics sectors are the most significant drivers for the double-sided tapes market. In automotive manufacturing, double-sided tapes are used for interior trims, panel bonding, and exterior applications, replacing traditional mechanical fastening methods to reduce weight and improve durability.
Similarly, in electronics, the growing trend of slim and lightweight designs in smartphones, laptops, and other consumer electronics is propelling the use of double-sided tapes for secure bonding of components like screens and touch panels.
Switch Toward Eco-friendly Products
Growing consumer and industrial awareness over issues such as climate change has heightened the demand for adhesive solutions that result in lower use of plastics with lesser environmental footprints. Therefore, manufacturers respond to this call with the development of biodegradable double-sided tapes based on either recycled materials or plant-based materials as an alternative away from the regular plastics-based adhesive applications.
This trend is highly prevalent in the packaging industry, where companies are looking for ways to meet sustainability goals, reduce waste, and meet the expectations of eco-conscious consumers. The sustainability trend in the double-sided tapes market is likely to continue increasing, as more industries and consumers look to the environment-friendly solutions.
Surging Preference for DIY
One of the mega consumer trends in the double-sided tapes market is the popularity of DIY projects and customization. Consumers are increasingly personalizing their homes, gifts, and personal items, which increases demand for easy-to-use, versatile adhesive solutions.
Double-sided tapes are preferred for their convenience, precision, and mess-free application, making them suitable for a wide range of DIY projects, such as scrapbooking, home décor, crafting, and personalization of personal items. This trend has been amplified by the increasing popularity of online platforms, which encourage users to share and discover new crafting ideas. Demand for two-sided tapes from DIY applications will probably be high for self-expression as well as more personal creations.
Steep Cost of the Product May Hamper Sales
One of the major restraining factors in the double-sided tapes market is the high cost of advanced adhesive materials. As manufacturers increasingly focus on producing tapes with specialized properties, such as eco-friendly materials, high-performance bonding, or temperature resistance, the cost of production increases.
These advanced materials, such as biodegradable adhesives or high-strength compounds, often come at a premium, making the end products more expensive for consumers and businesses. This will affect its widespread use, as in other cost-sensitive industries such as packaging and construction where it will not be preferred for a price that is significantly higher than the traditional adhesives or fasteners.
The USA market is slated to witness a 26.7% share in 2025. With the rapid expansion of the consumer goods and packaging industries in the USA, double-sided tapes are increasingly applied in product packaging and labeling.
They are beneficial for bonding, being clean, efficient, and secure in packaging, hence proving advantageous over adhesives or mechanical fasteners. The shift in the packing industry toward attractive, lightweight, and functional packaging is driving the growth of double-sided tapes in this sector, mainly in food packaging, retail goods, and e-commerce.
The market in the UK is anticipated to grow at 4.1% CAGR during the study period. One of the major drivers for the double-sided tapes market is the growing importance of environmental sustainability in the UK The push for eco-friendly materials in packaging and manufacturing has increased, and biodegradable, recyclable, or low-VOC (volatile organic compound) adhesives are in demand for double-sided tapes.
The UK government has focused on reducing plastic waste and promoting sustainable practices, which have led industries to adopt more environmentally responsible alternatives such as double-sided tapes that support these initiatives.
Germany is the hub of a strong automobile and manufacturing industry, which are major consumers of double-sided tapes. Automotive uses include panel bonding, trim attachments, and sealing applications that require lightweight and durable solutions.
Advanced engineering and innovative manufacturing techniques in these industries make double-sided tapes the best fit for highly demanding bonding applications requiring strength and accuracy. As the automotive industry is innovating more and more, especially with the rise of electric vehicles, the demand for double-sided tapes continues to increase.
The rapid industrialization and manufacturing growth in China are major drivers of the double-sided tapes market. China is a global leader in manufacturing, with numerous industries-such as automotive, electronics, and construction-relying on double-sided tapes for efficient, cost-effective bonding solutions.
Double-sided tapes are increasingly used in automotive assembly, electronics manufacturing, and construction applications where strong, durable bonds are needed, and traditional fasteners or adhesives may not be ideal.
With the growth of e-commerce and retail packaging in India, there is an increasing requirement for cost-effective and secure packaging solutions. There is an ever-increasing trend of double-sided tapes for applications such as sealing, labeling, and packaging, with the added ability to offer a clean, efficient bond without excess adhesive. Rapidly growing e-commerce has resulted in increased demand for packaging materials, boosting the demand for double-sided tapes to secure products during shipping and handling.
Japan holds a reputation for high-precision manufacturing and high-tech industries where reliable, strong, and precise adhesive solutions are indispensable. Double-sided tapes provide a clean and secure bonding solution that is mess-free and also not carrying a kind of risk developed by the presence of liquid adhesives, making them the best for high-precision application in the electronics and medical devices industries.
The market is growing as companies in Japan set focus on advanced manufacturing techniques; thus, there is a need for efficient, durable bonding solutions.

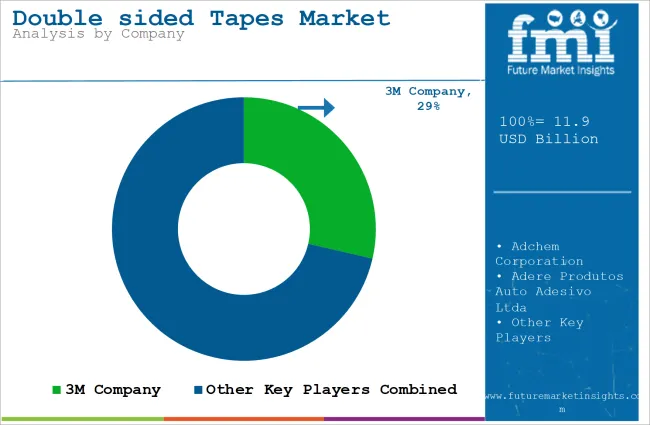
Key players include 3M, Avery Dennison, and Tesa SE, focusing their efforts on producing a diverse set of adhesive solutions offered to the respective industries like the automotive, electronics, packaging, and construction ones. 3M is looking to strengthen its R&D capabilities to come up with high-end adhesives and environmentally friendly solutions.
Avery Dennison is looking to expand its global footprint through specialized double-sided tapes that can be used for niche applications. Tesa SE invests in product innovation, especially in high-bonding tapes and sustainable materials, while increasing its presence in emerging markets.
Other key players are also companies such as Shurtape Technologies and Nitto Denko Corporation, where the emphasis on improving manufacturing capabilities and a strong partnership with distributors is in their focus. Nitto Denko is targeting the automotive and electronics sector with high-performance, temperature-resistant adhesive solutions.
All of these companies are moving forward with growth strategies that revolve around the expansion of their product portfolios, improvement of customer relationships, and introduction of sustainable practices into the manufacturing process for the increasing demand for eco-friendly options.
Several startups appear in the marketplace for double-sided tapes with fresh, innovative solutions and disruptive growth plans. Tape Master is one such innovation-based startup for customized adhesive solutions to the respective industries of the automotive, electronics, and construction categories.
Growth revolves around tailored solutions for different applications: an ultra-thin, high-performing tape from Tape Master applied to consumer electronic devices and various automotive assemblies. The company also emphasizes the production of things locally that are in demand within regional markets, with an enhancement of supply chain efficiency and customer satisfaction.
Another exciting startup is Sticky Innovations. This has put itself on the map by sourcing double-sided tapes that provide a picture of eco-friendliness and sustainability. Sticky Innovations is taking advantage of the growing green manufacturing trend. It focuses on biodegradable and recyclable materials.
To gain an edge over competitors, Sticky Innovations shall leverage the benefit of sophisticated techniques to minimize environmental impacts, target burgeoning industries like solar and eco-friendly packaging. By combining such sustainability goals with niche market-focused strategies, it has started penetrating the otherwise quite competitive market of double-sided tapes.
The market has been analysed on the basis of segments such as resin type, technology, backing material, end use, and region.
The market is divided into rubber, silicone, acrylic, and others.
The market is segregated into solvent, water, and hot melt.
The market is segmented into foam, film, paper, and others.
The market is segmented into automotive, paper & print, building & construction, electrical & electronics, and others.
The market is divided into Latin America, Asia Pacific, North America, the Middle East & Africa, and Europe.
The market is anticipated to reach USD 11.9 billion in 2025.
The market is predicted to reach a size of USD 18.5 billion by 2035.
Some of the key companies manufacturing the product include 3M Company, Ajit Industries Pvt. Ltd., Advance Tapes International Ltd, and others.
The USA is a major hub for product manufacturers.


Our Research Products

The "Full Research Suite" delivers actionable market intel, deep dives on markets or technologies, so clients act faster, cut risk, and unlock growth.

The Leaderboard benchmarks and ranks top vendors, classifying them as Established Leaders, Leading Challengers, or Disruptors & Challengers.

Locates where complements amplify value and substitutes erode it, forecasting net impact by horizon

We deliver granular, decision-grade intel: market sizing, 5-year forecasts, pricing, adoption, usage, revenue, and operational KPIs—plus competitor tracking, regulation, and value chains—across 60 countries broadly.

Spot the shifts before they hit your P&L. We track inflection points, adoption curves, pricing moves, and ecosystem plays to show where demand is heading, why it is changing, and what to do next across high-growth markets and disruptive tech

Real-time reads of user behavior. We track shifting priorities, perceptions of today’s and next-gen services, and provider experience, then pace how fast tech moves from trial to adoption, blending buyer, consumer, and channel inputs with social signals (#WhySwitch, #UX).

Partner with our analyst team to build a custom report designed around your business priorities. From analysing market trends to assessing competitors or crafting bespoke datasets, we tailor insights to your needs.
Supplier Intelligence
Discovery & Profiling
Capacity & Footprint
Performance & Risk
Compliance & Governance
Commercial Readiness
Who Supplies Whom
Scorecards & Shortlists
Playbooks & Docs
Category Intelligence
Definition & Scope
Demand & Use Cases
Cost Drivers
Market Structure
Supply Chain Map
Trade & Policy
Operating Norms
Deliverables
Buyer Intelligence
Account Basics
Spend & Scope
Procurement Model
Vendor Requirements
Terms & Policies
Entry Strategy
Pain Points & Triggers
Outputs
Pricing Analysis
Benchmarks
Trends
Should-Cost
Indexation
Landed Cost
Commercial Terms
Deliverables
Brand Analysis
Positioning & Value Prop
Share & Presence
Customer Evidence
Go-to-Market
Digital & Reputation
Compliance & Trust
KPIs & Gaps
Outputs
Full Research Suite comprises of:
Market outlook & trends analysis
Interviews & case studies
Strategic recommendations
Vendor profiles & capabilities analysis
5-year forecasts
8 regions and 60+ country-level data splits
Market segment data splits
12 months of continuous data updates
DELIVERED AS:
PDF EXCEL ONLINE
Double Linkage Bending Machine Market Size and Share Forecast Outlook 2025 to 2035
Double Head Lathes Market Size and Share Forecast Outlook 2025 to 2035
Double Zipper Bags Market Size and Share Forecast Outlook 2025 to 2035
Double End Truck Wrench Market Size and Share Forecast Outlook 2025 to 2035
Double Hung Windows Market Size and Share Forecast Outlook 2025 to 2035
Double Stack Oven Market Size and Share Forecast Outlook 2025 to 2035
Double Decker Roll Forming Machine Market Size and Share Forecast Outlook 2025 to 2035
Competitive Overview of Double Decker Roll Forming Machine Market Share
Double Seam Bowl Market
Double Coated Film Tapes Market Size and Share Forecast Outlook 2025 to 2035
High Power Double-Clad Fiber Bragg Grating Market Size and Share Forecast Outlook 2025 to 2035
Straight Sided Glass Jar Market Size and Share Forecast Outlook 2025 to 2035
Tapes Market Insights – Growth & Demand 2025 to 2035
UV Tapes Market Growth - Trends & Forecast 2025 to 2035
PVC Tapes Market Size and Share Forecast Outlook 2025 to 2035
Leading Providers & Market Share in PVC Tapes Industry
ESD Tapes and Labels Market from 2025 to 2035
USA Tapes Market Analysis – Growth & Forecast 2024-2034
Seam Tapes Market Insights – Growth & Demand Forecast 2025-2035
Foil Tapes Market

Thank you!
You will receive an email from our Business Development Manager. Please be sure to check your SPAM/JUNK folder too.
Chat With
MaRIA