Dropper System Market Size and Share Forecast Outlook (2023 to 2033)

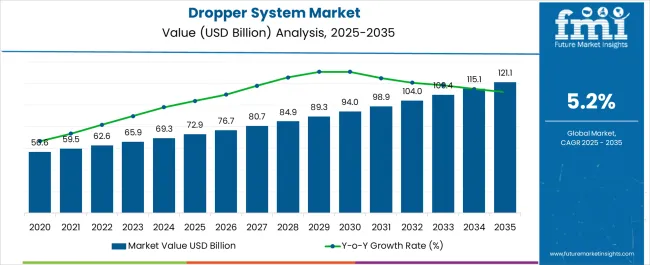
The global dropper system market size is expected to thrive at a CAGR of 5.2% during the projection period. The market value is projected to increase from USD 65.9 million in 2023 to USD 108.1 million by 2033. In 2022, global dropper system sales revenue totaled around USD 62.2 million. For the current year, the target market is set to exhibit Y-o-Y growth of 6.0%.

As per Future Market Insights (FMI), the essential oil, serum, and lotion packaging segment by end use held a share of about 35.3% in 2022 within the global market. This is due to rising usage of dropper systems in essential oil, serum, and lotion packaging applications.

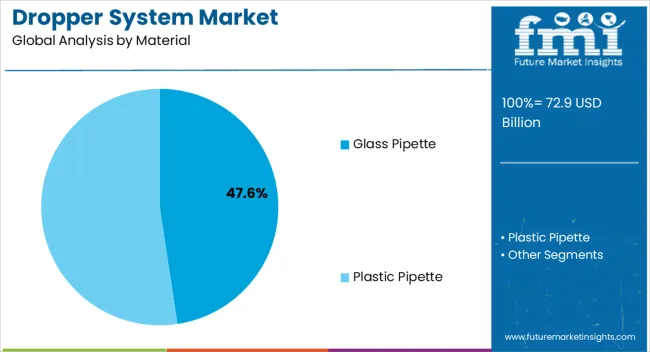
The glass pipette droppers segment with a market share of more than 56.6% has topped the global dropper system industry within the dropper pipette category. It is expected to progress at a CAGR of around 5.4% over the forecast period 2023 to 2033.

The global dropper system industry is set to experience a positive growth outlook, creating an attractive incremental growth opportunity of USD 45.9 million through 2033. Accordingly, it is predicted to expand 1.7x times the current market value during the forecast period.

Key Factors Shaping the Dropper System Market:

  • Growing consumer interest in beauty, skincare, and haircare products will continue to fuel dropper system demand
  • Surging demand for dropper systems in pharma sector to boost the target market
  • Shift towards airless dropper systems along with rising awareness about hygiene will create lucrative growth opportunities for dropper system manufacturers
  • Increasing popularity of cosmetic droppers for precise and controlled product delivery is fuelling market expansion
  • Surging demand for personal care products coupled with rising beauty and wellness trends is bolstering dropper system sales
  • Expansion of e-commerce and last mile-delivery is creating new growth windows for the global dropper system industry

Dropper systems are innovative devices used for dispensing small amounts of liquid in a controlled manner. They allow consumers to dose a precise amount of product and accurately apply the product to specific areas without contaminating the product.

Dropper systems are often used for products such as serums and essential oils, as these types of products require a small, certain amount of product to be dispensed. They have become ideal packaging choice for low-viscosity formulations as they allow for targeted application and dosage.

Dropper systems are used across several sectors due to their benefits. For instance, they have the ability to dispense the product in a precise and controlled manner. Customers value droppers that offer accurate dosage delivery, allowing them to apply the product with ease and avoid wastage.

Dropper systems have become more convenient packaging & dispensing solutions as they offer convenience and precise dispensing. They allow controlled and accurate dosing, ensuring efficient use of liquids.

The ease of use and versatility of dropper systems are increasing their demand across various sectors. For instance, in the healthcare sector, droppers or dropper systems are widely used for precise and controlled dispensing of liquid medications, eye drops, and other healthcare products.

Rising prevalence of chronic diseases and growing need for accurate dosing are expected to boost the global dropper system industry during the projection period. Similarly, rising preference for innovative healthcare packaging and rising demand for pharma droppers will boost the market

Leading dropper system manufacturers are concentrating on using eco-friendly materials. They are also promoting recyclability, or highlighting sustainable production practices to appeal to environmentally conscious customers.

Dropper systems are gaining wider popularity across the cosmetics & personal care sectors. This is because they provide a more precise measurement of the product and reduce waste. Rising production and sales of cosmetic products will therefore continue to boost the global dropper system industry through 2033.

They also offer customized solutions for specific applications. For example, they are developing new serum droppers, mini teat droppers, horizontal droppers, etc. for several applications. This will further boost the target segment during the next ten years.

Attributes Key Insights
Estimated Dropper System Market Size (2023) USD 65.9 million
Projected Dropper System Market Value (2033) USD 108.1 million
Value CAGR (2023 to 2033) 5.2%
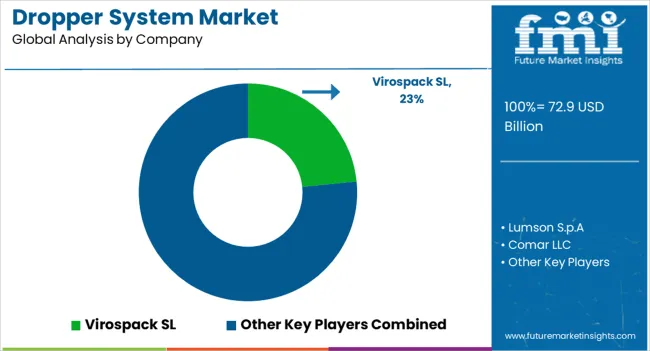
Collective Value Share: Top 5 Companies (2022A) 25% to 30%

Comparison of Historical vs Future Outlook on Changing Consumer Trends for Dropper System Industry

As per Future Market Insights’ (FMI) latest report, global sales of dropper systems grew at 3.5% CAGR during the historic period time frame (2017 to 2022). Total market size reached around USD 62.2 million in 2022.

Looking ahead, the worldwide dropper system market is projected to expand at 5.2% CAGR during the assessment period. It is likely to attain a valuation of USD 108.1 million by the end of 2033.

Droppers, also known as pipettes or dropper bottles, are small devices used for dispensing small amounts of liquid in a controlled manner. They typically consist of a glass or plastic tube with a tapered or narrow opening at one end and a rubber or silicone bulb at the other end.

The bulb is squeezed to create a vacuum, drawing the liquid into the tube, and then released to dispense the liquid drop by drop.

Products such as serums and essential oils require a small and certain quantity of product to be dispensed hence droppers or dropper systems are often used for these types of products.

Dropper systems are used in various sectors and applications. For instance, they find applications in sectors such as pharmaceutical & healthcare, cosmetics & personal care, laboratory and scientific research, food & beverage, and homecare. Expansion of these sectors will elevate demand for dropper systems.

Droppers are also seen as a more hygienic way to dispense cosmetics than traditional methods, such as using one’s fingers. Growing consumer interest in beauty, skincare, and haircare products has been fueling the demand for dropper systems and the trend is expected to continue through 2033.

Widening applications of essential oil in homecare, beauty & wellness, pharma, and food & beverages is further expected to boost the target market.

Key Factors Driving Growth in the Dropper System Industry

Growing Trend of Airless Dropper Systems Boosting the Target Market:

Airless droppers are becoming increasingly popular as a way to dispense cosmetics. Airless droppers create a vacuum when the product is dispensed, which helps to prevent oxidation and contamination. This can extend the shelf life of cosmetics and make them more effective.

Airless dropper systems do not require contact with the product, which helps to prevent the spread of bacteria. This is especially important for products that are used around the eyes or on the face. These droppers are more convenient than other counterparts.

Airless droppers are easy to use and dispense the correct amount of product each time. They are often seen as a more hygienic and convenient way to dispense cosmetics when purchasing them online. Hence, growing popularity of online beauty sales will positively impact sales of dropper systems such as airless droppers.

Increasing Awareness about Hygiene among Consumers Augmenting Dropper System Sales:

Increasing awareness about hygiene is a key driver for the dropper system market. This is due to several advantages offered by droppers or dropper systems.

Droppers are a type of packaging that is used to dispense liquids, such as lotions, serums, and oils. They are considered to be more hygienic than other types of packaging, such as jars. This is because they do not come into direct contact with the product which makes them a popular choice for consumers who are concerned about hygiene.

Droppers are also seen as being more sanitary than other types of packaging. This is because they can be easily cleaned and sterilized. This makes them a good choice for products that are used on the face, such as serums and moisturizers. Hence, increasing awareness about hygiene among consumers will continue to boost the target market.
Analysis of Top Countries, Producing, Formulating, Packaging, Distributing, and Consuming Dropper Systems

Country United States
Market Share (2023) 15.7%
Market Share (2033) 14.7%
BPS Analysis -10
Country Mexico
Market Share (2023) 2.8%
Market Share (2033) 2.9%
BPS Analysis 10
Country Argentina
Market Share (2023) 2.1%
Market Share (2033) 2.4%
BPS Analysis 30
Country China
Market Share (2023) 5.1%
Market Share (2033) 4.8%
BPS Analysis -30
Country Japan
Market Share (2023) 3.8%
Market Share (2033) 3.7%
BPS Analysis -10
Country India
Market Share (2023) 4.3%
Market Share (2033) 4.5%
BPS Analysis 20
Country Australia & New Zealand
Market Share (2023) 1.8%
Market Share (2033) 2.2%
BPS Analysis 40
Country Germany
Market Share (2023) 5.1%
Market Share (2033) 4.3%
BPS Analysis -80

Why is Demand for Dropper Systems Rising across Germany?

Booming Cosmetics & Personal Care Sector Fueling Dropper System Demand in Germany

Germany is one of the leading markets for dropper systems with increasing scientific innovative facilities and research centers focused on product development and regulatory compliance concerning cosmetics and personal care products.

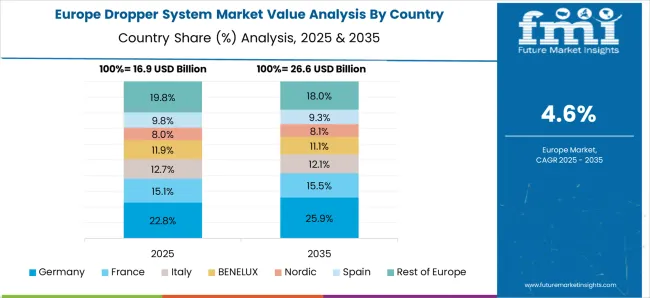
According to the Cosmetics Europe Personal Care Association, Europe is one of the key markets for cosmetic products with Germany accounting for USD 15.5 billion in 2022 after France and Italy. This is creating a high demand for dropper systems and the trend is expected to continue through 2033.

Increasing investments and developing brands in the cosmetics sector are contributing to its growth in Germany. As a result, Germany is becoming a key market for dropper system manufacturers to increase their revenues.

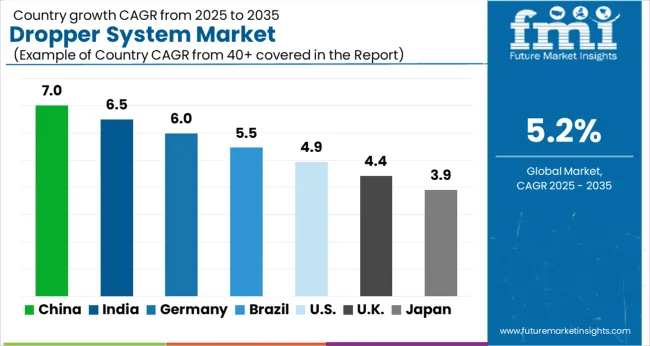
Germany dropper system market is anticipated to offer an incremental opportunity of USD 1.3 million through 2033. Overall dropper system demand in Germany is likely to rise at a CAGR of 3.7% during the assessment period.

What Makes China a Highly Lucrative Market for Dropper System Manufacturers?

Rising Production & Consumption of Beauty Products Making China a Lucrative Market

China is emerging as one of the lucrative markets for dropper system companies, owing to rising production, consumption, and export of beauty and personal care products. China is expected to hold around 47.3% share in East Asia market in 2023.

Sales of dropper systems in China are likely to soar at a steady CAGR of around 4.5% during the forecast period of 2023 to 2033.

As per the International Trade Administration, USA Department of Commerce, the beauty and personal care sector in China recorded sales worth USD 88 billion in the year 2021 with y-o-y growth of 10%.

Color cosmetics and fragrances category was specifically shown impressive growth in china resulting in premium sales increase and product upgradation.

Further, the evolution of e-commerce sector, social media, and digitization in China has been increasingly influencing Chinese consumers to buy more beauty products. This in turn is positively impacting dropper system sales as they have become ideal components of various beauty and personal care products.

Dropper System Industry Analysis by Top Investment Segments

Why is Demand for Dropper Systems Rising in Liquid Medicines Packaging?

Growing Need for Precise & Controlled Dispensing of Medications Fueling Dropper System Demand

According to Future Market Insights (FMI), liquid medicines packaging segment is estimated to hold a market share of more than 23.0% in 2023.It is further expected to rise at a CAGR of 4.8% over the forecast period. This is due to rising need for precise & controlled dispensing of liquid medications.

Droppers are widely used for precise and controlled dispensing of liquid medications, eye drops, and other healthcare products. They have become essential healthcare tools.

The increasing prevalence of chronic diseases, expanding global population, and the need for accurate dosing contribute to the demand for droppers in the pharmaceutical sector for liquid medicines packaging.

Rising usage of dropper systems in liquid medicines packaging is anticipated to play a key role in fostering market development.

Why are Glass Pipettes Highly Preferred?

Various Advantages of Glass Pipettes Making them Highly Popular

Glass droppers offer several benefits over plastic pipettes that make them an ideal choice for fragrances, liquid medicines, essential oils, and supplements. Glass dropper bottles equipped with tight caps ensure to keep the product protected, fresh, and pure throughout the use without any spillage.

Glass dropper pipettes provide leak-proof, safe, and precise dispensing which is essential for important medications and sensitive liquids. Also, they can be sterilized and reused which makes it an eco-friendly option.

As per the latest analysis, glass pipettes will continue to dominate the global dropper system industry with a share of around 56.6% in 2023. It is likely to create an incremental opportunity worth USD 25.5 million during the forecast period.
Leading Suppliers of Dropper Systems

Leading manufacturers of dropper systems are constantly innovating for developing new solutions with improved designs and user-friendly features. They are also implementing strategies such as partnerships, mergers, collaborations, acquisitions, and facility expansions to gain a competitive edge in the market.

Recent developments

  • In April 2023, Lumson Spa announced the launch of a new product, the Eco Dropper which is a new 100% sustainable mono-material dropper.
  • In March 2023, Aptar Group Inc announced the acquisition of iD SCENT which is a specialist of full paper fragrance sampling solutions presenting multiple sustainability features.
  • In October 2022, Bormioli Pharma spa in collaboration with Pierre Fabre announced the development of a PET packaging solution for mouthwashes which is 100% recyclable.
  • In February 2022, Comar LLC announced the acquisition of Automatic Plastics Ltd. which is a contract manufacturing company involved in injection molded products specifically for the medical and pharmaceutical sectors.
  • In 2021, Aptar launched Star Drop, an outstanding dispensing solution for ultra-fluid formulas. The new hybrid packaging dropper features smart valve technology that delivers a highly accurate dose at each time.
  • In 2022, a new PMD dropper series was introduced by Pin Mao.

Top Dropper System Manufacturers by Market Share

Attribute Details
Estimated Market Value (2023) USD 65.9 million
Projected Market Value (2033) USD 108.1 million
Anticipated Growth Rate (2023 to 2033) 5.2% CAGR
Historical Data 2017 to 2022
Forecast Period 2023 to 2033
Quantitative Units Revenue in USD Million, Volume in Units and CAGR from 2023 to 2033
Report Coverage Revenue Forecast, Volume Forecast, Company Ranking, Competitive Landscape, Growth Factors, Trends and Pricing Analysis
Segments Covered Dropper Pipette (Material), Dropper Bulb (Material), Pipette Capacity, Pipette Tip Style, Bulb Style, Bulb Cap Type, End Use, Region
Key Countries Covered North America; Latin America; East Asia; South Asia & Pacific; Western Europe; Eastern Europe; Central Asia; Russia & Belarus; Balkan Countries & Baltic Countries; Middle East & Africa
Key Companies Profiled Virospack SL; Lumson S.p.A; Comar LLC; AptarGroup, Inc; SONE Products Ltd; HCP Packaging Co. Ltd; Albéa Group; Quadpack SA; HEIM Pharma Tropfsysteme GmbH; Paramark Corporation; Cosmetic Specialties International, LLC; Carow Packaging Inc.; RTN Applicator Company LLC; Guangzhou Jiaxing Glass Products Co. Ltd; Hangzhou Lecos packaging Co., Ltd; Guangzhou YELLO Packaging Co., Ltd.; Bestpak Packaging Solutions, Inc.; Radcom Packaging Pvt Ltd; Taiwan K. K. Corp (COSJAR); Bormioli Pharma S.p.A.; DWK Life Sciences Ltd.; THE PLASTICOID COMPANY; Origin Pharma Packaging; SGD Pharma

Top Segments Studied in the Dropper System Market Research Report

By Dropper Pipette (Material):

  • Glass Pipette
    • Type I (Borosilicate Glass)
    • Type III (Regular Soda Lime Glass)
  • Plastic Pipette
    • High-density Polyethylene (HDPE)
    • Low-density Polyethylene (LDPE)
    • Polypropylene (PP)
    • Polyethylene Terephthalate (PET)

By Dropper Bulb (Material):

  • Natural Rubber
  • Thermoplastic Elastomer
    • Monoprene
    • Santoprene
  • Thermoset Polymers
    • Neoprene
    • Nitrile
    • Silicone
  • Others

By Pipette Capacity:

  • Up to 2 ml
  • 3 to 5 ml
  • 6 to 10 ml
  • 11 to 15 ml
  • 16 to 30 ml
  • 31 to 60 ml
  • Above 60 ml

By Pipette Tip Style:

  • Straight
  • Bent
  • Blunt
  • Ball
  • Bent Ball

By Bulb Style:

  • Skirt
  • Ring
  • Straight

By Bulb Cap Type:

  • Regular Cap
  • Tamper Evident Cap
  • Child Resistant Cap
  • Child Resistant / Tamper Evident Cap

By End Use:

  • Liquid Medicines Packaging
  • Essential Oil, Serum & Lotions Packaging
  • Hair Oil Packaging
  • Laboratory Test & Measurement Auxiliaries
  • Edible Flavor Packaging
  • Precision Dosing Equipment
  • Other End Use

By Region:

  • North America
  • Latin America
  • East Asia
  • South Asia & Pacific
  • Western Europe
  • Eastern Europe
  • Central Asia
  • Russia & Belarus
  • Balkan & Baltic Countries
  • Middle East & Africa

Table of Content

  • 1. Executive Summary
  • 2. Market Overview
  • 3. Key Market Trends
  • 4. Key Success Factors
  • 5. Market Demand Analysis 2017 to 2022 and Forecast, 2023 to 2033
  • 6. Market - Pricing Analysis
  • 7. Market Demand (in Value or Size in USD Million) Analysis 2017 to 2022 and Forecast, 2023 to 2033
  • 8. Market Background
  • 9. Market Analysis 2017 to 2022 and Forecast 2023 to 2033, By Dropper Pipette
    • 9.1. Glass Pipette
      • 9.1.1. Type I (Borosilicate Glass)
      • 9.1.2. Type III (Regular Soda Lime Glass)
    • 9.2. Plastic Pipette
      • 9.2.1. High-density Polyethylene (HDPE)
      • 9.2.2. Low-density Polyethylene (LDPE)
      • 9.2.3. Polypropylene (PP)
      • 9.2.4. Polyethylene Terephthalate (PET)
  • 10. Market Analysis 2017 to 2022 and Forecast 2023 to 2033, By Dropper Bulb
    • 10.1. Natural Rubber
    • 10.2. Thermoplastic Elastomer
      • 10.2.1. Monoprene
      • 10.2.2. Santoprene
    • 10.3. Thermoset Polymers
      • 10.3.1. Neoprene
      • 10.3.2. Nitrile
      • 10.3.3. Silicone
    • 10.4. Others
  • 11. Market Analysis 2017 to 2022 and Forecast 2023 to 2033, By Pipette Capacity
    • 11.1. Up to 2 ml
    • 11.2. 3 to 5 ml
    • 11.3. 6 to 10 ml
    • 11.4. 11 to 15 ml
    • 11.5. 16 to 30 ml
    • 11.6. 31 to 60 ml
    • 11.7. Above 60 ml
  • 12. Market Analysis 2017 to 2022 and Forecast 2023 to 2033, By Pipette Tip Style
    • 12.1. Straight
    • 12.2. Bent
    • 12.3. Blunt
    • 12.4. Ball
    • 12.5. Bent Ball
  • 13. Market Analysis 2017 to 2022 and Forecast 2023 to 2033, By Bulb Style
    • 13.1. Skirt
    • 13.2. Ring
    • 13.3. Straight
  • 14. Market Analysis 2017 to 2022 and Forecast 2023 to 2033, By Bulb Cap Type
    • 14.1. Regular Cap
    • 14.2. Tamper Evident Cap
    • 14.3. Child Resistant Cap
    • 14.4. Child Resistant / Tamper Evident Cap
  • 15. Market Analysis 2017 to 2022 and Forecast 2023 to 2033, By End Use
    • 15.1. Liquid Medicines Packaging
    • 15.2. Essential Oil, Serum & Lotions Packaging
    • 15.3. Hair Oil Packaging
    • 15.4. Laboratory Test & Measurement Auxiliaries
    • 15.5. Edible Flavor Packaging
    • 15.6. Precision Dosing Equipment
    • 15.7. Other End Use
  • 16. Market Analysis 2017 to 2022 and Forecast 2023 to 2033, By Region
    • 16.1. North America
    • 16.2. Latin America
    • 16.3. East Asia
    • 16.4. South Asia & Pacific
    • 16.5. Western Europe
    • 16.6. Eastern Europe
    • 16.7. Central Asia
    • 16.8. Russia & Belarus
    • 16.9. Balkan & Baltic Countries
    • 16.10. Middle East and Africa (MEA)
  • 17. North America Market Analysis 2017 to 2022 and Forecast 2023 to 2033
  • 18. Latin America Market Analysis 2017 to 2022 and Forecast 2023 to 2033
  • 19. East Asia Market Analysis 2017 to 2022 and Forecast 2023 to 2033
  • 20. South Asia and Pacific Market Analysis 2017 to 2022 and Forecast 2023 to 2033
  • 21. Western Europe Market Analysis 2017 to 2022 and Forecast 2023 to 2033
  • 22. Eastern Europe Market Analysis 2017 to 2022 and Forecast 2023 to 2033
  • 23. Central Asia Market Analysis 2017 to 2022 and Forecast 2023 to 2033
  • 24. Russia & Belarus Market Analysis 2017 to 2022 and Forecast 2023 to 2033
  • 25. Balkan & Baltic Countries Market Analysis 2017 to 2022 and Forecast 2023 to 2033
  • 26. Middle East & Africa Market Analysis 2017 to 2022 and Forecast 2023 to 2033
  • 27. Country-wise Market Analysis 2023 & 2033
  • 28. Market Structure Analysis
  • 29. Competition Analysis
    • 29.1. Virospack SL.
    • 29.2. Lumson S.p.A
    • 29.3. AptarGroup, Inc.
    • 29.4. SONE Products Ltd.
    • 29.5. HCP Packaging Co., Ltd.
    • 29.6. Albéa Group
    • 29.7. Quadpack SA
    • 29.8. HEIM Pharma Tropfsysteme GmbH
    • 29.9. Taiwan K. K. Corp.
    • 29.10. Paramark Corporation
    • 29.11. Cosmetic Specialties International, LLC
    • 29.12. Carow Packaging Packaging, Inc.
    • 29.13. RTN Applicator Company LLC
    • 29.14. Bestpak Manufacturing Enterprises, Inc.
    • 29.15. Guangzhou Jiaxing Glass Products Co., Ltd.
    • 29.16. Radcom Packaging Pvt Ltd
    • 29.17. Hangzhou Lecos packaging Co., Ltd.
    • 29.18. Guangzhou YELLO Packaging Co., Ltd.
    • 29.19. Bormioli Pharma S.p.A.
    • 29.20. DWK Life Sciences Ltd.
    • 29.21. THE PLASTICOID COMPANY
    • 29.22. Origin Pharma Packaging
    • 29.23. SGD Pharma
  • 30. Assumptions and Acronyms Used
  • 31. Research Methodology

List of Tables

Table 01: Market Value (US$ Million) by Dropper Pipette (Material), 2017H to 2033F

Table 02: Market Volume (Units) by Dropper Pipette (Material), 2017H to 2033F

Table 03: Market Value (US$ Million) by Dropper Bulb (Material), 2017H to 2033F

Table 04: Market Volume (Units) by Dropper Bulb (Material), 2017H to 2033F

Table 05: Market Value (US$ Million) by Pipette Capacity, 2017H to 2033F

Table 06: Market Volume (Units) by Pipette Capacity, 2017H to 2033F

Table 07: Market Value (US$ Million) by Pipette Tip Style, 2017H to 2033F

Table 08: Market Volume (US$ Million) by Pipette Tip Style, 2017H to 2033F

Table 09: Market Value (US$ Million) by Bulb Style, 2017H to 2033F

Table 10: Market Volume (US$ Million) by Bulb Style, 2017H to 2033F

Table 11: Market Value (US$ Million) by Bulb Cap Type, 2017H to 2033F

Table 12: Market Volume (US$ Million) by Bulb Cap Type, 2017H to 2033F

Table 13: Market Value (US$ Million) by End Use, 2017H to 2033F

Table 14: Market Value (US$ Million) by End Use, 2017H to 2033F

Table 15: Market Volume (Units) by End Use, 2017H to 2033F

Table 16: Market Volume (Units) by End Use, 2017H to 2033F

Table 17: Market Value (US$ Million) by Region, 2017H to 2033F

Table 18: Market Volume (Units) by Region, 2017H to 2033F

Table 19: North America Market Value (US$ Million) by Dropper Pipette (Material), 2017H to 2033F

Table 20: North America Market Volume (Units) by Dropper Pipette (Material), 2017H to 2033F

Table 21: North America Market Value (US$ Million) by Dropper Bulb (Material), 2017H to 2033F

Table 22: North America Market Volume (Units) by Dropper Bulb (Material), 2017H to 2033F

Table 23: North America Market Value (US$ Million) by Pipette Capacity, 2017H to 2033F

Table 24: North America Market Volume (Units) by Pipette Capacity, 2017H to 2033F

Table 25: North America Market Value (US$ Million) by Pipette Tip Style, 2017H to 2033F

Table 26: North America Market Volume (Units) by Pipette Tip Style, 2017H to 2033F

Table 27: North America Market Value (US$ Million) by Bulb Style, 2017H to 2033F

Table 28: North America Market Volume (Units) by Bulb Cap Type, 2017H to 2033F

Table 29: North America Market Value (US$ Million) by End Use, 2017H to 2033F

Table 30: North America Market Value (US$ Million) by End Use, 2017H to 2033F

Table 31: North America Market Volume (Units) by End Use, 2017H to 2033F

Table 32: North America Market Volume (Units) by End Use, 2017H to 2033F

Table 33: North America Market Value (US$ Million) by Country, 2017H to 2033F

Table 34: North America Market Volume (Units) by Country, 2017H to 2033F

Table 35: Latin America Market Value (US$ Million) by Dropper Pipette (Material), 2017H to 2033F

Table 36: Latin America Market Volume (Units) by Dropper Pipette (Material), 2017H to 2033F

Table 37: Latin America Market Value (US$ Million) by Dropper Bulb (Material), 2017H to 2033F

Table 38: Latin America Market Volume (Units) by Dropper Bulb (Material), 2017H to 2033F

Table 39: Latin America Market Value (US$ Million) by Pipette Capacity, 2017H to 2033F

Table 40: Latin America Market Volume (Units) by Pipette Capacity, 2017H to 2033F

Table 41: Latin America Market Value (US$ Million) by Pipette Tip Style, 2017H to 2033F

Table 42: Latin America Market Volume (Units) by Pipette Tip Style, 2017H to 2033F

Table 43: Latin America Market Value (US$ Million) by Bulb Style, 2017H to 2033F

Table 44: Latin America Market Volume (Units) by Bulb Cap Type, 2017H to 2033F

Table 45: Latin America Market Value (US$ Million) by End Use, 2017H to 2033F

Table 46: Latin America Market Value (US$ Million) by End Use, 2017H to 2033F

Table 47: Latin America Market Volume (Units) by End Use, 2017H to 2033F

Table 48: Latin America Market Volume (Units) by End Use, 2017H to 2033F

Table 49: Latin America Market Value (US$ Million) by Country, 2017H to 2033F

Table 50: Latin America Market Volume (Units) by Country, 2017H to 2033F

Table 51: East Asia Market Value (US$ Million) by Dropper Pipette (Material), 2017H to 2033F

Table 52: East Asia Market Volume (Units) by Dropper Pipette (Material), 2017H to 2033F

Table 53: East Asia Market Value (US$ Million) by Dropper Bulb (Material), 2017H to 2033F

Table 54: East Asia Market Volume (Units) by Dropper Bulb (Material), 2017H to 2033F

Table 55: East Asia Market Value (US$ Million) by Pipette Capacity, 2017H to 2033F

Table 56: East Asia Market Volume (Units) by Pipette Capacity, 2017H to 2033F

Table 57: East Asia Market Value (US$ Million) by Pipette Tip Style, 2017H to 2033F

Table 58: East Asia Market Volume (Units) by Pipette Tip Style, 2017H to 2033F

Table 59: East Asia Market Value (US$ Million) by Bulb Style, 2017H to 2033F

Table 60: East Asia Market Volume (Units) by Bulb Cap Type, 2017H to 2033F

Table 61: East Asia Market Value (US$ Million) by End Use, 2017H to 2033F

Table 62: East Asia Market Value (US$ Million) by End Use, 2017H to 2033F

Table 63: East Asia Market Volume (Units) by End Use, 2017H to 2033F

Table 64: East Asia Market Volume (Units) by End Use, 2017H to 2033F

Table 65: East Asia Market Value (US$ Million) by Country, 2017H to 2033F

Table 66: East Asia Market Volume (Units) by Country, 2017H to 2033F

Table 67: South Asia & Pacific Market Value (US$ Million) by Dropper Pipette (Material), 2017H-2033

Table 68: South Asia & Pacific Market Volume (Units) by Dropper Pipette (Material), 2017H to 2033F

Table 70: South Asia & Pacific Market Value (US$ Million) by Dropper Bulb (Material), 2017H to 2033F

Table 71: South Asia & Pacific Market Volume (Units) by Dropper Bulb (Material), 2017H to 2033F

Table 72: South Asia & Pacific Market Value (US$ Million) by Pipette Capacity, 2017H to 2033F

Table 73: South Asia & Pacific Market Volume (Units) by Pipette Capacity, 2017H to 2033F

Table 74: South Asia & Pacific Market Value (US$ Million) by Pipette Tip Style, 2017H to 2033F

Table 75: South Asia & Pacific Market Volume (Units) by Pipette Tip Style, 2017H to 2033F

Table 76: South Asia & Pacific Market Value (US$ Million) by Bulb Style, 2017H to 2033F

Table 77: South Asia & Pacific Market Volume (Units) by Bulb Cap Type, 2017H to 2033F

Table 78: South Asia & Pacific Market Value (US$ Million) by End Use, 2017H to 2033F

Table 79: South Asia & Pacific Market Volume (Units) by End Use, 2017H to 2033F

Table 80: South Asia & Pacific Market Value (US$ Million) by Country, 2017H to 2033F

Table 81: South Asia & Pacific Market Volume (Units) by Country, 2017H to 2033F

Table 82: Western Europe Market Value (US$ Million) by Dropper Pipette (Material), 2017H to 2033F

Table 83: Western Europe Market Volume (Units) by Dropper Pipette (Material), 2017H to 2033F

Table 84: Western Europe Market Value (US$ Million) by Dropper Bulb (Material), 2017H to 2033F

Table 85: Western Europe Market Volume (Units) by Dropper Bulb (Material), 2017H to 2033F

Table 86: Western Europe Market Value (US$ Million) by Pipette Capacity, 2017H to 2033F

Table 87: Western Europe Market Volume (Units) by Pipette Capacity, 2017H to 2033F

Table 88: Western Europe Market Value (US$ Million) by Pipette Tip Style, 2017H to 2033F

Table 89: Western Europe Market Volume (Units) by Pipette Tip Style, 2017H to 2033F

Table 90: Western Europe Market Value (US$ Million) by End Use, 2017H to 2033F

Table 91: Western Europe Market Volume (Units) by End Use, 2017H to 2033F

Table 92: Western Europe Market Value (US$ Million) by Bulb Style, 2017H to 2033F

Table 93: Western Europe Market Volume (Units) by Bulb Cap Type, 2017H to 2033F

Table 94: Western Europe Market Value (US$ Million) by Country, 2017H to 2033F

Table 95: Western Europe Market Volume (Units) by Country, 2017H to 2033F

Table 96: Eastern Europe Market Value (US$ Million) by Dropper Pipette (Material), 2017H to 2033F

Table 97: Eastern Europe Market Volume (Units) by Dropper Pipette (Material), 2017H to 2033F

Table 98: Eastern Europe Market Value (US$ Million) by Dropper Bulb (Material), 2017H to 2033F

Table 99: Eastern Europe Market Volume (Units) by Dropper Bulb (Material), 2017H to 2033F

Table 100: Eastern Europe Market Value (US$ Million) by Pipette Capacity, 2017H to 2033F

Table 101: Eastern Europe Market Volume (Units) by Pipette Capacity, 2017H to 2033F

Table 102: Eastern Europe Market Value (US$ Million) by Pipette Tip Style, 2017H to 2033F

Table 103: Eastern Europe Market Volume (Units) by Pipette Tip Style, 2017H to 2033F

Table 104: Eastern Europe Market Value (US$ Million) by Bulb Style, 2017H to 2033F

Table 105: Eastern Europe Market Volume (Units) by Bulb Cap Type, 2017H to 2033F

Table 106: Eastern Europe Market Value (US$ Million) by End Use, 2017H to 2033F

Table 107: Eastern Europe Market Volume (Units) by End Use, 2017H to 2033F

Table 108: Eastern Europe Market Value (US$ Million) by Country, 2017H to 2033F

Table 109: Eastern Europe Market Volume (Units) by Country, 2017H to 2033F

Table 110: Central Asia Market Value (US$ Million) by Dropper Pipette (Material), 2017H to 2033F

Table 111: Central Asia Market Volume (Units) by Dropper Pipette (Material), 2017H to 2033F

Table 112: Central Asia Market Value (US$ Million) by Dropper Bulb (Material), 2017H to 2033F

Table 113: Central Asia Market Volume (Units) by Dropper Bulb (Material), 2017H to 2033F

Table 114: Central Asia Market Value (US$ Million) by Pipette Capacity, 2017H to 2033F

Table 115: Central Asia Market Volume (Units) by Pipette Capacity, 2017H to 2033F

Table 116: Central Asia Market Value (US$ Million) by Pipette Tip Style, 2017H to 2033F

Table 117: Central Asia Market Volume (Units) by Pipette Tip Style, 2017H to 2033F

Table 118: Central Asia Market Value (US$ Million) by Bulb Style, 2017H to 2033F

Table 119: Central Asia Market Volume (Units) by Bulb Cap Type, 2017H to 2033F

Table 120: Central Asia Market Value (US$ Million) by End Use, 2017H to 2033F

Table 121: Central Asia Market Volume (Units) by End Use, 2017H to 2033F

Table 121: Central Asia Market Value (US$ Million) by Country, 2017H to 2033F

Table 122: Central Asia Market Volume (Units) by Country, 2017H to 2033F

Table 123: Russia & Belarus Market Value (US$ Million) by Dropper Pipette (Material), 2017H to 2033F

Table 123: Russia & Belarus Market Volume (Units) by Dropper Pipette (Material), 2017H to 2033F

Table 124: Russia & Belarus Market Value (US$ Million) by Dropper Bulb (Material), 2017H to 2033F

Table 125: Russia & Belarus Market Volume (Units) by Dropper Bulb (Material), 2017H to 2033F

Table 126: Russia & Belarus Market Value (US$ Million) by Pipette Capacity, 2017H to 2033F

Table 127: Russia & Belarus Market Volume (Units) by Pipette Capacity, 2017H to 2033F

Table 128: Russia & Belarus Market Value (US$ Million) by Pipette Tip Style, 2017H to 2033F

Table 129: Russia & Belarus Market Volume (Units) by Pipette Tip Style, 2017H to 2033F

Table 130: Russia & Belarus Market Value (US$ Million) by Bulb Style, 2017H to 2033F

Table 131: Russia & Belarus Market Volume (Units) by Bulb Cap Type, 2017H to 2033F

Table 132: Russia & Belarus Market Value (US$ Million) by End Use, 2017H to 2033F

Table 133: Russia & Belarus Market Volume (Units) by End Use, 2017H to 2033F

Table 134: Russia & Belarus Market Value (US$ Million) by Country, 2017H to 2033F

Table 135: Russia & Belarus Market Volume (Units) by Country, 2017H to 2033F

Table 136: Balkan & Baltic Countries Market Value (US$ Million) by Dropper Pipette (Material), 2017H to 2033F

Table 137: Balkan & Baltic Countries Market Volume (Units) by Dropper Pipette (Material), 2017H to 2033F

Table 138: Balkan & Baltic Countries Market Value (US$ Million) by Dropper Bulb (Material), 2017H to 2033F

Table 139: Balkan & Baltic Countries Market Volume (Units) by Dropper Bulb (Material), 2017H to 2033F

Table 140: Balkan & Baltic Countries Market Value (US$ Million) by Pipette Capacity, 2017H to 2033F

Table 141: Balkan & Baltic Countries Market Volume (Units) by Pipette Capacity, 2017H to 2033F

Table 142: Balkan & Baltic Countries Market Value (US$ Million) by Pipette Tip Style, 2017H to 2033F

Table 143: Balkan & Baltic Countries Market Volume (Units) by Pipette Tip Style, 2017H to 2033F

Table 144: Balkan & Baltic Countries Market Value (US$ Million) by Bulb Style, 2017H to 2033F

Table 145: Balkan & Baltic Countries Market Volume (Units) by Bulb Cap Type, 2017H to 2033F

Table 146: Balkan & Baltic Countries Market Value (US$ Million) by End Use, 2017H to 2033F

Table 147: Balkan & Baltic Countries Market Volume (Units) by End Use, 2017H to 2033F

Table 148: Balkan & Baltic Countries Market Value (US$ Million) by Country, 2017H to 2033F

Table 149: Balkan & Baltic Countries Market Volume (Units) by Country, 2017H to 2033F

Table 150: Middle East & Africa (MEA) Market Value (US$ Million) by Dropper Pipette (Material), 2017H to 2033F

Table 151: Middle East & Africa (MEA) Market Volume (Units) by Dropper Pipette (Material), 2017H to 2033F

Table 152: Middle East & Africa (MEA) Market Value (US$ Million) by Dropper Bulb (Material), 2017H to 2033F

Table 153: Middle East & Africa (MEA) Market Volume (Units) by Dropper Bulb (Material), 2017H to 2033F

Table 154: Middle East & Africa (MEA) Market Value (US$ Million) by Pipette Capacity, 2017H to 2033F

Table 155: Middle East & Africa (MEA) Market Volume (Units) by Pipette Capacity, 2017H to 2033F

Table 156: Middle East & Africa (MEA) Market Value (US$ Million) by Pipette Tip Style, 2017H to 2033F

Table 157: Middle East & Africa (MEA) Market Volume (Units) by Pipette Tip Style, 2017H to 2033F

Table 158: Middle East & Africa (MEA) Market Value (US$ Million) by Bulb Style, 2017H to 2033F

Table 159: Middle East & Africa (MEA) Market Volume (Units) by Bulb Cap Type, 2017H to 2033F

Table 160: Middle East & Africa (MEA) Market Value (US$ Million) by End Use, 2017H to 2033F

Table 161: Middle East & Africa (MEA) Market Volume (Units) by End Use, 2017H to 2033F

Table 162: Middle East & Africa (MEA) Market Value (US$ Million) by Country, 2017H to 2033F

Table 163: Middle East & Africa (MEA) Market Volume (Units) by Country, 2017H to 2033F

List of Figures

Figure 01: Market Share Analysis, by Dropper Pipette (Material), 2023E & 2033F

Figure 02: Market Y-o-Y Analysis, by Dropper Pipette (Material), 2017H to 2033F

Figure 03: Market Attractiveness Analysis, by Dropper Pipette (Material), 2023E to 2033F

Figure 04: Market Share Analysis, by Dropper Bulb (Material), 2023E & 2033F

Figure 05: Market Y-o-Y Analysis, by Dropper Bulb (Material), 2017H to 2033F

Figure 06: Market Attractiveness Analysis, by Dropper Bulb (Material), 2023E to 2033F

Figure 07: Market Share Analysis, by Pipette Capacity, 2023E & 2033F

Figure 08: Market Y-o-Y Analysis, by Pipette Capacity, 2017H to 2033F

Figure 09: Market Attractiveness Analysis, by Pipette Capacity, 2023E to 2033F

Figure 10: Market Share Analysis, by Pipette Tip Style, 2023E & 2033F

Figure 11: Market Y-o-Y Analysis, by Pipette Tip Style, 2017H to 2033F

Figure 12: Market Attractiveness Analysis, by Pipette Tip Style, 2023E to 2033F

Figure 13: Market Share Analysis, by Bulb Style, 2023E & 2033F

Figure 14: Market Y-o-Y Analysis, by Bulb Style, 2017H to 2033F

Figure 15: Market Attractiveness Analysis, by Bulb Style, 2023E to 2033F

Figure 16: Market Share Analysis, by Bulb Cap Type, 2023E & 2033F

Figure 17: Market Y-o-Y Analysis, by Bulb Cap Type, 2017H to 2033F

Figure 18: Market Attractiveness Analysis, by Bulb Cap Type, 2023E to 2033F

Figure 19: Market Share Analysis, by End Use, 2023E & 2033F

Figure 20: Market Y-o-Y Analysis, by End Use, 2017H to 2033F

Figure 21: Market Attractiveness Analysis, by End Use, 2023E to 2033F

Figure 22: Market Share Analysis, by Region, 2023E & 2033F

Figure 23: Market Y-o-Y Analysis, by Region, 2017H to 2033F

Figure 24: Market Attractiveness Analysis, by Region, 2023E to 2033F

Figure 25: North America Market Attractiveness Analysis, by Dropper Pipette (Material), 2023E to 2033F

Figure 26: North America Market Y-o-Y Analysis, by Dropper Bulb (Material), 2017H to 2033F

Figure 27: North America Market Value Share Analysis, by Pipette Capacity 2023(E)

Figure 28: North America Market Value Share Analysis, by Pipette Tip Style 2023(E)

Figure 29: North America Market Value Share Analysis, by Bulb Style 2023(E)

Figure 30: North America Market Value Share Analysis, by Bulb Cap Type 2023(E)

Figure 31: North America Market Value Share Analysis, by End Use 2023(E)

Figure 32: North America Market Share Analysis, by Country, 2023E & 2033F

Figure 33: Latin America Market Y-o-Y Analysis, by Dropper Pipette (Material), 2017H to 2033F

Figure 34: Latin America Market Y-o-Y Analysis, by Dropper Bulb (Material), 2017H to 2033F

Figure 35: Latin America Market Value Share Analysis, by Pipette Capacity 2023(E)

Figure 36: Latin America Market Value Share Analysis, by Pipette Tip Style 2023(E)

Figure 37: Latin America Market Value Share Analysis, by Bulb Style 2023(E)

Figure 38: Latin America Market Value Share Analysis, by Bulb Cap Type 2023(E)

Figure 39: Latin America Market Value Share Analysis, by End Use 2023(E)

Figure 40: Latin America Market Share Analysis, by Country, 2023E & 2033F

Figure 41: East Asia Market Y-o-Y Analysis, by Dropper Pipette (Material), 2017H to 2033F

Figure 42: East Asia Market Y-o-Y Analysis, by Dropper Bulb (Material), 2017H to 2033F

Figure 43: East Asia Market Value Share Analysis, by Pipette Capacity 2023(E)

Figure 44: East Asia Market Value Share Analysis, by Pipette Tip Style 2023(E)

Figure 45: East Asia Market Value Share Analysis, by Bulb Style 2023(E)

Figure 46: East Asia Market Value Share Analysis, by Bulb Cap Type 2023(E)

Figure 47: East Asia Market Value Share Analysis, by End Use 2023(E)

Figure 48: East Asia Market Share Analysis, by Country, 2023E & 2033F

Figure 49: South Asia & Pacific Market Y-o-Y Analysis, by Dropper Pipette (Material), 2017H to 2033F

Figure 50: South Asia & Pacific Market Y-o-Y Analysis, by Dropper Bulb (Material), 2017H to 2033F

Figure 51: South Asia & Pacific Market Value Share Analysis, by Pipette Capacity 2023(E)

Figure 52: South Asia & Pacific Market Value Share Analysis, by Pipette Tip Style 2023(E)

Figure 53: South Asia & Pacific Market Value Share Analysis, by Bulb Style 2023(E)

Figure 54: South Asia & Pacific Market Value Share Analysis, by Bulb Cap Type 2023(E)

Figure 55: South Asia & Pacific Market Value Share Analysis, by End Use 2023(E)

Figure 56: South Asia & Pacific Market Share Analysis, by Country, 2023E & 2033F

Figure 57: Western Europe Market Y-o-Y Analysis, by Dropper Pipette (Material), 2017H to 2033F

Figure 58: Western Europe Market Y-o-Y Analysis, by Dropper Bulb (Material), 2017H to 2033F

Figure 59: Western Europe Market Value Share Analysis, by Pipette Capacity 2023(E)

Figure 60: Western Europe Market Value Share Analysis, by Pipette Tip Style 2023(E)

Figure 61: Western Europe Market Value Share Analysis, by Bulb Style 2023(E)

Figure 62: Western Europe Market Value Share Analysis, by Bulb Cap Type 2023(E)

Figure 63: Western Europe Market Value Share Analysis, by End Use 2023(E)

Figure 64: Western Europe Market Share Analysis, by Country, 2023E & 2033F

Figure 65: Eastern Europe Market Y-o-Y Analysis, by Dropper Pipette (Material), 2017H to 2033F

Figure 66: Eastern Europe Market Y-o-Y Analysis, by Dropper Bulb (Material), 2017H to 2033F

Figure 67: Eastern Europe Market Value Share Analysis, by Pipette Capacity 2023(E)

Figure 68: Eastern Europe Market Value Share Analysis, by Pipette Tip Style 2023(E)

Figure 69: Eastern Europe Market Value Share Analysis, by Bulb Style 2023(E)

Figure 70: Eastern Europe Market Value Share Analysis, by Bulb Cap Type 2023(E)

Figure 71: Eastern Europe Market Value Share Analysis, by End Use 2023(E)

Figure 72: Eastern Europe Market Share Analysis, by Country, 2023E & 2033F

Figure 73: Central Asia Market Y-o-Y Analysis, by Dropper Pipette (Material), 2017H to 2033F

Figure 74: Central Asia Market Y-o-Y Analysis, by Dropper Bulb (Material), 2017H to 2033F

Figure 75: Central Asia Market Value Share Analysis, by Pipette Capacity 2023(E)

Figure 76: Central Asia Market Value Share Analysis, by Pipette Tip Style 2023(E)

Figure 77: Central Asia Market Value Share Analysis, by Bulb Style 2023(E)

Figure 78: Central Asia Market Value Share Analysis, by Bulb Cap Type 2023(E)

Figure 79: Central Asia Market Value Share Analysis, by End Use 2023(E)

Figure 80: Central Asia Market Share Analysis, by Country, 2023E & 2033F

Figure 81: Russia & Belarus Market Y-o-Y Analysis, by Dropper Pipette (Material), 2017H to 2033F

Figure 82: Russia & Belarus Market Y-o-Y Analysis, by Dropper Bulb (Material), 2017H to 2033F

Figure 83: Russia & Belarus Market Value Share Analysis, by Pipette Capacity 2023(E)

Figure 84: Russia & Belarus Market Value Share Analysis, by Pipette Tip Style 2023(E)

Figure 85: Russia & Belarus Market Value Share Analysis, by Bulb Style 2023(E)

Figure 86: Russia & Belarus Market Value Share Analysis, by Bulb Cap Type 2023(E)

Figure 87: Russia & Belarus Market Value Share Analysis, by End Use 2023(E)

Figure 88: Russia & Belarus Market Share Analysis, by Country, 2023E & 2033F

Figure 89: Balkan & Baltic Countries Market Y-o-Y Analysis, by Dropper Pipette (Material), 2017H to 2033

Figure 90: Balkan & Baltic Countries Market Y-o-Y Analysis, by Dropper Bulb (Material), 2017H to 2033F

Figure 91: Balkan & Baltic Countries Market Value Share Analysis, by Pipette Capacity 2023(E)

Figure 92: Balkan & Baltic Countries Market Value Share Analysis, by Pipette Tip Style 2023(E)

Figure 93: Balkan & Baltic Countries Market Value Share Analysis, by Bulb Style 2023(E)

Figure 94: Balkan & Baltic Countries Market Value Share Analysis, by Bulb Cap Type 2023(E)

Figure 95: Balkan & Baltic Countries Market Value Share Analysis, by End Use 2023(E)

Figure 96: Balkan & Baltic Countries Market Share Analysis, by Country, 2023E & 2033F

Figure 97: Middle East & Africa Market Y-o-Y Analysis, by Dropper Pipette (Material), 2017H to 2033F

Figure 98: Middle East & Africa Market Y-o-Y Analysis, by Dropper Bulb (Material), 2017H to 2033F

Frequently Asked Questions

What is the Market Size of the Dropper System in 2023?

The market is valued at USD 65.9 million in 2023.

What is the Growth Forecast for the Dropper System Market?

The market is estimated to develop at a CAGR of 5.2% through 2033.

What was the Expected Value Share of the Top 5 Companies?

The market witnessed a 25% to 30% value share in 2022.

What is China’s Expected Revenue in 2033?

China is expected to generate 4.8% of sales by 2033.

What is the Projected Market Value in Germany?

Germany is expected to predict USD 1.3 million throughout 2023.

Explore Similar Insights

Future Market Insights

Dropper System Market