The Editor App Market is estimated to be valued at USD 5.0 billion in 2025 and is projected to reach USD 12.2 billion by 2035, registering a compound annual growth rate (CAGR) of 9.4% over the forecast period.
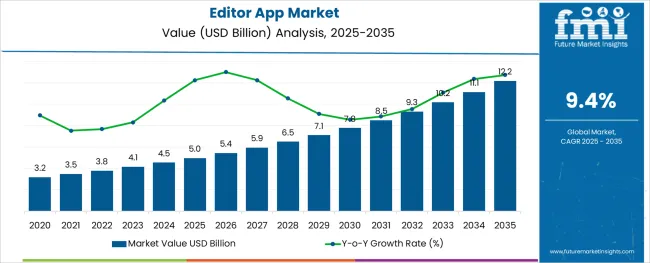
The editor app market is expanding steadily as creative professionals and casual users alike increasingly rely on digital tools for content creation across platforms. The shift toward mobile-first usage, supported by advancements in smartphone hardware and cloud-based editing capabilities, has been a critical enabler of growth.
The growing appetite for visually engaging content on social media and the democratization of creative tools have further fueled demand. Ongoing innovation in artificial intelligence, intuitive user interfaces, and cross-platform compatibility is expected to enhance accessibility and functionality, driving sustained adoption.
Future opportunities are expected to emerge from integration with emerging technologies such as augmented reality, collaborative editing features, and seamless cloud synchronization, which are paving the way for wider reach and more immersive user experiences.
The market is segmented by App Type, Product Type, Media Type, and End User and region. By App Type, the market is divided into Mobile App and Desktop App. In terms of Product Type, the market is classified into Android/iOS, Windows, and Mac. Based on Media Type, the market is segmented into Photo, Audio, Video, and Others. By End User, the market is divided into Professional User and Personal User. Regionally, the market is classified into North America, Latin America, Western Europe, Eastern Europe, Balkan & Baltic Countries, Russia & Belarus, Central Asia, East Asia, South Asia & Pacific, and the Middle East & Africa.
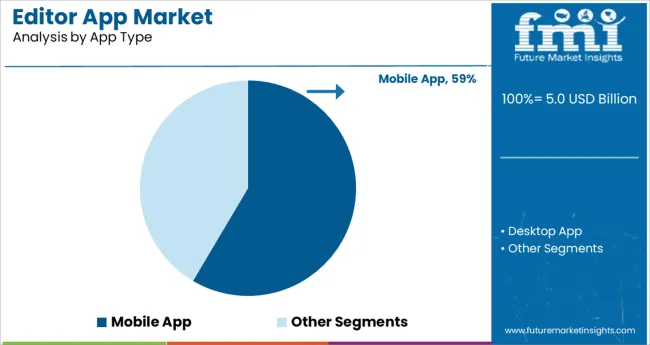
When segmented by app type, the mobile app segment is anticipated to account for 58.5% of total market revenue in 2025, making it the leading app type. This leadership has been reinforced by the ubiquity of smartphones, which has shifted editing workflows away from traditional desktop environments.
Mobile apps have benefited from advancements in processing power, high-resolution displays, and responsive touch interfaces, making complex editing tasks accessible on handheld devices. The convenience of on-the-go editing combined with app store ecosystems that facilitate distribution and updates has strengthened the position of mobile apps.
Enhanced user engagement through frequent updates, freemium models, and seamless integration with cloud storage has further consolidated their dominance.
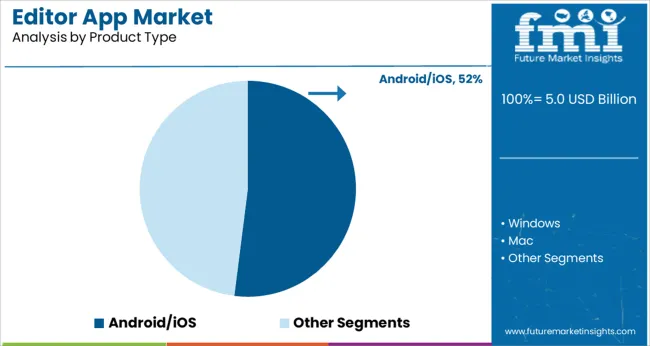
Segmented by product type, the Android iOS segment is expected to capture 52.0% of the market revenue in 2025, establishing itself as the dominant product type. This has been driven by the overwhelming global adoption of Android and iOS devices, which collectively command the majority of the smartphone market.
Applications designed specifically for these operating systems have benefited from robust developer support, dedicated app stores, and optimized performance tailored to device specifications. Continuous updates from both platforms have enabled editors to leverage the latest hardware and software capabilities.
The high levels of user trust, security, and monetization opportunities within the Android and iOS ecosystems have encouraged developers to prioritize these platforms, reinforcing their leading share.
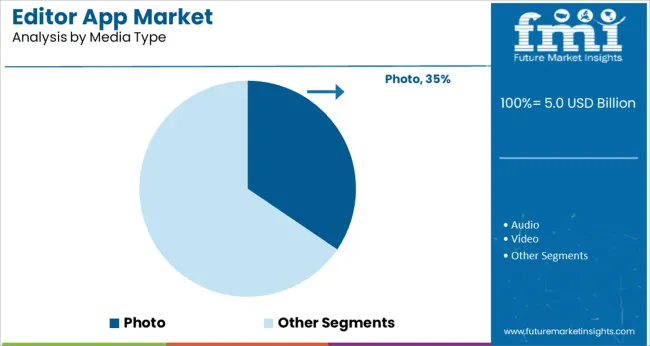
When segmented by media type, the photo segment is projected to hold 34.5% of total market revenue in 2025, positioning it as the leading media type. This prominence has been shaped by the pervasive demand for visually compelling imagery across social media, e-commerce, and personal use.
User behavior trends have increasingly emphasized photo sharing and enhancement, which has spurred innovation in filters, retouching tools, and AI-powered editing features tailored to photography. The relatively lower data and processing requirements of photo editing compared to video have also facilitated broader accessibility.
The immediacy of sharing edited photos and the desire for personalized, high-quality visual content have reinforced the central role of photo editing within the market.
Due to the rise in media uploads to social networking sites, more individuals are using editor apps. The demand for editor apps is also being driven by the expanding influencer culture. Due to the rising penetration of social media, digital marketing, and influencer platforms, consumers are becoming more interested in influencer marketing. The recent emergence of social media influencers on YouTube, Instagram, and other platforms has raised the demand for higher-quality content, which has prompted the development of specialized editor apps.
Small businesses' rising demand for content development is another factor driving the market's expansion. Companies have realized that they need to change to reflect the culture of influencers that are growing. They are now providing online training programs and marketing tactics targeted at micro-influencers. The market for editor apps is anticipated to grow shortly due to their accessibility and low cost. Due to this, market participants are likely to have plenty of profitable business prospects in the years to come.
Companies develop editor apps that aid video editors and directors in making movies, television programs, and other productions more fascinating. Any desired video content may be streamed and downloaded using an over-the-top (OTT) platform. Bypassing conventional cable and satellite TV providers enables consumers to watch content directly via their internet connection. The market for editor apps is growing as a result of the increased demand for content brought on by these platforms' ease of access to entertainment.
According to Future Market Insights, the market for editor apps grew at a CAGR of 8.26% from USD 2,865.4 Million in 2020 to USD 3,823.1 Million in 2025.
As more people are sharing online content thanks to social media platforms like Instagram, YouTube, and Twitter, having effective editor apps is likely to aid companies to obtain millions of potential views or impressions. Though many people are familiar with traditional editing software options like Adobe Premiere, the advent of various automated machine learning editor apps and enhancement software alternatives has allowed users to automatically edit photographs, videos, and music in a matter of minutes.
Due to these editor apps, customers may now easily edit hours of video footage without having to invest an absurd amount of time and money. Due to these factors, the market for editor app is likely to witness significant growth during the forecast period.
| Year | Market Value |
|---|---|
| 2025 | USD 4,140.4 Million |
| 2025 | USD 4,884.7 Million |
| 2035 | USD 6,391.7 Million |
| 2035 | USD 9,288.9 Million |
The market is anticipated to grow at a CAGR of 9.4% from 2025 to 2035, surpassing USD 10,154.2 Million by 2035.
With a 29.1% market share and a significant CAGR of 8.9% during the projection period, the image editor software segment dominated the editor app industry. The proliferation of the photo editing sector is being fuelled by the accessibility of cutting-edge image editor apps for a range of operating systems, including macOS, windows, android, iOS, and iPadOS in desktops, laptops, smartphones, and tablets. Furthermore, professional and amateur photographers have been using and requesting image editor apps at an astounding rate over the past few years. In terms of sensor size, resolution, and functionality, among other things, smartphone and camera technology is developing at a rapid pace rate.
During the forecast period, the individual segment is expected to grow at a CAGR of 7.1% and hold a 53.5% share of the market. By introducing refined features, editor apps help people make their creative works more compelling for visitors. As a result, the category is likely to hold the largest market share.
However, with a CAGR of 8.8% during the projection period, the professional editor sector is anticipated to expand the fastest. During the forecast period, it is likely that the professional editor segment may surpass individual editors' existing market dominance.
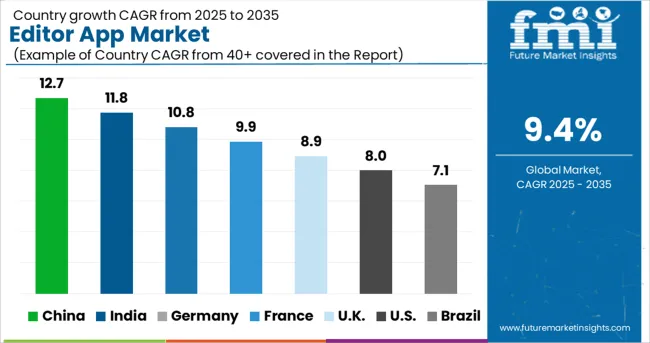
With a market share of 22.1%, the USA is the market leader and is anticipated to expand at a CAGR of 5.9% during the projected period. Due to government initiatives promoting an environment beneficial to innovation and the high purchasing power of the population, the region is anticipated to account for the highest demand for editor apps. This has led to a growth in social networks, which have grown as technology has enabled us to utilize new gadgets like PCs and smartphones that need top-notch editing software to operate properly. A range of smartphone-specific software apps with customized dashboards for quick video editing solutions has also been released by several businesses vying in the USA editor app market.
By 2035, the editor app market in Germany is predicted to hold an 8.7% share, growing at a CAGR of 5.2% during the forecast period. The editor app industry in Germany has huge growth potential because of rising consumer demand and film production. In recent years, creating innovative features and useful functionality has been a major market driver. The demand for editor apps in Europe is anticipated to grow as virtual reality and augmented reality become more and more popular.
With a 7.1% CAGR during the projected period, the Japanese market for editor apps is anticipated to generate a 9.5% revenue share. This growth is supported by factors including the high adoption of digital content, the fast expansion of the consumer electronics market, the expanding use of smartphones and high-speed Internet, the rising acceptance of video-on-demand, and the high levels of video content development on OTT platforms.
Additionally, the market is being driven by the quickly expanding media and entertainment sector, rising disposable income, rapid use of cloud-based video editing software, and the quickening expansion of social media streaming.
With a CAGR of 6.7% over the anticipated period, India's editor app market is anticipated to attain a 10.4% share. Another significant element influencing market expansion in India is the use of video editor apps for educational reasons. For information transmission and content training, several Edtech platforms, including BYJU'S, Vedantu, Upgrade, and Unacademy, among others, employ video editing tools.
Yoplex launched a fresh OTT platform with new releases on December 16, 2024. This platform has an intuitive app that runs on a subscription basis with affordable costs and will provide its audience with unique, excellent content that will amuse audiences everywhere. These elements are fueling this region's income growth.
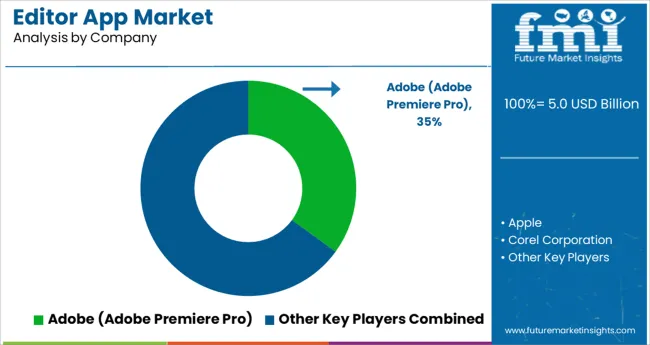
Leading businesses in the editor app industry utilize a variety of growth strategies to increase their market share, including alliances, contracts, agreements, regional expansions, mergers and acquisitions, the introduction of new products, and investments from larger businesses. Independent editing packages are a way for small businesses to differentiate themselves.
Competitors are attempting to differentiate their products to provide distinctive value propositions to establish a presence in the market. A few start-up ventures are also making a significant influence, and it is anticipated that they will eventually build a strong market presence.
Apple
Apple, a leading player in the editor app industry, introduced a new version of iMovie on April 12, 2025, with features that make it easier to create high-quality edited films for iPhone and iPad, as well as pre-made templates for popular video formats shared on social media. Videos of science experiments, DIY projects, food demonstrations, product reviews, and other types can be modified. Storyboards help budding writers, filmmakers, and media producers edit and improve their video storytelling abilities.
Adobe
Adobe announced substantial updates to Photoshop, Lightroom, and Lightroom Classic in June 2025, providing customers with additional features, benefits, and value. Adobe Sensei AI and machine learning will be used to optimize cross-device collaborative workflows for Photoshop and Lightroom (desktop, internet, and mobile) users. It will also provide editing and usability improvements to Photoshop on the web (beta).
In April 2025, Adobe announced upgrades to After Effects and Premiere Pro, including native M1 compatibility for After Effects, as well as the inclusion of Frame.io's market-leading video collaboration platform to its millions of Creative Cloud users.
Recent Developments in the Editor App Industry:
| Attribute | Details |
|---|---|
| Forecast period | 2025 to 2035 |
| Historical data available for the year | 2020 to 2025 |
| Market analysis | million in value |
| Key countries covered | USA, Canada, Germany, UK, France, Italy, Spain, Russia, China, Japan, South Korea, India, Thailand, Malaysia, Indonesia, Australia, New Zealand, GCC Countries, Turkey, Northern Africa, and South Africa |
| Key segments covered | By Type, By End-user, By Region |
| Key companies profiled | Corel Corporation; FXHome; Adobe; Apple; Autodesk, Inc.; Avid; Avid Technology, Inc.; Black Magic Design; HairerSoft, iZotope, Inc.; Microsoft Corp; Movavi; NCH Software; Pinnacle; PreSonus Audio Electronics, Inc; Sony Corporation; Wondershare Technology |
| Report Coverage | Market Forecast, Company Share Analysis, Competition Intelligence, Drivers, Restraints, Opportunities and Threats Analysis, Market Dynamics and Challenges, and Strategic Growth Initiatives |
| Customization & Pricing | Available upon Request |
The global editor app market is estimated to be valued at USD 5.0 billion in 2025.
It is projected to reach USD 12.2 billion by 2035.
The market is expected to grow at a 9.4% CAGR between 2025 and 2035.
The key product types are mobile app and desktop app.
android/ios segment is expected to dominate with a 52.0% industry share in 2025.


Our Research Products

The "Full Research Suite" delivers actionable market intel, deep dives on markets or technologies, so clients act faster, cut risk, and unlock growth.

The Leaderboard benchmarks and ranks top vendors, classifying them as Established Leaders, Leading Challengers, or Disruptors & Challengers.

Locates where complements amplify value and substitutes erode it, forecasting net impact by horizon

We deliver granular, decision-grade intel: market sizing, 5-year forecasts, pricing, adoption, usage, revenue, and operational KPIs—plus competitor tracking, regulation, and value chains—across 60 countries broadly.

Spot the shifts before they hit your P&L. We track inflection points, adoption curves, pricing moves, and ecosystem plays to show where demand is heading, why it is changing, and what to do next across high-growth markets and disruptive tech

Real-time reads of user behavior. We track shifting priorities, perceptions of today’s and next-gen services, and provider experience, then pace how fast tech moves from trial to adoption, blending buyer, consumer, and channel inputs with social signals (#WhySwitch, #UX).

Partner with our analyst team to build a custom report designed around your business priorities. From analysing market trends to assessing competitors or crafting bespoke datasets, we tailor insights to your needs.
Supplier Intelligence
Discovery & Profiling
Capacity & Footprint
Performance & Risk
Compliance & Governance
Commercial Readiness
Who Supplies Whom
Scorecards & Shortlists
Playbooks & Docs
Category Intelligence
Definition & Scope
Demand & Use Cases
Cost Drivers
Market Structure
Supply Chain Map
Trade & Policy
Operating Norms
Deliverables
Buyer Intelligence
Account Basics
Spend & Scope
Procurement Model
Vendor Requirements
Terms & Policies
Entry Strategy
Pain Points & Triggers
Outputs
Pricing Analysis
Benchmarks
Trends
Should-Cost
Indexation
Landed Cost
Commercial Terms
Deliverables
Brand Analysis
Positioning & Value Prop
Share & Presence
Customer Evidence
Go-to-Market
Digital & Reputation
Compliance & Trust
KPIs & Gaps
Outputs
Full Research Suite comprises of:
Market outlook & trends analysis
Interviews & case studies
Strategic recommendations
Vendor profiles & capabilities analysis
5-year forecasts
8 regions and 60+ country-level data splits
Market segment data splits
12 months of continuous data updates
DELIVERED AS:
PDF EXCEL ONLINE
Photo Editing Apps – AI-Enhanced Creativity for Users
Online Paint Editor App Market Size and Share Forecast Outlook 2025 to 2035
Application Crowdtesting Service Market Size and Share Forecast Outlook 2025 to 2035
Application Integration Market Size and Share Forecast Outlook 2025 to 2035
Application Programming Interface (API) Security Market Size and Share Forecast Outlook 2025 to 2035
App Store Optimization Software Market Size and Share Forecast Outlook 2025 to 2035
Application Development and Modernization (ADM) Market Size and Share Forecast Outlook 2025 to 2035
Application Release Automation Market Size and Share Forecast Outlook 2025 to 2035
Application Delivery Controllers Market Size and Share Forecast Outlook 2025 to 2035
Application Virtualization Market Size and Share Forecast Outlook 2025 to 2035
Apparel Market Size and Share Forecast Outlook 2025 to 2035
Apple Seed Oil Market Size and Share Forecast Outlook 2025 to 2035
Appendage Management Market Size and Share Forecast Outlook 2025 to 2035
Applicator Tips Market Size and Share Forecast Outlook 2025 to 2035
Application Specific Integrated Circuit Market Size and Share Forecast Outlook 2025 to 2035
Apple Accessories Market Report – Demand, Trends & Forecast 2025–2035
Applicant Tracking System Market Size and Share Forecast Outlook 2025 to 2035
Apparel Re-commerce Market Size and Share Forecast Outlook 2025 to 2035
Application Processor Market Size and Share Forecast Outlook 2025 to 2035
Apple Cider Vinegar Market Analysis - Size, Share, and Forecast Outlook 2025 to 2035

Thank you!
You will receive an email from our Business Development Manager. Please be sure to check your SPAM/JUNK folder too.
Chat With
MaRIA