

- Market Size (2026)
- USD 900.0 Mn
- Forecast (2036)
- USD 1600.0 Mn
- CAGR (2026 to 2036)
- 5.8%
Electrical Starter-Generator Systems for Turbofan Engines Market Size, Market Forecast and Outlook By FMI
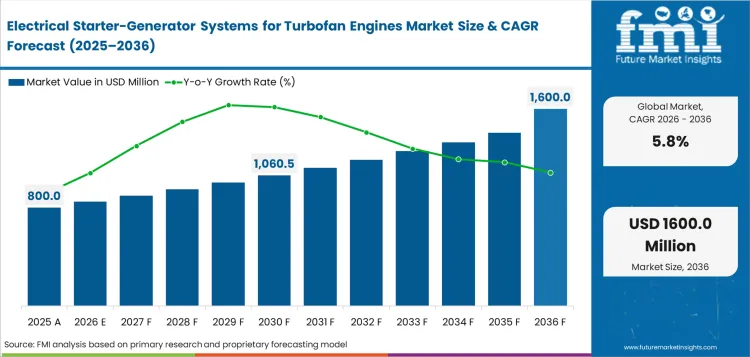
Electrical starter-generator systems for turbofan engines market was valued at USD 800.0 million in 2025 and is expected to reach USD 900.0 million in 2026. Demand is forecast to reach USD 1,600.0 million by 2036 at 5.8% CAGR from 2026 to 2036. OEM installation is expected to hold 62.0% of sales channel demand in 2026. Commercial aircraft are forecast to account for 58.0% of aircraft use demand in 2026.
Summary of the Electrical Starter-Generator Systems for Turbofan Engines Market
- Demand and Growth Drivers
- Electrical starter-generator systems help start turbofan engines and supply aircraft power after engine start.
- Demand is supported by aircraft designs that use more electrical systems during flight.
- Engine makers need compact units that can work safely under heat and vibration.
- Frequent aircraft use raises the need for starter-generators with longer service life.
- Product and Segment View
- AC starter-generators are widely used because aircraft need stable power after engine start.
- Narrow-body turbofans create steady demand as these aircraft fly many short routes.
- OEM installation stays important because starter-generators must match the engine design before certification.
- Geography and Competitive Outlook
- India and China are seeing higher interest as airline fleets expand and aircraft use rises.
- France and the United States benefit from aircraft production and electrical system supplier depth.
- Suppliers with certified hardware and proven controller performance are better placed in new engine programs.
- Analyst Opinion
- Nikhil Kaitwade, Principal Consultant at FMI says, “Starter-generators are becoming more important as turbofan engines support heavier electrical loads. Aircraft makers need safe starting torque and steady power output. Suppliers with certified generator hardware and controller knowledge will be preferred in new engine programs and replacement work.”
- Electrical Starter-Generator Systems for Turbofan Engines Market Value Analysis
- The electrical starter-generator systems for turbofan engines market is moving from basic engine-start support toward a more important aircraft power system role.
- Demand is supported by aircraft designs that need stable electrical power after engine start.
- The market is receiving value as airlines look for certified replacement units that reduce service delays.
- Supplier selection is becoming more focused on heat control along with vibration resistance and reliable controller performance.
Key Takeaways, Market Size, and Forecast
- Electrical starter-generator systems for turbofan engines market stood at USD 800.0 million in 2025.
- By 2036, industry value is forecast to reach USD 1,600.0 million.
- Market value is expected to rise at 5.8% CAGR from 2026 to 2036.
- Market value is predicted to add USD 700.0 million in incremental opportunity over 2026 to 2036
- AC starter-generators are expected to lead system type demand with 47.0% share in 2026.
- OEM installation is anticipated to represent 62.0% of sales channel demand in 2026.
- Commercial aircraft are forecast to account for 58.0% of aircraft use demand in 2026.
- India at 8.4% CAGR and China at 7.8% CAGR are forecast to lead country-level expansion over 2026 to 2036.
Electrical starter-generator systems are moving closer to engine-level power management as turbofan programs add more electric functions. In June 2024, GE Aerospace said its HyTEC work embeds electric motor-generators in a high-bypass commercial turbofan and uses a modified Passport engine for testing. GE said its earlier MW-class hybrid electric system was tested at simulated altitude conditions up to 45,000 feet. The testing gives starter-generator suppliers a clearer role in engine validation and future power architecture work.
Certified accessory-drive limits are becoming a key selection aspect for companies. In May 2026, EASA listed the LEAP-1A electrical generator accessory drive at 129 kW maximum power and 65 kg maximum wet weight. OEMs need generator designs that fit approved power and weight limits without adding certification risk. Low-idle power support is gaining value for operators. Astronics lists 9,250 W at sub-idle speed and 16,000 flight hours MTBF for its 1442 SGU. Operators can reduce ground power dependence when start and generation functions sit inside one brushless unit.
Electrical Starter-Generator Systems for Turbofan Engines Market Definition
The electrical starter-generator systems for turbofan engines market covers engine-mounted units used to start turbofan engines and generate electrical power after engine start.
Electrical Starter-Generator Systems for Turbofan Engines Market Inclusions
The market includes turbofan starter-generators, integrated generators, generator control units, certified power converters, and MRO exchange units made for turbofan engine service. Engine OEMs and aircraft manufacturers are key stakeholders.
Electrical Starter-Generator Systems for Turbofan Engines Market Exclusions
The market excludes automotive starter alternators, industrial gas turbine generators, helicopter-only units, auxiliary power unit generators, battery packs, and ground power units.
Electrical Starter-Generator Systems for Turbofan Engines Market Research Methodology
- Primary Research: FMI analysts reviewed aircraft electrical-power suppliers and engine OEM fitment routes. Airline MRO service needs were checked for replacement patterns.
- Desk Research: Public company sources and aircraft OEM disclosures were used for market checks. Product pages were reviewed for power ratings and system scope.
- Market Sizing and Forecasting: Market size was estimated from aircraft deliveries and turbofan service pools. Starter-generator value per engine was used for bottom-up checks.
- Data Validation: Forecast checks compared engine program activity and supplier power rating evidence. Civil aviation and defense aircraft use were reviewed separately.
Why is the Electrical Starter-Generator Systems for Turbofan Engines Market Growing?
- Rising electric aircraft design is increasing the need for stable engine power generation.
- Narrow-body aircraft use is raising replacement demand as frequent starts add wear to rotating electrical units.
- Hybrid-electric aircraft programs are creating interest in higher-voltage generators and better control systems.
Starter-generator demand is growing as aircraft production keeps the OEM route active. Each new turbofan aircraft needs certified power generation that matches engine design and aircraft electrical needs. Engine-mounted electrical units must work safely under heat and vibration. Suppliers with stable output and long service life can receive stronger placement in new production programs.
More-electric aircraft architecture is changing how aircraft makers view starter-generator systems. Aircraft now need steady power for cockpit electronics and cabin systems. Generator controllers are becoming more important as electrical loads increase across aircraft platforms. Suppliers that offer compact systems with reliable fault checks will have a better chance in future engine programs.
Hybrid-electric aircraft work is creating a future path for advanced generator designs. These programs increase interest in higher-voltage systems and closer integration between propulsion and electrical power. Starter-generator suppliers can get value if their systems support safer power transfer and easier control. Certified hardware and proven controller performance will be important for future aircraft designs.
Market Segmentation Analysis
- In 2026, AC starter-generators are expected to hold 47.0%.
- Narrow-body turbofans are forecast at 56.0% in 2026.
- The 41.0% share for 115 VAC systems is expected in 2026.
- OEM installation is forecast to account for 62.0% during 2026.
- Frequent flights are expected to push commercial aircraft to 58.0% share in 2026.
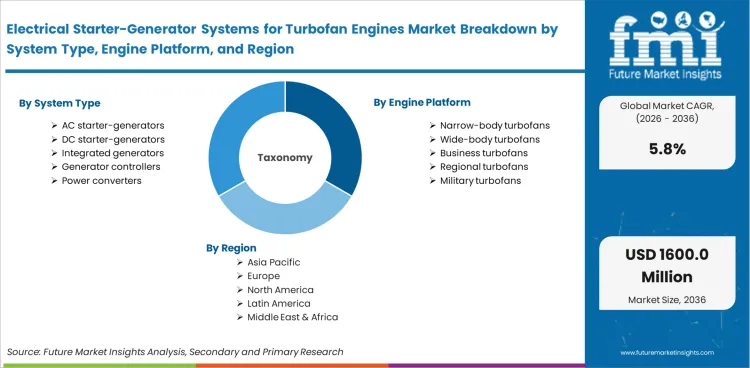
The market is segmented by system type covering AC starter-generators, DC starter-generators, integrated generators, generator controllers and power converters, engine platform covering narrow-body turbofans, wide-body turbofans, business turbofans and military turbofans, voltage class covering 115 VAC systems, 230 VAC systems, 28 VDC systems and 270 VDC systems, sales channel covering OEM installation, aftermarket replacement, retrofit kits and MRO exchange, and aircraft use.
Insights into Electrical Starter-Generator Systems for Turbofan Engines Market by System Type
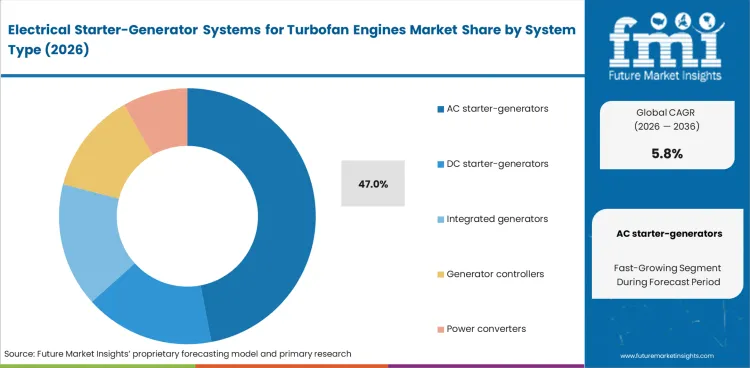
- In 2026, AC starter-generators are expected to hold a 47.0% market share due to their widespread use in certified engine power systems.
- AC units are preferred in turbofan applications since they support steady electrical output under high speed and heat conditions near the engine.
Insights into Electrical Starter-Generator Systems for Turbofan Engines Market by Engine Platform
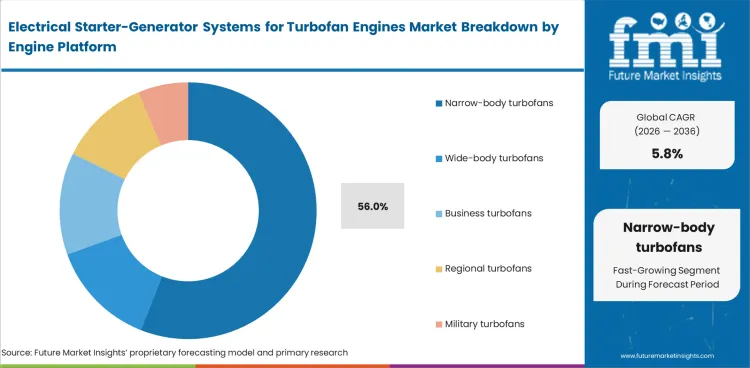
- Narrow-body turbofans are forecast to account for 56.0% of the market in 2026. Frequent short-haul flying creates more engine start cycles and raises the need for reliable starter-generator units.
- Service planning for narrow-body turbofan engine shop visit services supports replacement activity because electrical checks are often reviewed during engine maintenance.
Insights into Electrical Starter-Generator Systems for Turbofan Engines Market by Voltage Class
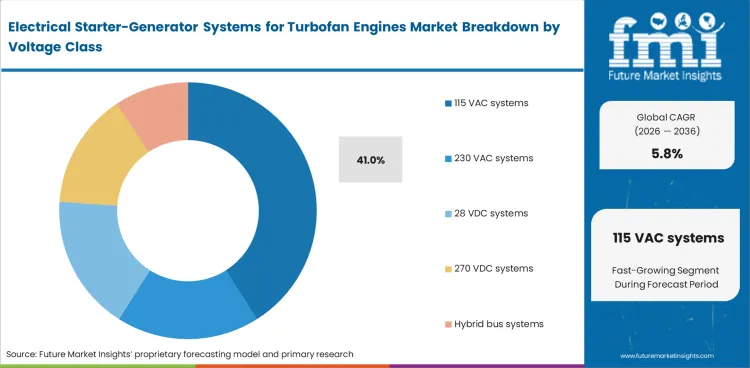
- The 115 VAC systems segment is expected to hold 41.0% in 2026 due to its wide use in aircraft electrical layouts.
- Suppliers gain an advantage when generator output stays stable across changing engine speeds and supports safe power delivery to aircraft systems.
Insights into Electrical Starter-Generator Systems for Turbofan Engines Market by Sales Channel
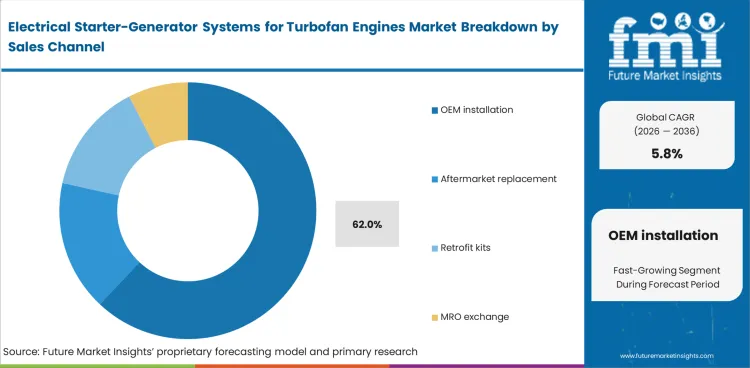
- OEM installation is anticipated to represent 62.0% in 2026 since starter-generators must match engine design before certification.
- Early integration with turbofan engines gives suppliers a stronger position because mounting points and controller behavior are approved during the design stage.
Insights into Electrical Starter-Generator Systems for Turbofan Engines Market by Aircraft Use
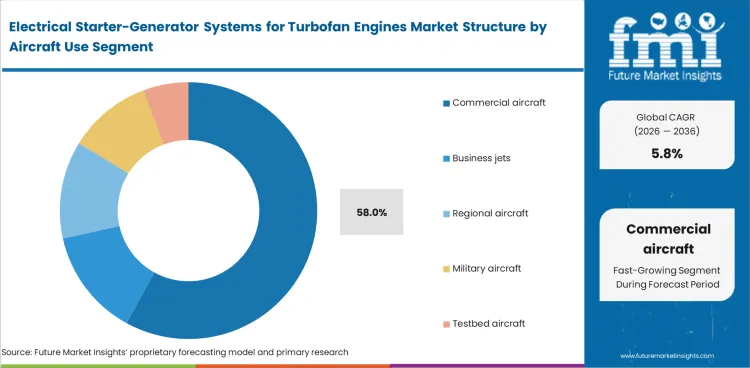
- Commercial aircraft are expected to account for 58.0% in 2026 as airline fleets need starter-generators that can handle repeated flight cycles.
- Operators prefer certified units with reliable fault checks because service delays can affect aircraft availability and maintenance planning.
Electrical Starter-Generator Systems for Turbofan Engines Market Drivers, Restraints, and Opportunities
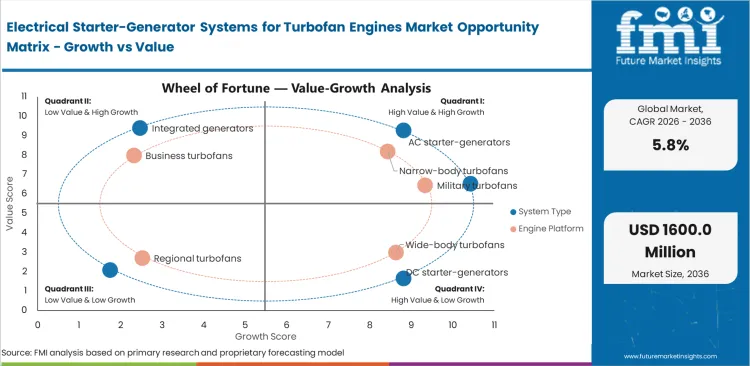
- More-electric aircraft loads are increasing demand for starter-generators with higher output stability.
- Certification cost can slow retrofit activity as engine electrical units need approved endurance evidence.
- Hybrid-electric turbofan work creates opportunity for higher voltage generators and integrated motor-generator systems.
More-Electric Load Rise
Aircraft electrical systems are taking on a signficant role as cockpit and cabin power needs increase. Starter-generators become more important in this shift since they support engine start and power supply after ignition. These units must work safely near heat and changing engine speeds. Collins Aerospace has advanced high-voltage power distribution components under the Clean Aviation SWITCH project. The work supports future aircraft designs in which generator output and power distribution need to operate as one certified system.
Certification Cost Slows Retrofits
Starter-generator retrofits need approved design evidence before installation on certified aircraft. Smaller operators may delay upgrades if parts need aircraft-level approval and extra shop testing. Airbus delivered 793.0 commercial aircraft to 91.0 customers in 2025, which shows the scale of certified aircraft programs that need approved electrical systems. This makes retrofit approval and supplier testing important, as aircraft makers and operators cannot use engine electrical units without clear safety evidence. Suppliers with test records and MRO exchange programs can reduce risk for airlines.
Analysis of Electrical Starter-Generator Systems for Turbofan Engines Market by Key Countries
.webp "Top Country Growth Comparison Electrical Starter Generator Systems For Turbofan Engines Market Cagr (2026 2036)")
| Country | CAGR |
|---|---|
| United States | 5.7% |
| China | 7.8% |
| India | 8.4% |
| France | 6.3% |
| Germany | 5.9% |
| Japan | 5.5% |
| United Kingdom | 5.6% |
Source: Future Market Insights, 2026.
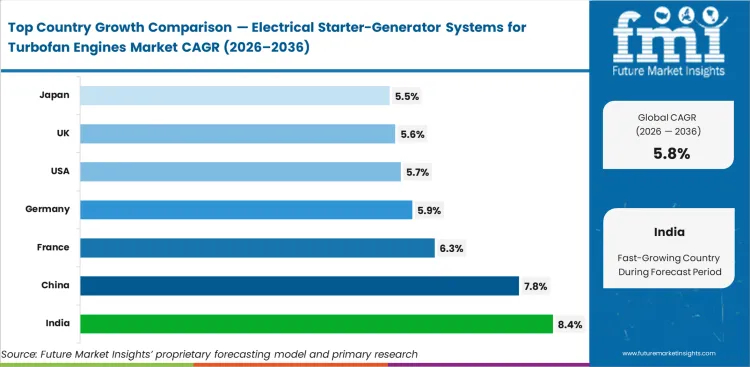
Electrical Starter-Generator Systems for Turbofan Engines Market CAGR Analysis by Country
- Between 2026 and 2036, India is expected to record a 8.4% CAGR as airline fleet additions raise turbofan service needs.
- China is forecast at 7.8% CAGR by 2036 as commercial aircraft activity expands across major routes.
- France is expected to advance at 6.3% CAGR during the forecast period due to aircraft and electrical-system supplier depth.
- Germany is forecast to rise at 5.9% CAGR as aerospace engineering supports electrical architecture development.
- Through 2036, the United States is expected to expand at 5.7% CAGR due to engine OEM and MRO depth.
- The United Kingdom is anticipated to move at 5.6% CAGR as aerospace service providers support engine electrical systems.
- Japan is forecast at 5.5% CAGR from 2026 to 2036 due to precision component supply and defense aircraft support.
Demand Outlook for Electrical Starter-Generator Systems for Turbofan Engines Market in the United States
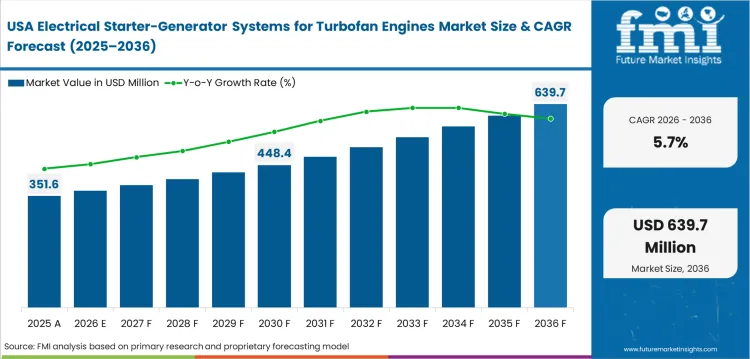
The market in the United States is expected to expand at 5.7% CAGR through 2036 as turbofan engine programs keep starter-generator service active. Aircraft electrical-power suppliers in the country work closely with civil and defense platforms. Engine OEM activity supports replacement demand through certified repair networks. Suppliers with proven hardware and quick exchange access will be better placed with USA operators.
- Engine electrical suppliers benefit from close work with aircraft and engine OEMs.
- Certified repair networks support replacement units for high-use commercial aircraft.
- Defense programs need rugged power generation systems with reliable control packages.
Sales Analysis of Electrical Starter-Generator Systems for Turbofan Engines Market in China
China’s demand is tied to airline fleet expansion and rising aircraft service needs. Commercial aircraft activity across domestic routes is increasing starter-generator inspection and replacement work. Through 2036, China is forecast to move ahead at 7.8% CAGR in the market. Local service capability can become important as fleets move into heavier maintenance cycles and airlines need faster access to certified units.
- Airline fleet use supports replacement planning for engine electrical parts.
- Domestic aircraft programs create long-term interest in local electrical system capability.
- Service providers need certified units that reduce delay risk during engine shop work.
Demand Outlook for Electrical Starter-Generator Systems for Turbofan Engines Market in India
India’s aviation service need is supported by passenger scale, with airports handling 412.0 million passengers in FY25. Wider traffic volume increases aircraft use and supports starter-generator inspection demand. The country is expected to advance at 8.4% CAGR by 2036. Higher route frequency can increase engine start cycles and electrical checks. Suppliers with quick exchange access can get favor among airlines seeking shorter turnaround time.
- Airline fleet additions support OEM and aftermarket starter-generator demand.
- MRO providers need certified electrical units for scheduled engine shop work.
- Local service depth can reduce dependence on overseas replacement routes.
Opportunity Analysis of Electrical Starter-Generator Systems for Turbofan Engines Market in France
France benefits from aircraft production depth and electrical-power system expertise. Safran Electrical & Power gives the country a direct role in certified aircraft generator supply. The market in France is expected to record 6.3% CAGR by 2036 as engine and aircraft programs support system integration. Opportunity is stronger for starter-generators with qualified electronics and proven speed range.
- Aircraft program depth supports early design involvement for electrical-power suppliers.
- Certified generator hardware strengthens France’s role in turbofan engine electrical systems.
- Supplier approval depends on power density and proof of thermal reliability.
Sales Analysis of Electrical Starter-Generator Systems for Turbofan Engines Market in Germany
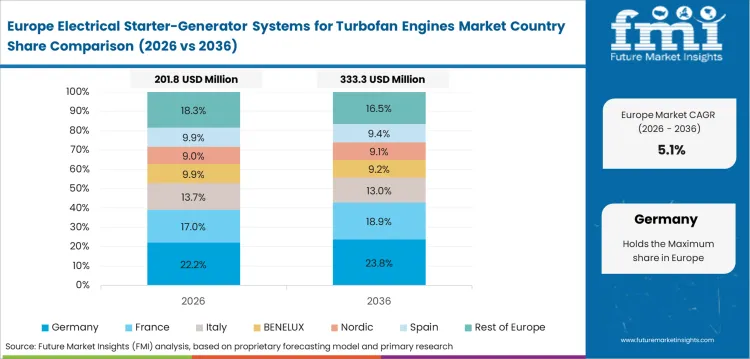
Germany is expected to benefit from aerospace engineering and electrical-system testing capability. BDLI reported German aerospace turnover of EUR 52.0 billion in 2024. This supports a stronger engineering and qualification route for certified aircraft electrical systems. Germany is forecast to expand at 5.9% CAGR through 2036 as demand favors suppliers with test evidence and system-level design support.
- Electrical architecture testing supports future generator interface needs.
- Aerospace suppliers can serve civil and defense aircraft programs.
- Validation depth improves the case for higher voltage power systems.
Future Outlook for Electrical Starter-Generator Systems for Turbofan Engines Market in Japan
Japan is expected to post 5.5% CAGR through 2036 as precision component supply and defense aircraft support keep demand steady. Aircraft electrical systems need compact parts with reliable performance over long service lives. Japanese suppliers can support precision manufacturing and test capability for engine power systems. Demand will depend on imported fleet service needs and domestic defense aircraft programs.
- Precision manufacturing supports components used in aircraft electrical systems.
- Defense aircraft service needs create demand for reliable power generation parts.
- Airline maintenance planning supports replacement units with clear technical records.
Future Outlook for Electrical Starter-Generator Systems for Turbofan Engines Market in the United Kingdom
United Kingdom industry is expected to rise at 5.6% CAGR through 2036 as aerospace service providers support engine electrical systems. Local MRO networks and engineering firms create demand for certified replacement work. Aircraft operators need dependable starter-generator access during shop visits. Suppliers with proven turnaround support can secure repeat business from high-use fleets.
- Aerospace service firms support inspection and replacement of engine electrical units.
- Airline operators need starter-generators with reliable dispatch performance.
- Certification knowledge improves supplier access to engine-related service programs.
Competitive Landscape and Strategic Positioning
- Certified starter-generator hardware is important because the system must start the turbofan engine and supply power after ignition.
- Suppliers need stable output and heat control because the unit works close to the engine gearbox.
- OEM installation favors established suppliers because starter-generators must be approved early in the engine design process.
- New entrants face a high barrier because aircraft programs need airworthiness approval and vibration test evidence.
Competitive positioning depends on proven performance across engine speed ranges. Starter-generators must work safely during engine start and power generation after ignition. Suppliers with tested hardware and controller knowledge are better placed in new aircraft programs. OEMs prefer companies that can support certification work and long-term service needs.
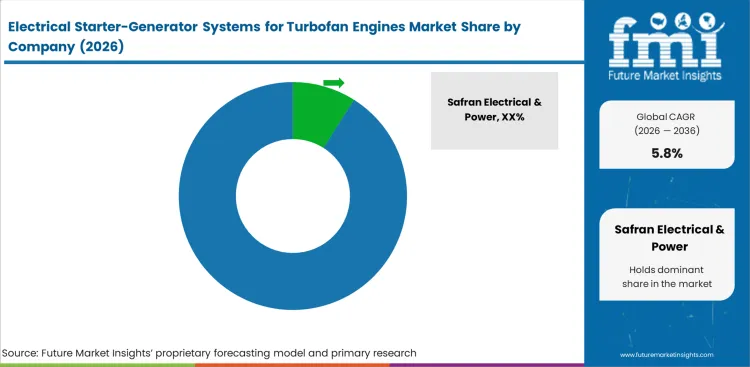
Safran Electrical & Power and Astronics Corporation have clear starter-generator relevance through certified aircraft power generation products. Collins Aerospace supports aircraft power distribution and electrical control systems. Parker Meggitt and Eaton Aerospace support the wider aerospace electrical and power management supply group. Suppliers with engine program access and reliable service support will hold stronger positions in OEM and aftermarket routes.
Key Companies in the Electrical Starter-Generator Systems for Turbofan Engines Market
- Starter-Generator Specialists: Safran Electrical & Power holds a strong position through AC and DC generator products. Astronics Corporation competes through brushless starter-generator and aircraft power generation systems.
- Aircraft Power System Suppliers: Collins Aerospace supports higher voltage power architecture and aircraft electrical distribution. Honeywell Aerospace Technologies has capability in flight control and electric aircraft systems.
- Engine and Aerospace System Participants: GE Aerospace supports hybrid electric propulsion testing and higher power electrical machine development. Parker Meggitt supports aerospace and defense systems through power and control capability.
Competitive Benchmarking: Electrical Starter-Generator Systems for Turbofan Engines Market
| Company | Starter-Generator Depth | Controller Integration | Engine Program Access | Service Support |
|---|---|---|---|---|
| Safran Electrical & Power | High | High | High | High |
| Astronics Corporation | Medium | Medium | Medium | Medium |
| Collins Aerospace | Medium | High | High | High |
| Honeywell Aerospace Technologies | Medium | High | Medium | High |
| GE Aerospace | Medium | High | High | Medium |
| Parker Meggitt | Medium | Medium | Medium | High |
| Eaton Aerospace | Low | Medium | Medium | High |
Source: Future Market Insights competitive analysis, 2026.
Key Developments in Electrical Starter-Generator Systems for Turbofan Engines Market
- In March 2026, Collins Aerospace started testing electric motor drive systems for the Clean Aviation SWITCH project.
- In January 2026, GE Aerospace demonstrated power transfer and injection in a high-bypass commercial turbofan engine.
Key Players in the Electrical Starter-Generator Systems for Turbofan Engines Market
Major Global Players
- Safran Electrical & Power
- Collins Aerospace
- Honeywell Aerospace Technologies
- GE Aerospace
- Parker Meggitt
Specialist and Supporting Players
- Astronics Corporation
- Eaton Aerospace
Market Scope and Coverage
| Parameter | Details |
|---|---|
| Quantitative Units | USD 900.0 million in 2026 to USD 1,600.0 million by 2036 at 5.8% CAGR |
| Market Definition | Engine-mounted starter-generators and control electronics used with turbofan engines |
| Regions Covered | North America, Latin America, Europe, East Asia, South Asia and Pacific, Middle East and Africa |
| Countries Covered | United States, China, India, France, Germany, United Kingdom, Japan and more than 30+ countries |
| Key Companies Profiled | Safran Electrical & Power, Collins Aerospace, Honeywell Aerospace Technologies, GE Aerospace, Parker Meggitt, Astronics Corporation and Eaton Aerospace |
| Forecast Period | 2026 to 2036 |
Electrical Starter-Generator Systems for Turbofan Engines Market Segments
By System Type
- AC starter-generators
- DC starter-generators
- Integrated generators
- Generator controllers
- Power converters
By Engine Platform
- Narrow-body turbofans
- Wide-body turbofans
- Business turbofans
- Regional turbofans
- Military turbofans
By Voltage Class
- 115 VAC systems
- 230 VAC systems
- 28 VDC systems
- 270 VDC systems
- Hybrid bus systems
By Sales Channel
- OEM installation
- Aftermarket replacement
- Retrofit kits
- MRO exchange
By Aircraft Use
- Commercial aircraft
- Business jets
- Regional aircraft
- Military aircraft
- Testbed aircraft
By Region
- North America
- Latin America
- Europe
- East Asia
- South Asia and Pacific
- Middle East and Africa
Research Sources and Bibliography
- Boeing. (2026, January 13). Boeing announces fourth quarter deliveries. Boeing.
- Press Information Bureau. (2026, January 29). World Bank ranks India among the top five countries in terms of private investment in infrastructure among low- and middle-income economies. Government of India.
- Bundesverband der Deutschen Luft- und Raumfahrtindustrie. (2025, May 22). Branchendaten 2024: Deutsche Luft- und Raumfahrtindustrie im Aufwind. BDLI.
- RTX. (2024, October 28). RTX’s Collins Aerospace completes prototype development of high-voltage power distribution components for Clean Aviation SWITCH project. RTX.
- RTX. (2026, March 16). RTX’s Collins Aerospace initiates powertrain testing for Clean Aviation SWITCH project at the Grid. RTX.
- GE Aerospace. (2026, January 26). GE Aerospace successfully demonstrates narrowbody hybrid electric engine system in ground test. GE Aerospace.
- Airbus. (2026, January 12). Airbus reports 793 commercial aircraft deliveries in 2025. Airbus.
- GE Aerospace. (2024, June 19). GE Aerospace further advances development of hybrid electric engines with NASA. GE Aerospace.
- European Union Aviation Safety Agency. (2026, May 11). EASA.E.110: LEAP-1A & LEAP-1C series engines. EASA.
- Astronics Advanced Electronic Systems. (2025, February 27). 1442 400 Amp mid-voltage starter generator unit (SGU). Astronics Corporation.
This bibliography is provided for reader reference and is not exhaustive. The full report contains the complete reference list and detailed citations.
This Report Answers
- What is the 2026 value of the electrical starter-generator systems for turbofan engines market?
- What value is forecast for the market by 2036?
- What CAGR is expected for the market from 2026 to 2036?
- Which system type is expected to hold the leading share in 2026?
- Which sales channel is forecast to dominate demand in 2026?
- Which aircraft use segment is expected to account for the leading share in 2026?
- Which countries are forecast to expand fastest during the forecast period?
- How does aircraft electrification affect starter-generator demand?
- Which companies are active in certified starter-generator and engine electrical-power systems?
- How was the market size estimated and cross-checked?
Frequently Asked Questions
How large is the electrical starter-generator systems for turbofan engines market?
Market value is estimated at USD 900 million in 2026 and is forecast to reach USD 1600 million by 2036.
What CAGR is forecast for the market?
Demand is expected to rise at 5.8% CAGR from 2026 to 2036 as aircraft electrical loads and engine replacement activity increase.
Which system type is expected to lead?
AC starter-generators are expected to hold 47.0% share in 2026 as wide use across main engine electrical-power systems.
Which sales channel holds the main position?
OEM installation is expected to represent 62.0% share in 2026 as starter-generator interfaces must be certified during aircraft design.
Which countries have the faster outlook?
India and China lead country expansion with 8.4% CAGR and 7.8% CAGR from 2026 to 2036.
Which companies are most relevant?
Safran Electrical & Power, Collins Aerospace, Honeywell Aerospace Technologies and GE Aerospace are major companies. Parker Meggitt, Astronics Corporation and Eaton Aerospace support the wider aircraft electrical power supply group.
Why does aircraft electrification affect the market?
Aircraft electrification raises the need for stable engine power generation and better control electronics for higher electrical loads.
What is excluded from the scope?
Automotive starter alternators and industrial gas turbine generators are outside the defined scope. Helicopter-only starter-generators are excluded unless sold for turbofan aircraft programs.
Preview the report firsthand - request a free sample
Get SampleGet the brochure for pricing and purchase details.
Get PDFTable of Content
- Key Takeaways
- Market Size and CAGR
- Top Growth Driver
- Fastest Growing Segment
- Leading Region
- Key Companies
- Emerging Opportunities
- Executive Summary
- Global Market Outlook
- Demand-side Trends
- Supply-side Trends
- Technology Roadmap Analysis
- Analysis and Recommendations
- Analyst Perspective (What is happening? Why now? What should investors know?)
- Key Questions Answered
- How large is the market?
- What is the CAGR?
- What are key trends?
- Which region dominates?
- Who are the leaders?
- Market Overview
- Market Coverage / Taxonomy
- Market Definition / Scope / Limitations
- Research Methodology
- Chapter Orientation
- Analytical Lens and Working Hypotheses
- Market Structure, Signals, and Trend Drivers
- Benchmarking and Cross-market Comparability
- Market Sizing, Forecasting, and Opportunity Mapping
- Research Design and Evidence Framework
- Desk Research Programme (Secondary Evidence)
- Expert Input and Fieldwork (Primary Evidence)
- Tooling, Models, and Reference Databases
- Data Engineering and Model Build
- Quality Assurance and Audit Trail
- Market Background
- Market Dynamics (Drivers, Restraints, Opportunity, Trends)
- Scenario Forecast (Optimistic, Likely, Conservative)
- Impact Analysis
- AI Impact
- Sustainability Impact
- Regulatory Impact
- Technology Impact
- Consumer / Buyer Analysis
- Purchase Drivers
- Adoption Barriers
- Buyer Journey
- Opportunity Map Analysis
- Product Life Cycle Analysis
- Supply Chain Analysis
- Investment Feasibility Matrix
- Value Chain Analysis
- PESTLE and Porter's Analysis
- Regulatory Landscape
- Regional Parent Market Outlook
- Production and Consumption Statistics
- Import and Export Statistics
- Global Market Analysis and Forecast, 2021 to 2036
- Historical Market Size Value (USD Million) & Volume (Unit) Analysis, 2021 to 2025
- Current and Future Market Size Value (USD Million) & Volume (Unit) Projections, 2026 to 2036
- Y-o-Y Growth Trend Analysis
- Absolute $ Opportunity Analysis
- Global Market Pricing Analysis, 2021 to 2036
- Global Market Analysis and Forecast, By System Type, 2021 to 2036
- Introduction / Key Findings
- Historical Market Size Value (USD Million) & Volume (Unit) Analysis By System Type, 2021 to 2025
- Current and Future Market Size Value (USD Million) & Volume (Unit) Analysis and Forecast By System Type, 2026 to 2036
- AC starter-generators
- DC starter-generators
- Integrated generators
- Generator controllers
- Power converters
- AC starter-generators
- Y-o-Y Growth Trend Analysis By System Type, 2021 to 2025
- Absolute $ Opportunity Analysis By System Type, 2026 to 2036
- Global Market Analysis and Forecast, By Engine Platform, 2021 to 2036
- Introduction / Key Findings
- Historical Market Size Value (USD Million) & Volume (Unit) Analysis By Engine Platform, 2021 to 2025
- Current and Future Market Size Value (USD Million) & Volume (Unit) Analysis and Forecast By Engine Platform, 2026 to 2036
- Narrow-body turbofans
- Wide-body turbofans
- Business turbofans
- Regional turbofans
- Military turbofans
- Narrow-body turbofans
- Y-o-Y Growth Trend Analysis By Engine Platform, 2021 to 2025
- Absolute $ Opportunity Analysis By Engine Platform, 2026 to 2036
- Global Market Analysis and Forecast, By Voltage Class, 2021 to 2036
- Introduction / Key Findings
- Historical Market Size Value (USD Million) & Volume (Unit) Analysis By Voltage Class, 2021 to 2025
- Current and Future Market Size Value (USD Million) & Volume (Unit) Analysis and Forecast By Voltage Class, 2026 to 2036
- 115 VAC systems
- 230 VAC systems
- 28 VDC systems
- 270 VDC systems
- Hybrid bus systems
- 115 VAC systems
- Y-o-Y Growth Trend Analysis By Voltage Class, 2021 to 2025
- Absolute $ Opportunity Analysis By Voltage Class, 2026 to 2036
- Global Market Analysis and Forecast, By Sales Channel, 2021 to 2036
- Introduction / Key Findings
- Historical Market Size Value (USD Million) & Volume (Unit) Analysis By Sales Channel, 2021 to 2025
- Current and Future Market Size Value (USD Million) & Volume (Unit) Analysis and Forecast By Sales Channel, 2026 to 2036
- OEM installation
- Aftermarket replacement
- Retrofit kits
- MRO exchange
- OEM installation
- Y-o-Y Growth Trend Analysis By Sales Channel, 2021 to 2025
- Absolute $ Opportunity Analysis By Sales Channel, 2026 to 2036
- Global Market Analysis and Forecast, By Aircraft Use, 2021 to 2036
- Introduction / Key Findings
- Historical Market Size Value (USD Million) & Volume (Unit) Analysis By Aircraft Use, 2021 to 2025
- Current and Future Market Size Value (USD Million) & Volume (Unit) Analysis and Forecast By Aircraft Use, 2026 to 2036
- Commercial aircraft
- Business jets
- Regional aircraft
- Military aircraft
- Testbed aircraft
- Commercial aircraft
- Y-o-Y Growth Trend Analysis By Aircraft Use, 2021 to 2025
- Absolute $ Opportunity Analysis By Aircraft Use, 2026 to 2036
- Global Market Analysis and Forecast, By Region, 2021 to 2036
- Introduction
- Historical Market Size Value (USD Million) & Volume (Unit) Analysis By Region, 2021 to 2025
- Current Market Size Value (USD Million) & Volume (Unit) Analysis and Forecast By Region, 2026 to 2036
- North America
- Latin America
- Western Europe
- Eastern Europe
- East Asia
- South Asia and Pacific
- Middle East & Africa
- Market Attractiveness Analysis By Region
- North America Market Analysis and Forecast, By Country, 2021 to 2036
- Historical Market Size Value (USD Million) & Volume (Unit) Trend Analysis By Market Taxonomy, 2021 to 2025
- Market Size Value (USD Million) & Volume (Unit) Forecast By Market Taxonomy, 2026 to 2036
- By Country
- USA
- Canada
- Mexico
- By System Type
- By Engine Platform
- By Voltage Class
- By Sales Channel
- By Aircraft Use
- By Country
- Market Attractiveness Analysis
- By Country
- By System Type
- By Engine Platform
- By Voltage Class
- By Sales Channel
- By Aircraft Use
- Key Takeaways
- Latin America Market Analysis and Forecast, By Country
- Historical Market Size Value (USD Million) & Volume (Unit) Trend Analysis By Market Taxonomy, 2021 to 2025
- Market Size Value (USD Million) & Volume (Unit) Forecast By Market Taxonomy, 2026 to 2036
- By Country
- Brazil
- Chile
- Rest of Latin America
- By System Type
- By Engine Platform
- By Voltage Class
- By Sales Channel
- By Aircraft Use
- By Country
- Market Attractiveness Analysis
- By Country
- By System Type
- By Engine Platform
- By Voltage Class
- By Sales Channel
- By Aircraft Use
- Key Takeaways
- Western Europe Market Analysis and Forecast, By Country
- Historical Market Size Value (USD Million) & Volume (Unit) Trend Analysis By Market Taxonomy, 2021 to 2025
- Market Size Value (USD Million) & Volume (Unit) Forecast By Market Taxonomy, 2026 to 2036
- By Country
- Germany
- UK
- Italy
- Spain
- France
- Nordic
- BENELUX
- Rest of Western Europe
- By System Type
- By Engine Platform
- By Voltage Class
- By Sales Channel
- By Aircraft Use
- By Country
- Market Attractiveness Analysis
- By Country
- By System Type
- By Engine Platform
- By Voltage Class
- By Sales Channel
- By Aircraft Use
- Key Takeaways
- Eastern Europe Market Analysis and Forecast, By Country
- Historical Market Size Value (USD Million) & Volume (Unit) Trend Analysis By Market Taxonomy, 2021 to 2025
- Market Size Value (USD Million) & Volume (Unit) Forecast By Market Taxonomy, 2026 to 2036
- By Country
- Russia
- Poland
- Hungary
- Balkan & Baltic
- Rest of Eastern Europe
- By System Type
- By Engine Platform
- By Voltage Class
- By Sales Channel
- By Aircraft Use
- By Country
- Market Attractiveness Analysis
- By Country
- By System Type
- By Engine Platform
- By Voltage Class
- By Sales Channel
- By Aircraft Use
- Key Takeaways
- East Asia Market Analysis and Forecast, By Country
- Historical Market Size Value (USD Million) & Volume (Unit) Trend Analysis By Market Taxonomy, 2021 to 2025
- Market Size Value (USD Million) & Volume (Unit) Forecast By Market Taxonomy, 2026 to 2036
- By Country
- China
- Japan
- South Korea
- By System Type
- By Engine Platform
- By Voltage Class
- By Sales Channel
- By Aircraft Use
- By Country
- Market Attractiveness Analysis
- By Country
- By System Type
- By Engine Platform
- By Voltage Class
- By Sales Channel
- By Aircraft Use
- Key Takeaways
- South Asia and Pacific Market Analysis and Forecast, By Country
- Historical Market Size Value (USD Million) & Volume (Unit) Trend Analysis By Market Taxonomy, 2021 to 2025
- Market Size Value (USD Million) & Volume (Unit) Forecast By Market Taxonomy, 2026 to 2036
- By Country
- India
- ASEAN
- Australia & New Zealand
- Rest of South Asia and Pacific
- By System Type
- By Engine Platform
- By Voltage Class
- By Sales Channel
- By Aircraft Use
- By Country
- Market Attractiveness Analysis
- By Country
- By System Type
- By Engine Platform
- By Voltage Class
- By Sales Channel
- By Aircraft Use
- Key Takeaways
- Middle East & Africa Market Analysis and Forecast, By Country
- Historical Market Size Value (USD Million) & Volume (Unit) Trend Analysis By Market Taxonomy, 2021 to 2025
- Market Size Value (USD Million) & Volume (Unit) Forecast By Market Taxonomy, 2026 to 2036
- By Country
- Kingdom of Saudi Arabia
- Other GCC Countries
- Türkiye
- South Africa
- Other African Union
- Rest of Middle East & Africa
- By System Type
- By Engine Platform
- By Voltage Class
- By Sales Channel
- By Aircraft Use
- By Country
- Market Attractiveness Analysis
- By Country
- By System Type
- By Engine Platform
- By Voltage Class
- By Sales Channel
- By Aircraft Use
- Key Takeaways
- Key Countries Market Analysis
- USA
- Pricing Analysis
- Market Share Analysis, 2025
- By System Type
- By Engine Platform
- By Voltage Class
- By Sales Channel
- By Aircraft Use
- Canada
- Pricing Analysis
- Market Share Analysis, 2025
- By System Type
- By Engine Platform
- By Voltage Class
- By Sales Channel
- By Aircraft Use
- Mexico
- Pricing Analysis
- Market Share Analysis, 2025
- By System Type
- By Engine Platform
- By Voltage Class
- By Sales Channel
- By Aircraft Use
- Brazil
- Pricing Analysis
- Market Share Analysis, 2025
- By System Type
- By Engine Platform
- By Voltage Class
- By Sales Channel
- By Aircraft Use
- Chile
- Pricing Analysis
- Market Share Analysis, 2025
- By System Type
- By Engine Platform
- By Voltage Class
- By Sales Channel
- By Aircraft Use
- Germany
- Pricing Analysis
- Market Share Analysis, 2025
- By System Type
- By Engine Platform
- By Voltage Class
- By Sales Channel
- By Aircraft Use
- UK
- Pricing Analysis
- Market Share Analysis, 2025
- By System Type
- By Engine Platform
- By Voltage Class
- By Sales Channel
- By Aircraft Use
- Italy
- Pricing Analysis
- Market Share Analysis, 2025
- By System Type
- By Engine Platform
- By Voltage Class
- By Sales Channel
- By Aircraft Use
- Spain
- Pricing Analysis
- Market Share Analysis, 2025
- By System Type
- By Engine Platform
- By Voltage Class
- By Sales Channel
- By Aircraft Use
- France
- Pricing Analysis
- Market Share Analysis, 2025
- By System Type
- By Engine Platform
- By Voltage Class
- By Sales Channel
- By Aircraft Use
- India
- Pricing Analysis
- Market Share Analysis, 2025
- By System Type
- By Engine Platform
- By Voltage Class
- By Sales Channel
- By Aircraft Use
- ASEAN
- Pricing Analysis
- Market Share Analysis, 2025
- By System Type
- By Engine Platform
- By Voltage Class
- By Sales Channel
- By Aircraft Use
- Australia & New Zealand
- Pricing Analysis
- Market Share Analysis, 2025
- By System Type
- By Engine Platform
- By Voltage Class
- By Sales Channel
- By Aircraft Use
- China
- Pricing Analysis
- Market Share Analysis, 2025
- By System Type
- By Engine Platform
- By Voltage Class
- By Sales Channel
- By Aircraft Use
- Japan
- Pricing Analysis
- Market Share Analysis, 2025
- By System Type
- By Engine Platform
- By Voltage Class
- By Sales Channel
- By Aircraft Use
- South Korea
- Pricing Analysis
- Market Share Analysis, 2025
- By System Type
- By Engine Platform
- By Voltage Class
- By Sales Channel
- By Aircraft Use
- Russia
- Pricing Analysis
- Market Share Analysis, 2025
- By System Type
- By Engine Platform
- By Voltage Class
- By Sales Channel
- By Aircraft Use
- Poland
- Pricing Analysis
- Market Share Analysis, 2025
- By System Type
- By Engine Platform
- By Voltage Class
- By Sales Channel
- By Aircraft Use
- Hungary
- Pricing Analysis
- Market Share Analysis, 2025
- By System Type
- By Engine Platform
- By Voltage Class
- By Sales Channel
- By Aircraft Use
- Kingdom of Saudi Arabia
- Pricing Analysis
- Market Share Analysis, 2025
- By System Type
- By Engine Platform
- By Voltage Class
- By Sales Channel
- By Aircraft Use
- Türkiye
- Pricing Analysis
- Market Share Analysis, 2025
- By System Type
- By Engine Platform
- By Voltage Class
- By Sales Channel
- By Aircraft Use
- South Africa
- Pricing Analysis
- Market Share Analysis, 2025
- By System Type
- By Engine Platform
- By Voltage Class
- By Sales Channel
- By Aircraft Use
- USA
- Market Structure Analysis
- Competition Dashboard
- Competition Benchmarking
- Market Share Analysis of Top Players
- By Regional
- By System Type
- By Engine Platform
- By Voltage Class
- By Sales Channel
- By Aircraft Use
- Emerging Startups
- Innovation Benchmarking
- Competition Analysis
- Competition Deep Dive
- Safran Electrical & Power
- Overview
- Product Portfolio
- Profitability by Market Segments (Product/Region/Sales Channel)
- Sales Footprint
- Strategy Overview
- Marketing Strategy
- Product Strategy
- Channel Strategy
- Collins Aerospace
- Honeywell Aerospace Technologies
- GE Aerospace
- Parker Meggitt
- Astronics Corporation
- Eaton Aerospace
- Safran Electrical & Power
- Case Studies
- Success Stories
- Recent Developments
- Competition Deep Dive
- Assumptions & Acronyms Used


