Reports
- Global Locations -
Headquarters
Future Market Insights, Inc.
Christiana Corporate, 200
Continental Drive, Suite 401,
Newark, Delaware - 19713,
United States
Americas
Future Market Insights, Inc.
616 Corporate Way, Suite 2-9018,
Valley Cottage, NY 10989, United States
MEA
Future Market Insights
1602-6 Jumeirah Bay X2 Tower, Plot No: JLT-PH2-X2A,
Jumeirah Lakes Towers, Dubai,
United Arab Emirates
Europe
Future Market Insights
3rd Floor, 207 Regent Street,
W1B 3HH London
United Kingdom
Asia Pacific
Future Market Insights
Office No. 401-A, 4th Floor,
VANTAGE 9, S.No. 36/1/1,
Baner, Pune 411045, India
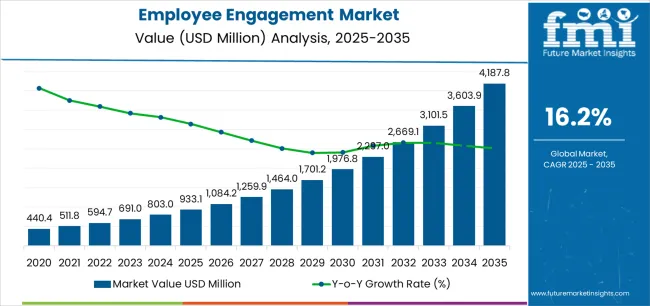
[400 Pages Report] The global employee engagement market is expected to total US$ 1.6 Bn in 2022, with sales growing at a robust 9.1% CAGR. The total employee engagement market size will reach US$ 3.8 Bn by 2032. The employee engagement market accounted for almost 15% of the human resource management market share.
Attribute | Details |
---|---|
Employee Engagement Market Estimated Value (2022) | US$ 1.6 Billion |
Projected Market Size (2032) | US$ 3.8 Billon |
Value-based CAGR% (2022 to 2032) | 9.1% |
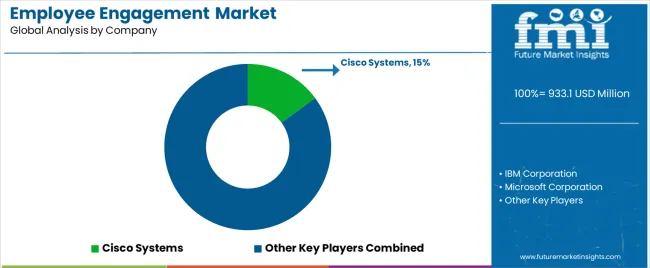
Top 5 Vendor Market Share | 25% |
According to Future Market Insights, employee engagement is one of the most prominent solutions implemented by organizations globally. These solutions can not only improve employee retention, employee productivity and enterprise collaboration, but it is also a critical link to customer satisfaction, corporate reputation, and shareholder value.
Don't pay for what you don't need
Customize your report by selecting specific countries or regions and save 30%!
Employee engagement market expanded at a CAGR of 8.1% between 2017 to 2021. Employees are more interested in professional advancements and career growth. They intend to work at a position that allows them to develop as individuals, both personally and professionally.
Organizations need to maintain an atmosphere in which employees may learn, grow, and improve in their career path. Companies are investing in employee training and development, as well as adequate mentorship programs to align the workforce to the organization’s goals.
A feedback-driven system has been demonstrated to be useful in a range of industries. Having a constant feedback on employee performance is not yet a consistent HR practice, but a growing number of significant corporations are practicing it. The real-time performance management solutions will give employees and human resource experts better insight into the performance of the team.
Organizations are using employee engagement tools for creating a sense of passion and excitement for the job, motivating employees, and unlocking an individual's full potential for the organization’s betterment. People are more accustomed to gadgets in a technologically sophisticated world, and employee engagement solutions play a significant role in this regard, as these solutions improve employee productivity and engagement.
Employee engagement tools such as mobile learning tools that educate the employees, and unified communications software for minimizing the internal communication gap are being incorporated across numerous organizations In addition to this, employee recognition & reward software is widely used for motivating employees.
FMI identifies North America, followed by Europe, as the leading markets. Expansion in South Asia & Pacific is expected to be supported by growth in the number of entry-level companies in the employee engagement market.
As a result of increasing workload in most organizations, the work-life balance of employees has been tremendously affected. According to Buffer, 22% of remote workers believe it is difficult to unplug after work.
Furthermore, according to Forbes, a full week of virtual meetings leaves 38% of employees weary and 30% anxious. Such imbalance of work-life leads to poor employee engagement. To counter this issue, many employee engagement solution providers have started to link health solutions as part of their employee engagement solutions suit.
“Rapid Emergence of Start-ups in Germany Will Boost the Adoption of Employee Engagement Solutions”
Employee engagement solutions demand in Germany is predicted to account for nearly 25.5% of the total Europe employee engagement market share by 2032. Germany is expanding and consolidating its position in the global market for HR automation and industrial control systems, aided by industry 4.0 technology. The country is ranked sixth on the UNDP's human development index. This has accelerated the adoption of employee engagement technologies in Germany and the trend is expected to continue over the forecast period.
“Rising Awareness Regarding Employee Centricity in India Will Fuel Growth”
During the assessment period, the South Asia and Pacific is expected to be one of the most appealing markets. As per the study, sales in the India employee engagement market are predicted to grow by 4.3X over the forecast period.
Human resource management is transforming the Indian economy and workforce. In fact, practically all business verticals are already automating at least 40% of their HR operations. Furthermore, many functions are only possible with AI and machine learning since they are beyond the capabilities of humans.
India's expanding start-up culture encourages the use of automation of the HR department from the BFSI to the healthcare sector. Driven by the aforementioned factors, sales of employee engagement solutions in India are expected to rise.
“Increasing Emergence of Private Companies in Dubai Will Spur Demand for Employee Engagement Solutions”
Demand across GCC countries (United Arab Emirates, Saudi Arabia, Qatar, Oman, Kuwait, and Bahrain) is expected to grow at a CAGR of 9.3% over the forecast period.
Employees in UAE work in a fairly conventional manner as compared to the western countries. The vast majority of employees work in either a private or shared private offices. GCC countries are adopting technology solutions in the workplace rapidly. Saudi Arabia has launched Vision 2030, in which the adoption of technology in people management is part of the vision of technological advancements.
“Growing Popularity of Integrated Employee Engagement Platform Will Drive the Market”
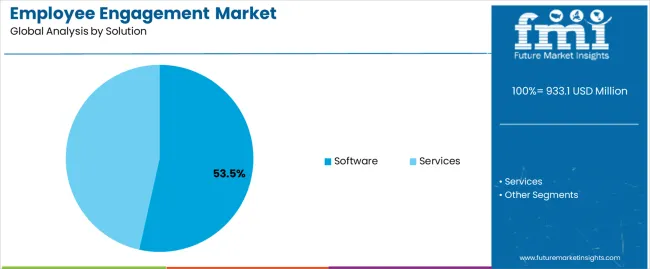
Based on software, sales in the integrated employee engagement platform segment will increase at a CAGR of over 11.0% during the forecast period.
Businesses across the globe are working on improving productivity while maximizing resource efficiency. Implementing a single integrated solution enables firms to reduce the efforts of HR department while achieving plan alignment, team execution, and optimal employee performance.
The comprehensive employee engagement package includes modules such as employee on-boarding, social business & collaboration, performance management, and learning management, employee surveys.
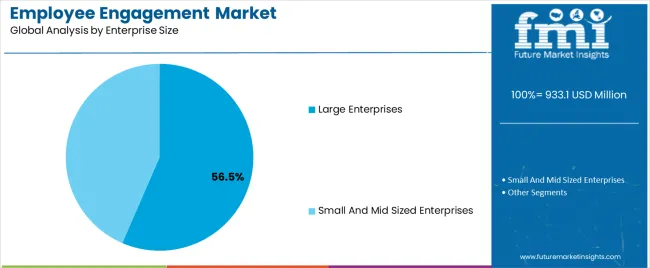
A single solution suite may demonstrate salary management, feedback management, and other solutions, which are appropriate for large businesses. These suits reduce the responsibilities and workload of the HR and also ensure cost reduction. As a result, increasing demand for integrated employee engagement platforms across organizations will drive the market.
“Sales of Cloud-based Employee Engagement Solutions to Gain Traction”
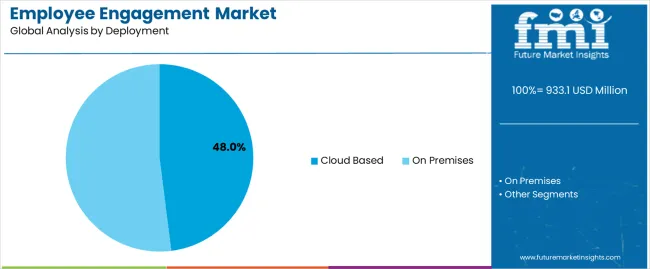
On the basis of deployment, the cloud-based segment will lead the market and is estimated to expand at a CAGR of 10.6% over the forecast period. In addition to this, the cloud-based segment is expected to offer an absolute $ opportunity of US$ 1.2 Bn between 2022 & 2032.
Profitability, simplicity, speed of deployment, and more flexible software administration and operations are all advantages of cloud-based solutions. Cloud platform serves the needs of globally dispersed business divisions by providing a centralized platform.
“Adoption of Employee Engagement Platforms Across IT & Telecomm Sector Will Rise”
In terms of industry, the IT & telecom segment is projected to showcase significant growth at a 9.9% CAGR over the forecast period. The sector is also estimated to create an absolute $ opportunity of US$ 586.7 Mn between 2022- 2032.
Growth can be attributed to the necessity for recruiting individuals based on job descriptions and organizational structure, as well as the increased demand for system automation across the IT industry.
Furthermore, every organization's success relies on employee recognition, learning, and engagement. All of these factors are underpinning the demand for employee engagement solutions in the IT and telecom industry.
Get the data you need at a Fraction of the cost
Personalize your report by choosing insights you need
and save 40%!
Employee engagement market players are boosting their research and development methodologies to support the future needs of organizations. Furthermore, numerous organizations are launching new products and features to build their own unique suits to serve consumers efficiently. In addition, numerous organizations are acquiring and forming partnerships with other players. For instance:
Attribute | Details |
---|---|
Forecast Period | 2022 to 2032 |
Historical Data Available for | 2017 to 2021 |
Market Analysis | US$ Million for Value |
Key Regions Covered | North America, Latin America, Europe, East Asia, South Asia & Pacific, and the Middle East & Africa |
Key Countries Covered | The USA., Canada, Germany, the UK, France, Italy, Spain, BENELUX, Russia, China, Japan, South Korea, India, Malaysia, Indonesia, Singapore, Australia & New Zealand, GCC Countries, Turkey, and South Africa |
Key Segments Covered | Solution, Deployment, Enterprise Size, Industry, and Region |
Key Companies Profiled |
|
Report Coverage | Market Forecast, Company Share Analysis, Competition Intelligence, DROT Analysis, Market Dynamics and Challenges, and Strategic Growth Initiatives |
1. Executive Summary 1.1. Global Market Outlook 1.2. Demand Side Trends 1.3. Supply Side Trends 1.4. Analysis and Recommendations 2. Market Overview 2.1. Market Coverage / Taxonomy 2.2. Market Definition / Scope / Limitations 3. Key Market Trends 3.1. Key Trends Impacting the Market 3.2. Employee Engagement Software Innovation / Development Trends 4. Pricing Analysis 4.1. Pricing Models, By Solution 4.1.1. Subscription Model 4.1.2. Perpetual Licenses 4.2. Global Average Pricing Analysis Benchmark 5. COVID-19 Impact Analysis 5.1. Impact of COVID-19 on Employee Engagement Software Growth 5.2. Pre-COVID-19 Market Growth 5.3. Expected Recovery Scenario (Short Term/Mid Term/Long Term) 5.4. Key Action Points for Employee Engagement Software Vendors 6. Global Employee Engagement Market Demand (in Value in US$ Bn) Analysis 2017-2021 and Forecast, 2022-2032 6.1. Historical Market Value (US$ Bn) Analysis, 2017-2021 6.2. Current and Future Market Value (US$ Bn) Projections, 2022-2032 6.2.1. Y-o-Y Growth Trend Analysis 6.2.2. Absolute $ Opportunity Analysis 7. Market Background 7.1. Macro-Economic Factors 7.1.1. Global GDP Growth Outlook 7.1.2. Internet Penetration Rates 7.1.3. Global ICT Spending Growth Outlook 7.1.4. Regulation & Policies 7.2. Forecast Factors - Relevance & Impact 7.2.1. Impact of COVID-19 on Global Economic Growth 7.2.2. Historic Growth of Employee Engagement Apps Vendors 7.2.3. Increasing Demand for Enterprise Productivity 7.2.4. Enterprise Collaboration Market Growth 7.3. Value Chain 7.4. Market Dynamics 7.4.1. Drivers 7.4.2. Restraints 7.4.3. Opportunities 8. Global Employee Engagement Market Analysis 2017–2021 and Forecast 2022–2032, by Solution 8.1. Introduction / Key Findings 8.2. Historical Market Size (US$ Bn) Analysis By Solution, 2017–2021 8.3. Current and Future Market Size (US$ Bn) Analysis and Forecast by Solution, 2022–2032 8.3.1. Software 8.3.1.1. Integrated Employee Engagement Platform 8.3.1.2. Standalone Software 8.3.1.2.1. Unified Communications Software 8.3.1.2.2. Enterprise Social Intranet Software 8.3.1.2.3. Employee Recognition & Reward Software 8.3.1.2.4. Employee Performance Management Software 8.3.1.2.5. Others 8.3.2. Services 8.3.2.1. Professional Services 8.3.2.1.1. Consulting Services 8.3.2.1.2. Integration & Implementation 8.3.2.1.3. Support & Maintenance 8.3.2.1.4. Training & Development 8.3.2.2. Managed Services 8.4. Market Attractiveness Analysis by Solution 9. Global Employee Engagement Market Analysis 2017-2021 and Forecast 2022-2032, by Deployment 9.1. Introduction / Key Findings 9.2. Historical Market Size (US$ Bn) Analysis By Deployment Mode, 2017 - 2021 9.3. Current and Future Market Size (US$ Bn) Analysis and Forecast By Deployment Mode, 2022 - 2032 9.3.1. Cloud-based 9.3.2. On-premises 9.4. Market Attractiveness Analysis By Deployment Mode 10. Global Employee Engagement Market Analysis 2017-2021 and Forecast 2022-2032, by Enterprise Size 10.1. Introduction / Key Findings 10.2. Historical Market Size (US$ Bn) Analysis By Enterprise Size, 2017 – 2021 10.3. Current and Future Market Size (US$ Bn) Analysis and Forecast By Enterprise Size, 2022 – 2032 10.3.1. Large Enterprises 10.3.2. Small and Mid-Sized Enterprises (SMEs) 10.4. Market Attractiveness Analysis By Enterprise Size 11. Global Employee Engagement Market Analysis 2017-2021 and Forecast 2022-2032, by Industry 11.1. Introduction / Key Findings 11.2. Historical Market Size (US$ Bn) Analysis By Industry, 2017 - 2021 11.3. Current and Future Market Size (US$ Bn) Analysis and Forecast By Industry, 2022 - 2032 11.3.1. IT & Telecom 11.3.2. BFSI 11.3.3. Retail 11.3.4. Healthcare 11.3.5. Government 11.3.6. Manufacturing 11.3.7. Others 11.4. Market Attractiveness Analysis By Industry 12. Global Employee Engagement Market Analysis 2017-2021 and Forecast 2022-2032, by Region 12.1. Introduction / Key Findings 12.2. Historical Market Size (US$ Bn) Analysis By Region, 2017 - 2021 12.3. Current and Future Market Size (US$ Bn) Analysis and Forecast By Region, 2022 - 2032 12.3.1. North America 12.3.2. Latin America 12.3.3. Europe 12.3.4. East Asia 12.3.5. South Asia & Pacific 12.3.6. Middle East & Africa 12.4. Market Attractiveness Analysis By Region 13. North America Employee Engagement Market Analysis 2017-2021 and Forecast 2022-2032 13.1. Introduction 13.2. Historical Market Size (US$ Bn) Trend Analysis By Market Taxonomy, 2017 - 2021 13.3. Current and Future Market Size (US$ Bn) Forecast By Market Taxonomy, 2022 - 2032 13.3.1. By Solution 13.3.2. By Deployment Mode 13.3.3. By Enterprise Size 13.3.4. By Industry 13.3.5. By Country 13.3.5.1. U.S. 13.3.5.2. Canada 13.4. Market Attractiveness Analysis 13.4.1. By Solution 13.4.2. By Deployment Mode 13.4.3. By Enterprise Size 13.4.4. By Industry 13.4.5. By Country 13.5. Market Trends 13.6. Key Market Participants - Intensity Mapping 14. Latin America Employee Engagement Market Analysis 2017-2021 and Forecast 2022-2032 14.1. Introduction 14.2. Historical Market Size (US$ Bn) Trend Analysis By Market Taxonomy, 2017 - 2021 14.3. Current and Future Market Size (US$ Bn) Forecast By Market Taxonomy, 2022 - 2032 14.3.1. By Solution 14.3.2. By Deployment Mode 14.3.3. By Enterprise Size 14.3.4. By Industry 14.3.5. By Country 14.3.5.1. Brazil 14.3.5.2. Mexico 14.3.5.3. Rest of Latin America 14.4. Market Attractiveness Analysis 14.4.1. By Solution 14.4.2. By Deployment Mode 14.4.3. By Enterprise Size 14.4.4. By Industry 14.4.5. By Country 14.5. Market Trends 14.6. Key Market Participants - Intensity Mapping 15. Europe Employee Engagement Market Analysis 2017-2021 and Forecast 2022-2032 15.1. Introduction 15.2. Historical Market Size (US$ Bn) Trend Analysis By Market Taxonomy, 2017 - 2021 15.3. Current and Future Market Size (US$ Bn) Forecast By Market Taxonomy, 2022 - 2032 15.3.1. By Solution 15.3.2. By Deployment Mode 15.3.3. By Enterprise Size 15.3.4. By Industry 15.3.5. By Country 15.3.5.1. Germany 15.3.5.2. Italy 15.3.5.3. France 15.3.5.4. U.K. 15.3.5.5. Spain 15.3.5.6. BENELUX 15.3.5.7. Russia 15.3.5.8. Rest of Europe 15.4. Market Attractiveness Analysis 15.4.1. By Solution 15.4.2. By Deployment Mode 15.4.3. By Enterprise Size 15.4.4. By Industry 15.4.5. By Country 15.5. Market Trends 15.6. Key Market Participants - Intensity Mapping 16. South Asia & Pacific Employee Engagement Market Analysis 2017-2021 and Forecast 2022-2032 16.1. Introduction 16.2. Historical Market Size (US$ Bn) Trend Analysis By Market Taxonomy, 2017 - 2021 16.3. Current and Future Market Size (US$ Bn) Forecast By Market Taxonomy, 2022 - 2032 16.3.1. By Solution 16.3.2. By Deployment Mode 16.3.3. By Enterprise Size 16.3.4. By Industry 16.3.5. By Country 16.3.5.1. India 16.3.5.2. Thailand 16.3.5.3. Indonesia 16.3.5.4. Malaysia 16.3.5.5. Australia & New Zealand 16.3.5.6. Rest of South Asia 16.4. Market Attractiveness Analysis 16.4.1. By Solution 16.4.2. By Deployment Mode 16.4.3. By Enterprise Size 16.4.4. By Industry 16.4.5. By Country 16.5. Market Trends 16.6. Key Market Participants - Intensity Mapping 17. East Asia Employee Engagement Market Analysis 2017-2021 and Forecast 2022-2032 17.1. Introduction 17.2. Historical Market Size (US$ Bn) Trend Analysis By Market Taxonomy, 2017 - 2021 17.3. Current and Future Market Size (US$ Bn) Forecast By Market Taxonomy, 2022 - 2032 17.3.1. By Solution 17.3.2. By Deployment Mode 17.3.3. By Enterprise Size 17.3.4. By Industry 17.3.5. By Country 17.3.5.1. China 17.3.5.2. Japan 17.3.5.3. South Korea 17.4. Market Attractiveness Analysis 17.4.1. By Solution 17.4.2. By Deployment Mode 17.4.3. By Enterprise Size 17.4.4. By Industry 17.4.5. By Country 17.5. Market Trends 17.6. Key Market Participants - Intensity Mapping 18. Middle East and Africa Employee Engagement Market Analysis 2017-2021 and Forecast 2022-2032 18.1. Introduction 18.2. Historical Market Size (US$ Bn) Trend Analysis By Market Taxonomy, 2017 - 2021 18.3. Current and Future Market Size (US$ Bn) Forecast By Market Taxonomy, 2022 - 2032 18.3.1. By Solution 18.3.2. By Deployment Mode 18.3.3. By Enterprise Size 18.3.4. By Industry 18.3.5. By Country 18.3.5.1. GCC Countries 18.3.5.2. Turkey 18.3.5.3. Northern Africa 18.3.5.4. South Africa 18.3.5.5. Rest of Middle East and Africa 18.4. Market Attractiveness Analysis 18.4.1. By Solution 18.4.2. By Deployment Mode 18.4.3. By Enterprise Size 18.4.4. By Industry 18.4.5. By Country 18.5. Market Trends 18.6. Key Market Participants - Intensity Mapping 19. Key Countries Analysis- Employee Engagement Market 19.1. U.S. Employee Engagement Market Analysis 19.1.1. By Solution 19.1.2. By Deployment Mode 19.1.3. By Enterprise Size 19.1.4. By Industry 19.2. Canada Employee Engagement Market Analysis 19.2.1. By Solution 19.2.2. By Deployment Mode 19.2.3. By Enterprise Size 19.2.4. By Industry 19.3. Mexico Employee Engagement Market Analysis 19.3.1. By Solution 19.3.2. By Deployment Mode 19.3.3. By Enterprise Size 19.3.4. By Industry 19.4. Brazil Employee Engagement Market Analysis 19.4.1. By Solution 19.4.2. By Deployment Mode 19.4.3. By Enterprise Size 19.4.4. By Industry 19.5. Germany Employee Engagement Market Analysis 19.5.1. By Solution 19.5.2. By Deployment Mode 19.5.3. By Enterprise Size 19.5.4. By Industry 19.6. Italy Employee Engagement Market Analysis 19.6.1. By Solution 19.6.2. By Deployment Mode 19.6.3. By Enterprise Size 19.6.4. By Industry 19.7. France Employee Engagement Market Analysis 19.7.1. By Solution 19.7.2. By Deployment Mode 19.7.3. By Enterprise Size 19.7.4. By Industry 19.8. U.K. Employee Engagement Market Analysis 19.8.1. By Solution 19.8.2. By Deployment Mode 19.8.3. By Enterprise Size 19.8.4. By Industry 19.9. Spain Employee Engagement Market Analysis 19.9.1. By Solution 19.9.2. By Deployment Mode 19.9.3. By Enterprise Size 19.9.4. By Industry 19.10. BENELUX Employee Engagement Market Analysis 19.10.1. By Solution 19.10.2. By Deployment Mode 19.10.3. By Enterprise Size 19.10.4. By Industry 19.11. Russia Employee Engagement Market Analysis 19.11.1. By Solution 19.11.2. By Deployment Mode 19.11.3. By Enterprise Size 19.11.4. By Industry 19.12. China Employee Engagement Market Analysis 19.12.1. By Solution 19.12.2. By Deployment Mode 19.12.3. By Enterprise Size 19.12.4. By Industry 19.13. Japan Employee Engagement Market Analysis 19.13.1. By Solution 19.13.2. By Deployment Mode 19.13.3. By Enterprise Size 19.13.4. By Industry 19.14. South Korea Employee Engagement Market Analysis 19.14.1. By Solution 19.14.2. By Deployment Mode 19.14.3. By Enterprise Size 19.14.4. By Industry 19.15. India Employee Engagement Market Analysis 19.15.1. By Solution 19.15.2. By Deployment Mode 19.15.3. By Enterprise Size 19.15.4. By Industry 19.16. Thailand Employee Engagement Market Analysis 19.16.1. By Solution 19.16.2. By Deployment Mode 19.16.3. By Enterprise Size 19.16.4. By Industry 19.17. Indonesia Employee Engagement Market Analysis 19.17.1. By Solution 19.17.2. By Deployment Mode 19.17.3. By Enterprise Size 19.17.4. By Industry 19.18. Malaysia Employee Engagement Market Analysis 19.18.1. By Solution 19.18.2. By Deployment Mode 19.18.3. By Enterprise Size 19.18.4. By Industry 19.19. Australia and New Zealand Employee Engagement Market Analysis 19.19.1. By Solution 19.19.2. By Deployment Mode 19.19.3. By Enterprise Size 19.19.4. By Industry 19.20. GCC Countries Employee Engagement Market Analysis 19.20.1. By Solution 19.20.2. By Deployment Mode 19.20.3. By Enterprise Size 19.20.4. By Industry 19.21. Turkey Employee Engagement Market Analysis 19.21.1. By Solution 19.21.2. By Deployment Mode 19.21.3. By Enterprise Size 19.21.4. By Industry 19.22. South Africa Employee Engagement Market Analysis 19.22.1. By Solution 19.22.2. By Deployment Mode 19.22.3. By Enterprise Size 19.22.4. By Industry 20. Market Structure Analysis 20.1. Market Analysis by Tier of Companies 20.2. Market Share Analysis of Top Players 20.3. Market Presence Analysis 20.3.1. Regional footprint by Players 20.3.2. Product footprint by Players 20.3.3. Channel footprint by Players 21. Competition Analysis 21.1. Competition Dashboard 21.2. Key Strategies, By Competitors 21.3. Competition Deep Dive 21.3.1. Cisco Systems, Inc. 21.3.1.1. Business Overview 21.3.1.2. Product & Services Portfolio 21.3.1.3. Financials by Market Segments (Business Segment/Region) 21.3.1.4. Sales Footprint 21.3.1.5. Strategy Overview 21.3.1.5.1. Marketing Strategy 21.3.1.5.2. Product Strategy 21.3.2. IBM Corporation 21.3.2.1. Business Overview 21.3.2.2. Product & Services Portfolio 21.3.2.3. Financials by Market Segments (Business Segment/Region) 21.3.2.4. Sales Footprint 21.3.2.5. Strategy Overview 21.3.2.5.1. Marketing Strategy 21.3.2.5.2. Product Strategy 21.3.3. Microsoft Corporation 21.3.3.1. Business Overview 21.3.3.2. Product & Services Portfolio 21.3.3.3. Financials by Market Segments (Business Segment/Region) 21.3.3.4. Sales Footprint 21.3.3.5. Strategy Overview 21.3.3.5.1. Marketing Strategy 21.3.3.5.2. Product Strategy 21.3.4. Google 21.3.4.1. Business Overview 21.3.4.2. Product & Services Portfolio 21.3.4.3. Financials by Market Segments (Business Segment/Region) 21.3.4.4. Sales Footprint 21.3.4.5. Strategy Overview 21.3.4.5.1. Marketing Strategy 21.3.4.5.2. Product Strategy 21.3.5. Bitrix24 21.3.5.1. Business Overview 21.3.5.2. Product & Services Portfolio 21.3.5.3. Financials by Market Segments (Business Segment/Region) 21.3.5.4. Sales Footprint 21.3.5.5. Strategy Overview 21.3.5.5.1. Marketing Strategy 21.3.5.5.2. Product Strategy 21.3.6. Atlassian Corporation Plc 21.3.6.1. Business Overview 21.3.6.2. Product & Services Portfolio 21.3.6.3. Financials by Market Segments (Business Segment/Region) 21.3.6.4. Sales Footprint 21.3.6.5. Strategy Overview 21.3.6.5.1. Marketing Strategy 21.3.6.5.2. Product Strategy 21.3.7. Xoxoday 21.3.7.1. Business Overview 21.3.7.2. Product & Services Portfolio 21.3.7.3. Financials by Market Segments (Business Segment/Region) 21.3.7.4. Sales Footprint 21.3.7.5. Strategy Overview 21.3.7.5.1. Marketing Strategy 21.3.7.5.2. Product Strategy 21.3.8. Connecteam 21.3.8.1. Business Overview 21.3.8.2. Product & Services Portfolio 21.3.8.3. Financials by Market Segments (Business Segment/Region) 21.3.8.4. Sales Footprint 21.3.8.5. Strategy Overview 21.3.8.5.1. Marketing Strategy 21.3.8.5.2. Product Strategy 21.3.9. Officevibe (GSoft Group Inc.) 21.3.9.1. Business Overview 21.3.9.2. Product & Services Portfolio 21.3.9.3. Financials by Market Segments (Business Segment/Region) 21.3.9.4. Sales Footprint 21.3.9.5. Strategy Overview 21.3.9.5.1. Marketing Strategy 21.3.9.5.2. Product Strategy 21.3.10. ContactMonkey Inc. 21.3.10.1. Business Overview 21.3.10.2. Product & Services Portfolio 21.3.10.3. Financials by Market Segments (Business Segment/Region) 21.3.10.4. Sales Footprint 21.3.10.5. Strategy Overview 21.3.10.5.1. Marketing Strategy 21.3.10.5.2. Product Strategy 21.3.11. Lattice 21.3.11.1. Business Overview 21.3.11.2. Product & Services Portfolio 21.3.11.3. Financials by Market Segments (Business Segment/Region) 21.3.11.4. Sales Footprint 21.3.11.5. Strategy Overview 21.3.11.5.1. Marketing Strategy 21.3.11.5.2. Product Strategy 21.3.12. Peakon 21.3.12.1. Business Overview 21.3.12.2. Product & Services Portfolio 21.3.12.3. Financials by Market Segments (Business Segment/Region) 21.3.12.4. Sales Footprint 21.3.12.5. Strategy Overview 21.3.12.5.1. Marketing Strategy 21.3.12.5.2. Product Strategy 21.3.13. BambooHR 21.3.13.1. Business Overview 21.3.13.2. Product & Services Portfolio 21.3.13.3. Financials by Market Segments (Business Segment/Region) 21.3.13.4. Sales Footprint 21.3.13.5. Strategy Overview 21.3.13.5.1. Marketing Strategy 21.3.13.5.2. Product Strategy 21.3.14. Impraise 21.3.14.1. Business Overview 21.3.14.2. Product & Services Portfolio 21.3.14.3. Financials by Market Segments (Business Segment/Region) 21.3.14.4. Sales Footprint 21.3.14.5. Strategy Overview 21.3.14.5.1. Marketing Strategy 21.3.14.5.2. Product Strategy 21.3.15. LumApps SAS 21.3.15.1. Business Overview 21.3.15.2. Product & Services Portfolio 21.3.15.3. Financials by Market Segments (Business Segment/Region) 21.3.15.4. Sales Footprint 21.3.15.5. Strategy Overview 21.3.15.5.1. Marketing Strategy 21.3.15.5.2. Product Strategy 22. Assumptions and Acronyms Used 23. Research Methodology
Don't pay for what you don't need
Customize your report by selecting specific countries or regions and save 30%!
Table 01: Global Employee Engagement Market Value (US$ Bn) Analysis (2017 – 2021) by Solution Table 02: Global Employee Engagement Market Value (US$ Bn) Analysis (2017 – 2021) by Solution Table 03: Global Employee Engagement Market Value (US$ Bn) Analysis (2017 – 2021) by Solution Table 04: Global Employee Engagement Market Value (US$ Bn) Analysis (2017 – 2021) by Solution Table 05: Global Employee Engagement Market Value (US$ Bn) Analysis (2017 – 2021) by Deployment Table 06: Global Employee Engagement Market Value (US$ Bn) Analysis (2017 – 2021) by Deployment Table 07: Global Employee Engagement Market Value (US$ Bn) Analysis (2017 – 2021) by Enterprise Size Table 08: Global Employee Engagement Market Value (US$ Bn) Analysis (2017 – 2021) by Enterprise Size Table 09: Global Employee Engagement Market Value (US$ Bn) Analysis (2017 – 2021) by Industry Table 10: Global Employee Engagement Market Value (US$ Bn) Analysis (2017 – 2021) by Industry Table 11: Global Employee Engagement Market Value (US$ Bn) Analysis (2017 – 2021) by Region Table 12: Global Employee Engagement Market Value (US$ Bn) Analysis (2017 – 2021) by Region Table 13: North America Employee Engagement Market Value (US$ Bn) Analysis (2017 – 2021) by Solution Table 14: North America Employee Engagement Market Value (US$ Bn) Analysis (2017 – 2021) by Solution Table 15: North America Employee Engagement Market Value (US$ Bn) Analysis (2017 – 2021) by Solution Table 16: North America Employee Engagement Market Value (US$ Bn) Analysis (2017 – 2021) by Solution Table 17: North America Employee Engagement Market Value (US$ Bn) Analysis (2017 – 2021) by Deployment Table 18: North America Employee Engagement Market Value (US$ Bn) Analysis (2017 – 2021) by Deployment Table 19: North America Employee Engagement Market Value (US$ Bn) Analysis (2017 – 2021) by Enterprise Size Table 20: North America Employee Engagement Market Value (US$ Bn) Analysis (2017 – 2021) by Enterprise Size Table 21: North America Employee Engagement Market Value (US$ Bn) Analysis (2017 – 2021) by Industry Table 22: North America Employee Engagement Market Value (US$ Bn) Analysis (2017 – 2021) by Industry Table 23: North America Employee Engagement Market Value (US$ Bn) Analysis (2017 – 2021) by Country Table 24: North America Employee Engagement Market Value (US$ Bn) Analysis (2017 – 2021) by Country Table 25: Latin America Employee Engagement Market Value (US$ Bn) Analysis (2017 – 2021) by Solution Table 26: Latin America Employee Engagement Market Value (US$ Bn) Analysis (2017 – 2021) by Solution Table 27: Latin America Employee Engagement Market Value (US$ Bn) Analysis (2017 – 2021) by Solution Table 28: Latin America Employee Engagement Market Value (US$ Bn) Analysis (2017 – 2021) by Solution Table 29: Latin America Employee Engagement Market Value (US$ Bn) Analysis (2017 – 2021) by Deployment Table 30: Latin America Employee Engagement Market Value (US$ Bn) Analysis (2017 – 2021) by Deployment Table 31: Latin America Employee Engagement Market Value (US$ Bn) Analysis (2017 – 2021) by Enterprise Size Table 32: Latin America Employee Engagement Market Value (US$ Bn) Analysis (2017 – 2021) by Enterprise Size Table 33: Latin America Employee Engagement Market Value (US$ Bn) Analysis (2017 – 2021) by Industry Table 34: Latin America Employee Engagement Market Value (US$ Bn) Analysis (2017 – 2021) by Industry Table 35: Latin America Employee Engagement Market Value (US$ Bn) Analysis (2017 – 2021) by Country Table 36: Latin America Employee Engagement Market Value (US$ Bn) Analysis (2017 – 2021) by Country Table 37: Europe Employee Engagement Market Value (US$ Bn) Analysis (2017 – 2021) by Solution Table 38: Europe Employee Engagement Market Value (US$ Bn) Analysis (2017 – 2021) by Solution Table 39: Europe Employee Engagement Market Value (US$ Bn) Analysis (2017 – 2021) by Solution Table 40: Europe Employee Engagement Market Value (US$ Bn) Analysis (2017 – 2021) by Solution Table 41: Europe Employee Engagement Market Value (US$ Bn) Analysis (2017 – 2021) by Deployment Table 42: Europe Employee Engagement Market Value (US$ Bn) Analysis (2017 – 2021) by Deployment Table 43: Europe Employee Engagement Market Value (US$ Bn) Analysis (2017 – 2021) by Enterprise Size Table 44: Europe Employee Engagement Market Value (US$ Bn) Analysis (2017 – 2021) by Enterprise Size Table 45: Europe Employee Engagement Market Value (US$ Bn) Analysis (2017 – 2021) by Industry Table 46: Europe Employee Engagement Market Value (US$ Bn) Analysis (2017 – 2021) by Industry Table 47: Europe Employee Engagement Market Value (US$ Bn) Analysis (2017 – 2021) by Country Table 48: Europe Employee Engagement Market Value (US$ Bn) Analysis (2017 – 2021) by Country Table 49: East Asia Employee Engagement Market Value (US$ Bn) Analysis (2017 – 2021) by Solution Table 50: East Asia Employee Engagement Market Value (US$ Bn) Analysis (2017 – 2021) by Solution Table 51: East Asia Employee Engagement Market Value (US$ Bn) Analysis (2017 – 2021) by Solution Table 52: East Asia Employee Engagement Market Value (US$ Bn) Analysis (2017 – 2021) by Solution Table 53: East Asia Employee Engagement Market Value (US$ Bn) Analysis (2017 – 2021) by Deployment Table 54: East Asia Employee Engagement Market Value (US$ Bn) Analysis (2017 – 2021) by Deployment Table 55: East Asia Employee Engagement Market Value (US$ Bn) Analysis (2017 – 2021) by Enterprise Size Table 56: East Asia Employee Engagement Market Value (US$ Bn) Analysis (2017 – 2021) by Enterprise Size Table 57: East Asia Employee Engagement Market Value (US$ Bn) Analysis (2017 – 2021) by Industry Table 58: East Asia Employee Engagement Market Value (US$ Bn) Analysis (2017 – 2021) by Industry Table 59: East Asia Employee Engagement Market Value (US$ Bn) Analysis (2017 – 2021) by Country Table 60: East Asia Employee Engagement Market Value (US$ Bn) Analysis (2017 – 2021) by Country Table 61: South Asia & Pacific Employee Engagement Market Value (US$ Bn) Analysis (2017 – 2021) by Solution Table 62: South Asia & Pacific Employee Engagement Market Value (US$ Bn) Analysis (2017 – 2021) by Solution Table 63: South Asia & Pacific Employee Engagement Market Value (US$ Bn) Analysis (2017 – 2021) by Solution Table 64: South Asia & Pacific Employee Engagement Market Value (US$ Bn) Analysis (2017 – 2021) by Solution Table 65: South Asia & Pacific Employee Engagement Market Value (US$ Bn) Analysis (2017 – 2021) by Deployment Table 66: South Asia & Pacific Employee Engagement Market Value (US$ Bn) Analysis (2017 – 2021) by Deployment Table 67: South Asia & Pacific Employee Engagement Market Value (US$ Bn) Analysis (2017 – 2021) by Enterprise Size Table 68: South Asia & Pacific Employee Engagement Market Value (US$ Bn) Analysis (2017 – 2021) by Enterprise Size Table 69: South Asia & Pacific Employee Engagement Market Value (US$ Bn) Analysis (2017 – 2021) by Industry Table 70: South Asia & Pacific Employee Engagement Market Value (US$ Bn) Analysis (2017 – 2021) by Industry Table 71: South Asia & Pacific Employee Engagement Market Value (US$ Bn) Analysis (2017 – 2021) by Country Table 72: South Asia & Pacific Employee Engagement Market Value (US$ Bn) Analysis (2017 – 2021) by Country Table 73: Middle East & Africa Employee Engagement Market Value (US$ Bn) Analysis (2017 – 2021) by Solution Table 74: Middle East & Africa Employee Engagement Market Value (US$ Bn) Analysis (2017 – 2021) by Solution Table 75: Middle East & Africa Employee Engagement Market Value (US$ Bn) Analysis (2017 – 2021) by Solution Table 76: Middle East & Africa Employee Engagement Market Value (US$ Bn) Analysis (2017 – 2021) by Solution Table 77: Middle East & Africa Employee Engagement Market Value (US$ Bn) Analysis (2017 – 2021) by Deployment Table 78: Middle East & Africa Employee Engagement Market Value (US$ Bn) Analysis (2017 – 2021) by Deployment Table 79: Middle East & Africa Employee Engagement Market Value (US$ Bn) Analysis (2017 – 2021) by Enterprise Size Table 80: Middle East & Africa Employee Engagement Market Value (US$ Bn) Analysis (2017 – 2021) by Enterprise Size Table 81: Middle East & Africa Employee Engagement Market Value (US$ Bn) Analysis (2017 – 2021) by Industry Table 82: Middle East & Africa Employee Engagement Market Value (US$ Bn) Analysis (2017 – 2021) by Industry Table 83: Middle East & Africa Employee Engagement Market Value (US$ Bn) Analysis (2017 – 2021) by Country Table 84: Middle East & Africa Employee Engagement Market Value (US$ Bn) Analysis (2017 – 2021) by Country
Figure 01: Global Employee Engagement Market Value (US$ Bn), 2017-2021 Figure 02: Global Employee Engagement Market Value (US$ Bn), 2022-2032 Figure 03: Global Employee Engagement Market Size (US$ Bn) and Y-o-Y Growth Rate from 2022-2032 Figure 04: Global Employee Engagement Market Size and Y-o-Y Growth Rate from 2022-2032 Figure 05: Global Employee Engagement Market Value Y-o-Y Growth Trend Analysis (2019 – 2032) by Solution Figure 06: Global Employee Engagement Market Value Share Analysis (2022 – 2032) by Solution Figure 07: Global Employee Engagement Market Attractiveness by Solution Figure 08: Global Employee Engagement Market Value Y-o-Y Growth Trend Analysis (2019 – 2032) by Deployment Figure 09: Global Employee Engagement Market Value Share Analysis (2022 – 2032) by Deployment Figure 10: Global Employee Engagement Market Attractiveness by Deployment Figure 11: Global Employee Engagement Market Value Y-o-Y Growth Trend Analysis (2019 – 2032) by Enterprise Size Figure 12: Global Employee Engagement Market Value Share Analysis (2022 – 2032) by Enterprise Size Figure 13: Global Employee Engagement Market Attractiveness by Enterprise Size Figure 14: Global Employee Engagement Market Value Y-o-Y Growth Trend Analysis (2019 – 2032) by Industry Figure 15: Global Employee Engagement Market Value Share Analysis (2022 – 2032) by Industry Figure 16: Global Employee Engagement Market Attractiveness by Industry Figure 17: Global Employee Engagement Market Value Y-o-Y Growth Trend Analysis (2019 – 2032) by Region Figure 18: Global Employee Engagement Market Value Share Analysis (2022 – 2032) by Region Figure 19: Global Employee Engagement Market Attractiveness by Region Figure 20: North America Employee Engagement Market Absolute $ Opportunity (US$ Bn), 2017 – 2032 Figure 21: Latin America Employee Engagement Market Absolute $ Opportunity (US$ Bn), 2017 – 2032 Figure 22: Europe Employee Engagement Market Absolute $ Opportunity (US$ Bn), 2017 – 2032 Figure 23: East Asia Employee Engagement Market Absolute $ Opportunity (US$ Bn), 2017 – 2032 Figure 24: South Asia & Pacific Employee Engagement Market Absolute $ Opportunity (US$ Bn), 2017 – 2032 Figure 25: Middle East & Africa Employee Engagement Market Absolute $ Opportunity (US$ Bn), 2017 – 2032 Figure 26: North America Employee Engagement Market Value (US$ Bn), 2017-2021 Figure 27: North America Employee Engagement Market Value (US$ Bn), 2022-2032 Figure 28: North America Employee Engagement Market Value Y-o-Y Growth Trend Analysis (2019 – 2032) by Solution Figure 29: North America Employee Engagement Market Value Share Analysis (2022 – 2032) by Solution Figure 30: North America Employee Engagement Market Attractiveness by Solution Figure 31: North America Employee Engagement Market Value Y-o-Y Growth Trend Analysis (2019 – 2032) by Deployment Figure 32: North America Employee Engagement Market Value Share Analysis (2022 – 2032) by Deployment Figure 33: North America Employee Engagement Market Attractiveness by Deployment Figure 34: North America Employee Engagement Market Value Y-o-Y Growth Trend Analysis (2019 – 2032) by Enterprise Size Figure 35: North America Employee Engagement Market Value Share Analysis (2022 – 2032) by Enterprise Size Figure 36: North America Employee Engagement Market Attractiveness by Enterprise Size Figure 37: North America Employee Engagement Market Value Y-o-Y Growth Trend Analysis (2019 – 2032) by Industry Figure 38: North America Employee Engagement Market Value Share Analysis (2022 – 2032) by Industry Figure 39: North America Employee Engagement Market Attractiveness by Industry Figure 40: North America Employee Engagement Market Value Y-o-Y Growth Trend Analysis (2019 – 2032) by Country Figure 41: North America Employee Engagement Market Value Share Analysis (2022 – 2032) by Country Figure 42: North America Employee Engagement Market Attractiveness by Country Figure 43: U.S. Employee Engagement Market Absolute $ Opportunity (US$ Bn), 2017 – 2032 Figure 44: Canada Employee Engagement Market Absolute $ Opportunity (US$ Bn), 2017 – 2032 Figure 45: Latin America Employee Engagement Market Value (US$ Bn), 2017-2021 Figure 46: Latin America Employee Engagement Market Value (US$ Bn), 2022-2032 Figure 47: Latin America Employee Engagement Market Value Y-o-Y Growth Trend Analysis (2019 – 2032) by Solution Figure 48: Latin America Employee Engagement Market Value Share Analysis (2022 – 2032) by Solution Figure 49: Latin America Employee Engagement Market Attractiveness by Solution Figure 50: Latin America Employee Engagement Market Value Y-o-Y Growth Trend Analysis (2019 – 2032) by Deployment Figure 51: Latin America Employee Engagement Market Value Share Analysis (2022 – 2032) by Deployment Figure 52: Latin America Employee Engagement Market Attractiveness by Deployment Figure 53: Latin America Employee Engagement Market Value Y-o-Y Growth Trend Analysis (2019 – 2032) by Enterprise Size Figure 54: Latin America Employee Engagement Market Value Share Analysis (2022 – 2032) by Enterprise Size Figure 55: Latin America Employee Engagement Market Attractiveness by Enterprise Size Figure 56: Latin America Employee Engagement Market Value Y-o-Y Growth Trend Analysis (2019 – 2032) by Industry Figure 57: Latin America Employee Engagement Market Value Share Analysis (2022 – 2032) by Industry Figure 58: Latin America Employee Engagement Market Attractiveness by Industry Figure 59: Latin America Employee Engagement Market Value Y-o-Y Growth Trend Analysis (2019 – 2032) by Country Figure 60: Latin America Employee Engagement Market Value Share Analysis (2022 – 2032) by Country Figure 61: Latin America Employee Engagement Market Attractiveness by Country Figure 62: Brazil Employee Engagement Market Absolute $ Opportunity (US$ Bn), 2017 – 2032 Figure 63: Mexico Employee Engagement Market Absolute $ Opportunity (US$ Bn), 2017 – 2032 Figure 64: Rest of Latin America Employee Engagement Market Absolute $ Opportunity (US$ Bn), 2017 – 2032 Figure 65: Europe Employee Engagement Market Value (US$ Bn), 2017-2021 Figure 66: Europe Employee Engagement Market Value (US$ Bn), 2022-2032 Figure 67: Europe Employee Engagement Market Value Y-o-Y Growth Trend Analysis (2019 – 2032) by Solution Figure 68: Europe Employee Engagement Market Value Share Analysis (2022 – 2032) by Solution Figure 69: Europe Employee Engagement Market Attractiveness by Solution Figure 70: Europe Employee Engagement Market Value Y-o-Y Growth Trend Analysis (2019 – 2032) by Deployment Figure 71: Europe Employee Engagement Market Value Share Analysis (2022 – 2032) by Deployment Figure 72: Europe Employee Engagement Market Attractiveness by Deployment Figure 73: Europe Employee Engagement Market Value Y-o-Y Growth Trend Analysis (2019 – 2032) by Enterprise Size Figure 74: Europe Employee Engagement Market Value Share Analysis (2022 – 2032) by Enterprise Size Figure 75: Europe Employee Engagement Market Attractiveness by Enterprise Size Figure 76: Europe Employee Engagement Market Value Y-o-Y Growth Trend Analysis (2019 – 2032) by Industry Figure 77: Europe Employee Engagement Market Value Share Analysis (2022 – 2032) by Industry Figure 78: Europe Employee Engagement Market Attractiveness by Industry Figure 79: Europe Employee Engagement Market Value Y-o-Y Growth Trend Analysis (2019 – 2032) by Country Figure 80: Europe Employee Engagement Market Value Share Analysis (2022 – 2032) by Country Figure 81: Europe Employee Engagement Market Attractiveness by Country Figure 82: Germany Employee Engagement Market Absolute $ Opportunity (US$ Bn), 2017 – 2032 Figure 83: Italy Employee Engagement Market Absolute $ Opportunity (US$ Bn), 2017 – 2032 Figure 84: France Employee Engagement Market Absolute $ Opportunity (US$ Bn), 2017 – 2032 Figure 85: U.K. Employee Engagement Market Absolute $ Opportunity (US$ Bn), 2017 – 2032 Figure 86: Spain Employee Engagement Market Absolute $ Opportunity (US$ Bn), 2017 – 2032 Figure 87: BENELUX Employee Engagement Market Absolute $ Opportunity (US$ Bn), 2017 – 2032 Figure 88: Russia Employee Engagement Market Absolute $ Opportunity (US$ Bn), 2017 – 2032 Figure 89: Rest of Europe Employee Engagement Market Absolute $ Opportunity (US$ Bn), 2017 – 2032 Figure 90: East Asia Employee Engagement Market Value (US$ Bn), 2017-2021 Figure 91: East Asia Employee Engagement Market Value (US$ Bn), 2022-2032 Figure 92: East Asia Employee Engagement Market Value Y-o-Y Growth Trend Analysis (2019 – 2032) by Solution Figure 93: East Asia Employee Engagement Market Value Share Analysis (2022 – 2032) by Solution Figure 94: East Asia Employee Engagement Market Attractiveness by Solution Figure 95: East Asia Employee Engagement Market Value Y-o-Y Growth Trend Analysis (2019 – 2032) by Deployment Figure 96: East Asia Employee Engagement Market Value Share Analysis (2022 – 2032) by Deployment Figure 97: East Asia Employee Engagement Market Attractiveness by Deployment Figure 98: East Asia Employee Engagement Market Value Y-o-Y Growth Trend Analysis (2019 – 2032) by Enterprise Size Figure 99: East Asia Employee Engagement Market Value Share Analysis (2022 – 2032) by Enterprise Size Figure 100: East Asia Employee Engagement Market Attractiveness by Enterprise Size Figure 101: East Asia Employee Engagement Market Value Y-o-Y Growth Trend Analysis (2019 – 2032) by Industry Figure 102: East Asia Employee Engagement Market Value Share Analysis (2022 – 2032) by Industry Figure 103: East Asia Employee Engagement Market Attractiveness by Industry Figure 104: East Asia Employee Engagement Market Value Y-o-Y Growth Trend Analysis (2019 – 2032) by Country Figure 105: East Asia Employee Engagement Market Value Share Analysis (2022 – 2032) by Country Figure 106: East Asia Employee Engagement Market Attractiveness by Country Figure 107: China Employee Engagement Market Absolute $ Opportunity (US$ Bn), 2017 – 2032 Figure 108: Japan Employee Engagement Market Absolute $ Opportunity (US$ Bn), 2017 – 2032 Figure 109: South Korea Employee Engagement Market Absolute $ Opportunity (US$ Bn), 2017 – 2032 Figure 110: South Asia & Pacific Employee Engagement Market Value (US$ Bn), 2017-2021 Figure 111: South Asia & Pacific Employee Engagement Market Value (US$ Bn), 2022-2032 Figure 112: South Asia & Pacific Employee Engagement Market Value Y-o-Y Growth Trend Analysis (2019 – 2032) by Solution Figure 113: South Asia & Pacific Employee Engagement Market Value Share Analysis (2022 – 2032) by Solution Figure 114: South Asia & Pacific Employee Engagement Market Attractiveness by Solution Figure 115: South Asia & Pacific Employee Engagement Market Value Y-o-Y Growth Trend Analysis (2019 – 2032) by Deployment Figure 116: South Asia & Pacific Employee Engagement Market Value Share Analysis (2022 – 2032) by Deployment Figure 117: South Asia & Pacific Employee Engagement Market Attractiveness by Deployment Figure 118: South Asia & Pacific Employee Engagement Market Value Y-o-Y Growth Trend Analysis (2019 – 2032) by Enterprise Size Figure 119: South Asia & Pacific Employee Engagement Market Value Share Analysis (2022 – 2032) by Enterprise Size Figure 120: South Asia & Pacific Employee Engagement Market Attractiveness by Enterprise Size Figure 121: South Asia & Pacific Employee Engagement Market Value Y-o-Y Growth Trend Analysis (2019 – 2032) by Industry Figure 122: South Asia & Pacific Employee Engagement Market Value Share Analysis (2022 – 2032) by Industry Figure 123: South Asia & Pacific Employee Engagement Market Attractiveness by Industry Figure 124: South Asia & Pacific Employee Engagement Market Value Y-o-Y Growth Trend Analysis (2019 – 2032) by Country Figure 125: South Asia & Pacific Employee Engagement Market Value Share Analysis (2022 – 2032) by Country Figure 126: South Asia & Pacific Employee Engagement Market Attractiveness by Country Figure 127: India Employee Engagement Market Absolute $ Opportunity (US$ Bn), 2017 – 2032 Figure 128: Malaysia Employee Engagement Market Absolute $ Opportunity (US$ Bn), 2017 – 2032 Figure 129: Indonesia Employee Engagement Market Absolute $ Opportunity (US$ Bn), 2017 – 2032 Figure 130: Singapore Employee Engagement Market Absolute $ Opportunity (US$ Bn), 2017 – 2032 Figure 131: Australia & New Zealand Employee Engagement Market Absolute $ Opportunity (US$ Bn), 2017 – 2032 Figure 132: Rest of South Asia & Pacific Employee Engagement Market Absolute $ Opportunity (US$ Bn), 2017 – 2032 Figure 133: Middle East & Africa Employee Engagement Market Value (US$ Bn), 2017-2021 Figure 134: Middle East & Africa Employee Engagement Market Value (US$ Bn), 2022-2032 Figure 135: Middle East & Africa Employee Engagement Market Value Y-o-Y Growth Trend Analysis (2019 – 2032) by Solution Figure 136: Middle East & Africa Employee Engagement Market Value Share Analysis (2022 – 2032) by Solution Figure 137: Middle East & Africa Employee Engagement Market Attractiveness by Solution Figure 138: Middle East & Africa Employee Engagement Market Value Y-o-Y Growth Trend Analysis (2019 – 2032) by Deployment Figure 139: Middle East & Africa Employee Engagement Market Value Share Analysis (2022 – 2032) by Deployment Figure 140: Middle East & Africa Employee Engagement Market Attractiveness by Deployment Figure 141: Middle East & Africa Employee Engagement Market Value Y-o-Y Growth Trend Analysis (2019 – 2032) by Enterprise Size Figure 142: Middle East & Africa Employee Engagement Market Value Share Analysis (2022 – 2032) by Enterprise Size Figure 143: Middle East & Africa Employee Engagement Market Attractiveness by Enterprise Size Figure 144: Middle East & Africa Employee Engagement Market Value Y-o-Y Growth Trend Analysis (2019 – 2032) by Industry Figure 145: Middle East & Africa Employee Engagement Market Value Share Analysis (2022 – 2032) by Industry Figure 146: Middle East & Africa Employee Engagement Market Attractiveness by Industry Figure 147: Middle East & Africa Employee Engagement Market Value Y-o-Y Growth Trend Analysis (2019 – 2032) by Country Figure 148: Middle East & Africa Employee Engagement Market Value Share Analysis (2022 – 2032) by Country Figure 149: Middle East & Africa Employee Engagement Market Attractiveness by Country Figure 150: GCC Countries Employee Engagement Market Absolute $ Opportunity (US$ Bn), 2017 – 2032 Figure 151: Turkey Employee Engagement Market Absolute $ Opportunity (US$ Bn), 2017 – 2032 Figure 152: Northern Africa Employee Engagement Market Absolute $ Opportunity (US$ Bn), 2017 – 2032 Figure 153: South Africa Employee Engagement Market Absolute $ Opportunity (US$ Bn), 2017 – 2032 Figure 154: Rest of Middle East & Africa Employee Engagement Market Absolute $ Opportunity (US$ Bn), 2017 – 2032
Recommendations
Explore Technology Insights
View Reports