
- Market Size (2026)
- USD 127.7 Mn
- Forecast (2036)
- USD 379.1 Mn
- CAGR (2026 to 2036)
- 11.5%
How big is the Enriched Biochar Market in 2026?
The global enriched biochar market is valued at USD 127.7 million in 2026 and is projected to reach USD 379.1 million by 2036, growing at a CAGR of 11.5%. The market was valued at USD 115.0 million in 2025.
Enriched Biochar Market Size and Forecast
Table 1: Enriched Biochar Market Size and Forecast
| Market size and forecast | Value |
|---|---|
| Market size in 2025 | USD 115.0 million |
| Estimated market size in 2026 | USD 127.7 million |
| Projected market size by 2036 | USD 379.1 million |
| CAGR from 2026 to 2036 | 11.5% |
| Dominant enrichment type (2026) | Compost and organic matter blends, 34.0% of revenue |
| High-growth country markets | India (15.0% CAGR), China (13.0%), Brazil (13.0%) |
| Leading Tier-1 companies | Wakefield BioChar, Carbon Gold, Pacific Biochar, Novocarbo |
Source: Future Market Insights analysis of the enriched biochar market, 2026.
Demand for enriched biochar is rising due to its use by row crop farmers, greenhouse growers and garden product brands to improve water and nutrient retention in soil over several seasons. Income from carbon removal credits is also contributing to demand, because it allows producers to price the product below its full production cost in regions where credit purchasers share the expense. However, price relative to yield gain can create challenges for growth, as enriched biochar costs several times more per hectare than compost or manure. Field trials in temperate soils also tend to show soil carbon and moisture benefits before they show higher yields, so many farmers wait for local evidence. Microbial and mineral enrichment is expected to gain share from simple compost blends, with FMI projecting microbial inoculated biochar to grow at 13.3% a year, against 11.5% for the market, while crop residue feedstocks are projected to grow at 13.0%. New certification methods with separate tracks for small producers offer a large opportunity, since they allow kiln-scale output in Asia, Africa and Latin America to earn credit income. By enrichment type, compost and organic matter blends account for 34.0% of 2026 revenue, while woody biomass holds 52.0% by feedstock and field crop agriculture accounts for 38.0% by application. Key companies include Wakefield BioChar, Carbon Gold, Pacific Biochar and Novocarbo.
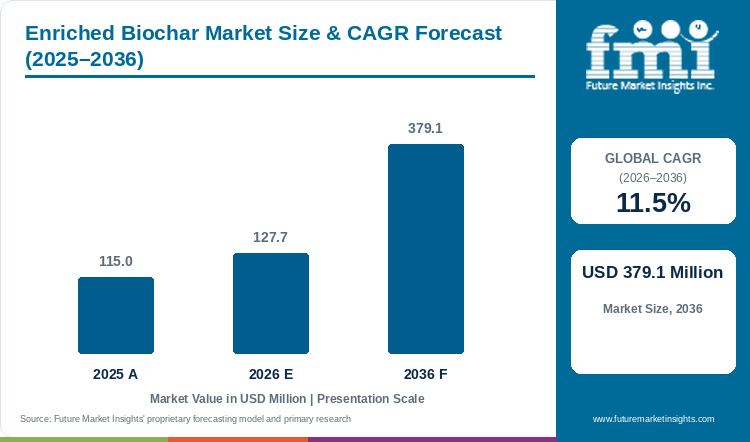
Key Market Trends & Insights
- Microbial and mineral enrichment is expected to gain share from simple compost blends. Growers are paying more for char that arrives charged with nutrients or inoculated with beneficial microbes, because it works from the first season without a separate charging step on the farm. FMI projects microbial inoculated biochar to grow at 13.3% a year and mineral nutrient charged biochar at 12.3%, while compost and organic matter blends slip from 34.0% to 32.0% of revenue.
- Waste and crop residue feedstocks are likely to grow faster than wood. Producers are building pyrolysis units next to farms, food processors and wastewater plants, where feedstock is cheap and disposal costs are avoided. FMI projects sewage sludge and other wastes to grow at 14.0% a year and crop residues at 13.0%, while woody biomass falls from 52.0% to 47.4% of revenue.
- Pelletized products are expected to become far more common. Pellets spread with standard fertilizer equipment and blend evenly with granular nutrients, which removes one of the main handling problems of fine char. FMI projects pellets to grow at 13.4% a year, raising their share of revenue from 30.0% in 2026 to 35.5% by 2036.
Regional Highlights
- North America is expected to remain the largest region. The United States and Canada are projected to grow from USD 39.6 million in 2026 to USD 112.3 million by 2036, holding close to 30% of global revenue, supported by carbon removal offtake agreements and a large garden retail channel.
- China is likely to be the main source of new revenue. Its revenue is projected to rise from USD 17.9 million in 2026 to USD 60.6 million by 2036, lifting its share from 14.0% to 16.0%, and China alone is likely to add USD 42.7 million, about a sixth of the market's increase.
- India is projected to grow at 15.0% a year, well above the global rate, as carbon removal developers turn crop residues that are now burned in the field into biochar for farms. Europe is expected to lose share, with Germany, the United Kingdom and Switzerland falling from 15.0% to 13.4% of global revenue.
Analyst Perspective
"Enriched biochar sells on two value streams at once, soil performance for the farmer and stored carbon for the credit buyer. Producers that rely on only one of them struggle, because few farmers will pay the full cost for soil benefits alone and credit buyers can pause purchases at short notice. The companies most likely to grow are those that lock in long-term credit offtake, cut costs with local residue feedstocks and can show yield and input savings on their customers' own fields."
- Nandini Roy Choudhury, Principal Consultant, FMI
How is the Enriched Biochar Market segmented?
The Enriched Biochar Market is segmented by enrichment type, feedstock, application, form, sales channel and region. Enrichment type covers compost and organic matter blends, mineral nutrient charged biochar, microbial inoculated biochar, manure and digestate co-processed biochar, and other enriched products. Feedstock covers woody biomass, crop residues, animal manure, sewage sludge and other wastes, and other feedstocks. Application covers field crop agriculture, horticulture and greenhouse growing media, home gardening, turf, landscaping and urban trees, livestock feed and bedding, and land reclamation. Form covers granular, pelletized, powder and fines, and liquid suspensions. Sales channel covers agricultural distributors and cooperatives, direct sales to farms and growers, garden centers and retail, and online sales.
Why does the Compost and Organic Matter Blends segment lead by Enrichment Type?
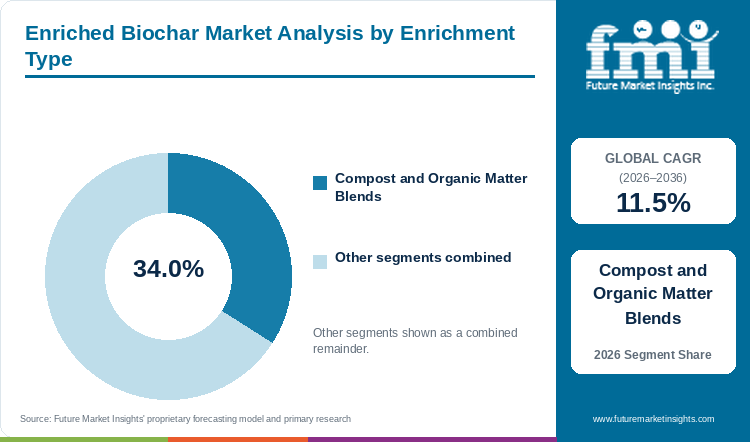
Compost and organic matter blends account for 34.0% of 2026 revenue by enrichment type, the largest share of any enrichment method.
Fresh biochar can tie up nitrogen in the soil during its first season, so most buyers want char that has already been loaded with nutrients and microbes. Blending with compost is the cheapest way to do that, because compost producers, municipal green waste sites and farms already have the material, the space and the handling equipment. That low cost keeps blends within reach of vegetable growers, landscapers and garden brands that compare price per cubic meter with ordinary compost and potting soil, and it places the segment next to the wider organic fertilizer market. The segment's share is projected to slip to 32.0% by 2036 as mineral charged and microbial products grow faster. Those products carry higher nutrient values per tonne and suit large row crop farms that want a predictable response in the first year. Compost blends are likely to keep their lead in retail and landscaping, where buyers value water retention and soil structure more than nutrient analysis.
Farm trials are testing these blends at field scale. A South Australian grain farm reported strong early gains in soil microbial activity from a blend of biochar and pig manure compost.
Why does the Woody Biomass segment lead by Feedstock?
Wood supplies a little over half of the char sold for enrichment, and woody biomass accounts for 52.0% of 2026 revenue by feedstock.
Wood residues give producers the most consistent char. Sawmill offcuts, forest thinnings, orchard prunings and clean wood chips have low ash, few contaminants and stable carbon content, which makes certification under carbon removal and soil product standards easier and lowers testing costs. Many pyrolysis plants are also built to sell heat to district heating networks or industry, and wood suits that model because it can be stored and dried for steady year-round operation. Supply is the main constraint. Wood is also wanted by pellet, panel and bioenergy plants, and its price rises when those industries expand, which squeezes margins for char producers. The segment's share is projected to fall to 47.4% by 2036 as crop residues, manure and sewage sludge grow faster, since those feedstocks often come with a disposal fee instead of a purchase cost.
Utilities are now signing long-term contracts for wood-based char plants. Novocarbo plans a Carbon Removal Park in Dessau, Germany, that will turn wood chips and fruit pits into biochar while supplying up to 13.5 gigawatt hours of heat a year to the local network for 15 years.
Why does the Field Crop Agriculture segment lead by Application?
Field crop agriculture accounts for 38.0% of 2026 revenue by application, and it is the only application projected to gain share over the decade, reaching 41.6% by 2036.
Volume decides the lead. A single grain farm can apply several tonnes per hectare across hundreds of hectares, so farm buyers absorb far more product than gardeners or greenhouse operators. Demand is strongest on sandy, acidic or degraded soils, where biochar's ability to hold water and nutrients reduces fertilizer losses and protects yields in dry years. Carbon removal projects reinforce the segment, since most credit developers return the char to farmland near where the feedstock came from and pay farmers to apply it. The same buyers are price sensitive. Row crop margins depend on commodity prices, and farmers apply enriched biochar at scale only when the cost is shared by a credit buyer or when trials show clear savings, which ties the segment to the biochar fertilizer market and to carbon finance.
Long-term data support repeated use. A Chinese Academy of Sciences analysis of 438 field studies found that annual biochar application over four years or more raised crop yields by an average of 10.8%.
What are the key drivers, restraints and opportunities?
Carbon removal finance is expected to drive growth, while the cost of the product relative to its yield benefit is likely to limit how fast farmers adopt it. Certification methods that open the credit market to small and mid-sized producers offer the largest new source of supply and demand.
Driver
Carbon removal finance is expected to drive demand for enriched biochar. Biochar stores carbon in a stable form for centuries, and companies that need durable removals are signing multiyear agreements to purchase the credits that biochar projects generate. That revenue lets producers sell char to farmers at a lower price, fund enrichment and spreading, and in some cases pay growers to supply residues and apply the product. As a result, field crop demand rises where credit projects operate, even among farmers who would not pay the full product cost. The growth of the carbon credit market also brings stricter measurement, which favors producers that can track feedstock, production and application on each farm. Large offtakes show the scale. Varaha agreed in January 2026 to supply Microsoft with biochar removals from cotton stalks in Maharashtra, India, through up to 18 reactors over 15 years, with US biochar credits for 2025 delivery trading at around USD 150 per tonne of CO2.
Restraint
The cost of enriched biochar relative to its yield benefit is likely to restrain adoption. Pyrolysis plants, enrichment, testing and transport all add cost, and farmers in temperate regions often see improvements in soil carbon and structure before they see higher yields. Without a credit buyer to share the cost, most farmers limit biochar to high-value crops or small areas. A three-year trial in Hesse, Germany, found that biologically activated biochar raised soil organic carbon but did not improve yields, and its cost of about EUR 800 per tonne (about USD 930) was described as economically unfeasible under current market conditions.5 Carbon finance can also stall. Microsoft, one of the largest buyers of carbon removals, paused new purchases in April 2026.
Opportunity
New certification methods for smaller producers offer a large opportunity. Much of the biochar made in Asia, Africa and Latin America comes from small kilns and mobile units close to farms, where feedstock is cheap and the char goes straight back to fields. Until recently, those producers struggled to earn credits because standards were built for large industrial plants. Methods with separate tracks for small, mechanized and industrial producers allow more of that output to earn credit income, which in turn funds enrichment and wider use on farms. Crop residues, the feedstock most small producers use, are projected to grow at 13.0% a year. The standards are now in place. Gold Standard published its first biochar removal methodology in November 2026, with three monitoring tracks that start with kilns processing less than one tonne of dry biomass a day.
Enriched Biochar Market by Country (2026 to 2036)
The United States accounts for the largest share of revenue, while India, China and Brazil are projected to grow above the global rate. FMI projects the ten countries below to hold 76.5% of global revenue in both 2026 and 2036.
Table 2: Enriched Biochar Market CAGR by Country, 2026 to 2036
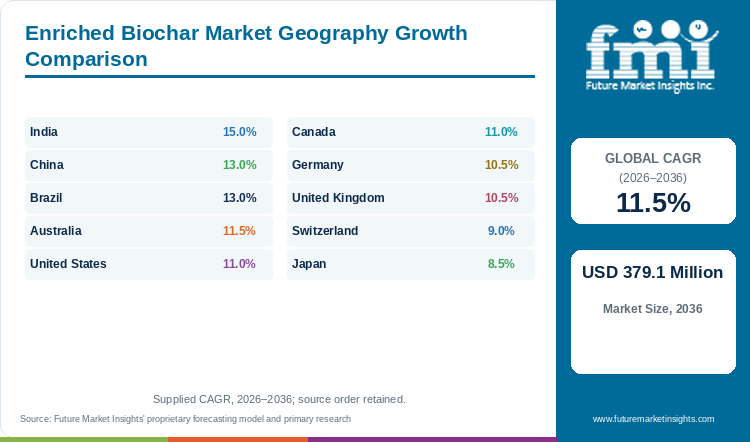
| Country | CAGR, 2026 to 2036 |
|---|---|
| India | 15.0% |
| China | 13.0% |
| Brazil | 13.0% |
| Australia | 11.5% |
| United States | 11.0% |
| Canada | 11.0% |
| Germany | 10.5% |
| United Kingdom | 10.5% |
| Switzerland | 9.0% |
| Japan | 8.5% |
Source: Future Market Insights analysis of the enriched biochar market, 2026.
United States
The United States is the largest market, with revenue projected to rise from USD 33.2 million in 2026 to USD 94.2 million by 2036, a CAGR of 11.0%. Its share of global revenue is expected to slip from 26.0% to 24.8%.
American demand comes from two very different buyers. Garden retail chains and home gardeners purchase bagged biochar blends for raised beds, containers and lawns, and national retailers now stock several enriched products. Farms, orchards and ranches use larger volumes for soil improvement, often through projects funded by carbon removal buyers that pay for production and application. The country has abundant wood residues from forest management and wildfire prevention, and large volumes of crop residues in the Corn Belt and Texas, which keeps feedstock costs low. Federal and state soil health programs also cost-share some biochar use on farms. Growth is held back by price, since bulk enriched char still costs much more than compost, and by uneven product quality among small producers. Upside is likely to come from mobile pyrolysis units that process residues in the field, from long-term credit offtake agreements with technology companies and from wider use in turf and urban tree planting.
Carbon finance is now supporting farm-scale production. Citi closed a USD 72 million note in October 2026 to finance Applied Carbon's biochar project in Texas, which converts crop residues into biochar in the field with mobile pyrolysis units.
China
China is projected to grow at 13.0% a year, from USD 17.9 million in 2026 to USD 60.6 million by 2036, raising its share of global revenue from 14.0% to 16.0%.
Chinese demand rests on crop straw. The country produces hundreds of millions of tonnes of straw each year, and authorities have long restricted open burning, which gives producers a low-cost feedstock and a policy reason to turn it into biochar. Biochar-based fertilizers, in which char is blended with mineral or organic nutrients, are sold to grain, vegetable and fruit growers through fertilizer dealers and cooperatives. Research institutions and provincial programs have run field trials for more than a decade, which gives Chinese farmers more local evidence than growers in most other countries. Cost remains the barrier for smallholders, who spend carefully on inputs and expect a return within one season. Growth is likely to come from large grain farms and cooperatives in the north and northeast, from horticulture in coastal provinces and from carbon credit projects that can now be certified under international standards. Domestic carbon market rules that recognize biochar would add further support.
Research points to both the benefit and the barrier. The Chinese Academy of Sciences estimated that yield gains and lower emissions could cover about 81% of biochar purchase costs, and called for large demonstration trials in regions such as the North China Plain.
Germany
Germany is the largest market in Europe, with revenue projected to rise from USD 10.2 million in 2026 to USD 27.7 million by 2036, a CAGR of 10.5%. Its share of global revenue is expected to fall from 8.0% to 7.3%.
German demand comes from organic and regenerative farms, horticulture, urban tree planting and livestock feed and bedding. The country has a long-established group of pyrolysis producers that certify their char under European standards, and some municipalities use biochar in tree pits and stormwater systems. Fertilizer law limits which materials can be applied to farmland, so producers focus on certified, low-contaminant woody and plant feedstocks. Growth is held back by price, since German farmers pay high prices for certified char and field trials in temperate soils often show soil benefits before yield gains. European carbon removal rules are the main upside. A common certification framework gives buyers more confidence in biochar credits, and utilities are signing long-term heat contracts that make new pyrolysis plants easier to finance. Demand is likely to grow strongly in horticulture and urban greening, where buyers value water retention and certified quality.
European certification is now in place. The European Commission adopted the EU's first certification methods for permanent carbon removals in February 2026, covering biochar along with direct air capture and bioenergy with carbon capture.
Australia
Australia is projected to grow at 11.5% a year, from USD 7.7 million in 2026 to USD 22.7 million by 2036, with its share of global revenue holding at 6.0%.
Australian demand comes from grain growers, dairy and beef producers, horticulture and land rehabilitation. Many Australian soils are sandy, acidic or low in organic matter, and droughts are frequent, which makes biochar's ability to hold water and nutrients valuable. Livestock producers are also testing biochar in feed and bedding to improve feed efficiency and manure handling, and some combine those uses with application to pasture. Feedstock is widely available from crop stubble, forestry residues and agricultural processing. Growth is held back by the absence of biochar in the national carbon credit scheme, which limits credit income for producers, and by the cost of transporting char across large distances. Industry groups are pressing for financial incentives similar to those in the United States and Europe. Upside is likely to come from cooperative and mobile production models that turn farm residues into char on site, and from livestock uses where the economic return is easier to measure.
Farm trials point to clear returns in some uses. A South Australian dairy trial found that feeding 150 grams of biochar per cow per day improved net annual profit by about AUD 72,000 (about USD 47,000) through higher milk yield and better feed conversion.
Canada
Canada is projected to grow at 11.0% a year, from USD 6.4 million in 2026 to USD 18.1 million by 2036, while its share of global revenue slips from 5.0% to 4.8%.
Canadian demand comes from Prairie grain and pulse farms, horticulture in Ontario and British Columbia, and land reclamation at mine and oil sands sites. The country has large volumes of wood residues from sawmills and wildfire-damaged forests and of straw from grain farms, which gives producers ample feedstock. Researchers are testing biochar against soil problems that matter to Prairie growers, including root disease in pulse crops and poor water holding in light soils. Federal policy is the main support. Investment tax credits for carbon capture and removal, and corporate buyers based in Canada, are drawing carbon removal companies to set up operations, and some of the char they produce is likely to reach farmland. Growth is held back by short growing seasons, which slow field trials, and by the cost of moving bulky char long distances. Upside is likely to come from links with the carbon capture and storage market and from land reclamation contracts.
Corporate buyers are pulling carbon removal capacity into the country. Charm Industrial agreed in January 2026 to supply TD Bank with 44,000 tonnes of biochar and bio-oil removal credits over 10 years, expanding its operations to Canada.
A full deep-dive analysis of 40+ countries is available in the full report.
Who are the notable companies in the Enriched Biochar Market?
Notable companies in the Enriched Biochar Market include Wakefield BioChar, Carbon Gold, Pacific Biochar, Novocarbo, Black Owl Biochar, Biochar Now and Carbofex.
The market is fragmented among regional producers, each tied to a local feedstock and customer base. Retail-focused companies such as Wakefield BioChar and Carbon Gold sell bagged, pre-charged blends through garden centers, online stores and horticulture distributors, and compete on brand, consistency and nutrient formulation. Producers such as Pacific Biochar, Black Owl Biochar and Biochar Now sell bulk char to farms, compost makers and landscapers, and increasingly earn part of their income from carbon removal credits. European producers such as Novocarbo and Carbofex operate pyrolysis plants that also sell heat, which gives them a second revenue stream and helps them finance new sites. Carbon removal developers that are not traditional soil product companies, such as Varaha, Applied Carbon and Charm Industrial, are adding large volumes of char through credit-funded projects, and much of that char goes back to farmland. Certification, feedstock security and long-term credit offtake are becoming the main points of difference.
European producers are tying new plants to heat contracts. Novocarbo signed a 15-year agreement with Stadtwerke Dessau in April 2026 for a Carbon Removal Park that is planned to start operating no later than January 2028.
Key Developments in the Enriched Biochar Market
- In January 2026, Varaha signed an offtake agreement with Microsoft for biochar carbon removal from cotton stalks in Maharashtra, India.
- In February 2026, the European Commission adopted the EU's first certification methods for permanent carbon removals, including biochar.
- In April 2026, Novocarbo and Stadtwerke Dessau agreed to build a Carbon Removal Park in Dessau, Germany, supplying heat to the local network for 15 years.
- In June 2026, Jain Irrigation commissioned a biochar facility in Jalgaon, India, with an annual processing capacity of about 20,000 tonnes.
- In October 2026, Citi closed a USD 72 million carbon removal-linked note to finance Applied Carbon's biochar project in Texas.
- In November 2026, Gold Standard published its first biochar removal methodology, with three monitoring tracks by production scale.
Key Players in the Enriched Biochar Market
- Wakefield BioChar
- Carbon Gold
- Pacific Biochar
- Novocarbo
- Black Owl Biochar
- Biochar Now
- Carbofex
Enriched Biochar Market Report Scope
Table 3: Enriched Biochar Market Report Scope
| Coverage field | Report scope |
|---|---|
| Market definition | Biochar that is charged or blended with nutrients, compost, manure, minerals or beneficial microbes before sale, supplied as a ready-to-use soil amendment, growing media ingredient, fertilizer carrier or animal bedding and feed additive. |
| Enrichment types | Compost and organic matter blends, mineral nutrient charged biochar, microbial inoculated biochar, manure and digestate co-processed biochar, and other enriched products. |
| Feedstocks | Woody biomass, crop residues, animal manure, sewage sludge and other wastes, and other feedstocks. |
| Applications | Field crop agriculture, horticulture and greenhouse growing media, home gardening, turf, landscaping and urban trees, livestock feed and bedding, and land reclamation. |
| Forms | Granular, pelletized, powder and fines, and liquid suspensions. |
| Sales channels | Agricultural distributors and cooperatives, direct sales to farms and growers, garden centers and retail, and online sales. |
| Exclusions | Raw biochar sold without enrichment, biochar used in construction materials, filtration or energy, and carbon removal credits sold separately from the product. |
| Quantitative units | USD million for value, tonnes for volume. |
| Value basis | Producer selling prices of enriched product across all channels, counted in the country where the product is used. |
| Volume basis | Tonnes of enriched biochar product sold. |
| Forecast period | 2026 to 2036, with 2025 as the base year. |
| Regions covered | North America, Latin America, Europe, East Asia, South Asia and Pacific, and Middle East and Africa. |
| National coverage | United States, China, Germany, Australia, Canada, United Kingdom, India, Japan, Brazil and Switzerland. |
| Companies covered | Wakefield BioChar, Carbon Gold, Pacific Biochar, Novocarbo, Black Owl Biochar, Biochar Now and Carbofex. |
| Price reference | Average selling price of about USD 880 per tonne in 2026. |
Source: Future Market Insights analysis of the enriched biochar market, 2026.
Enriched Biochar Market Research Methodology
FMI sizes the market from the volume of enriched biochar products sold and the price paid at producer level, and checks the result against pyrolysis capacity, carbon removal project registries, company statements and trade data for the main producing and consuming countries. Country revenue is counted where the product is used, and segment and country figures sum to the market total in every year. Enrichment, feedstock and application splits reflect each segment's share of tonnes and its price relative to standard compost-blended char. Forecasts reflect expected changes in carbon removal demand, certification rules, feedstock costs and farm adoption, and they are estimates subject to a margin of error.
Enriched Biochar Market by Segments
Enriched Biochar Market segmented by Enrichment Type:
- Compost and Organic Matter Blends
- Mineral Nutrient Charged Biochar
- Microbial Inoculated Biochar
- Manure and Digestate Co-Processed Biochar
- Other Enriched Products
Enriched Biochar Market segmented by Feedstock:
- Woody Biomass
- Crop Residues
- Animal Manure
- Sewage Sludge and Other Wastes
- Other Feedstocks
Enriched Biochar Market segmented by Application:
- Field Crop Agriculture
- Horticulture and Greenhouse Growing Media
- Home Gardening
- Turf, Landscaping and Urban Trees
- Livestock Feed and Bedding
- Land Reclamation
Enriched Biochar Market segmented by Form:
- Granular
- Pelletized
- Powder and Fines
- Liquid Suspensions
Enriched Biochar Market segmented by Sales Channel:
- Agricultural Distributors and Cooperatives
- Direct Sales to Farms and Growers
- Garden Centers and Retail
- Online Sales
Enriched Biochar Market by Region
- North America
- Latin America
- Europe
- East Asia
- South Asia and Pacific
- Middle East and Africa
Research Sources and Bibliography
- Nuffield Australia. (2026, April 15). From paddock waste to carbon credits: SA farmer investigates biochar's potential for Australian agriculture. www.nuffield.com.au
- Carbon Herald. (2026, April 17). Novocarbo and Stadtwerke Dessau sign new biochar and renewable heat partnership. https://carbonherald.com/novocarbo-and-stadtwerke-dessau-sign-new-biochar-and-renewable-heat-partnership/
- Chinese Academy of Sciences. (2025, August 18). Long-term biochar use found to sustainably boost crop yields and cut greenhouse gas emissions. english.cas.cn
- AgFunderNews. (2026, January 15). Varaha signs major offtake agreement with Microsoft for biochar carbon removal in India. https://agfundernews.com/varaha-signs-major-offtake-agreement-with-microsoft-for-biochar-carbon-removal-in-india
- Kohl, L., Minarsch, E. M. L., Niether, W., et al. (2026, February 26). Early evidence for the benefits of biochar in organic regenerative agriculture. Scientific Reports. www.nature.com
- Carbon Herald. (2026, April 11). Microsoft pauses all carbon removal purchases. https://carbonherald.com/microsoft-pauses-all-carbon-removal-purchases/
- ESG News. (2026, November 6). Gold Standard sets 200-year storage test and three monitoring tracks for biochar credits. https://esgnews.com/gold-standard-biochar-methodology-parc/
- ESG News. (2026, October 21). Citi closes $72 million carbon removal-linked note for Texas biochar project. https://esgnews.com/citi-carbon-removal-note-biochar/
- European Commission. (2026, February 3). EU sets world's first voluntary standard for permanent carbon removals. climate.ec.europa.eu
- ESG Dive. (2026, January 23). Charm Industrial inks CO2 removal deal with TD Bank. https://www.esgdive.com/news/charm-industrial-inks-bio-oil-biochar-co2-removal-deal-td-bank-canada-expansion/810355/
- Global Agriculture. (2026, June 3). Jain Irrigation launches 20,000-tonne biochar facility in India. https://www.global-agriculture.com/agriculture-industry/jain-irrigation-launches-20000-tonne-biochar-facility-in-india/
Table of Content
- Key Takeaways
- Market Size and CAGR
- Top Growth Driver
- Fastest Growing Segment
- Leading Region
- Key Companies
- Emerging Opportunities
- Executive Summary
- Global Market Outlook
- Demand-side Trends
- Supply-side Trends
- Technology Roadmap Analysis
- Analysis and Recommendations
- Analyst Perspective (What is happening? Why now? What should investors know?)
- Key Questions Answered
- How large is the market?
- What is the CAGR?
- What are key trends?
- Which region dominates?
- Who are the leaders?
Read More...
- Market Overview
- Market Coverage / Taxonomy
- Market Definition / Scope / Limitations
- Research Methodology
- Chapter Orientation
- Analytical Lens and Working Hypotheses
- Market Structure, Signals, and Trend Drivers
- Benchmarking and Cross-market Comparability
- Market Sizing, Forecasting, and Opportunity Mapping
- Research Design and Evidence Framework
- Desk Research Programme (Secondary Evidence)
- Expert Input and Fieldwork (Primary Evidence)
- Tooling, Models, and Reference Databases
- Data Engineering and Model Build
- Quality Assurance and Audit Trail
- Market Background
- Market Dynamics (Drivers, Restraints, Opportunity, Trends)
- Scenario Forecast (Optimistic, Likely, Conservative)
- Impact Analysis
- AI Impact
- Sustainability Impact
- Regulatory Impact
- Technology Impact
- Consumer / Buyer Analysis
- Purchase Drivers
- Adoption Barriers
- Buyer Journey
- Opportunity Map Analysis
- Product Life Cycle Analysis
- Supply Chain Analysis
- Investment Feasibility Matrix
- Value Chain Analysis
- PESTLE and Porter's Analysis
- Regulatory Landscape
- Regional Parent Market Outlook
- Production and Consumption Statistics
- Import and Export Statistics
- Global Market Analysis and Forecast, 2021 to 2036
- Historical Market Size Value (USD Million) Analysis, 2021 to 2025
- Current and Future Market Size Value (USD Million) Projections, 2026 to 2036
- Y-o-Y Growth Trend Analysis
- Absolute $ Opportunity Analysis
- Global Market Pricing Analysis, 2021 to 2036
- Global Market Analysis and Forecast, By Enrichment Type, 2021 to 2036
- Introduction / Key Findings
- Historical Market Size Value (USD Million) Analysis By Enrichment Type, 2021 to 2025
- Current and Future Market Size Value (USD Million) Analysis and Forecast By Enrichment Type, 2026 to 2036
- Compost and Organic Matter Blends
- Mineral Nutrient Charged Biochar
- Microbial Inoculated Biochar
- Manure and Digestate Co-Processed Biochar
- Other Enriched Products
- Y-o-Y Growth Trend Analysis By Enrichment Type, 2021 to 2025
- Absolute $ Opportunity Analysis By Enrichment Type, 2026 to 2036
- Global Market Analysis and Forecast, By Feedstock, 2021 to 2036
- Introduction / Key Findings
- Historical Market Size Value (USD Million) Analysis By Feedstock, 2021 to 2025
- Current and Future Market Size Value (USD Million) Analysis and Forecast By Feedstock, 2026 to 2036
- Woody Biomass
- Crop Residues
- Animal Manure
- Sewage Sludge and Other Wastes
- Other Feedstocks
- Y-o-Y Growth Trend Analysis By Feedstock, 2021 to 2025
- Absolute $ Opportunity Analysis By Feedstock, 2026 to 2036
- Global Market Analysis and Forecast, By Application, 2021 to 2036
- Introduction / Key Findings
- Historical Market Size Value (USD Million) Analysis By Application, 2021 to 2025
- Current and Future Market Size Value (USD Million) Analysis and Forecast By Application, 2026 to 2036
- Field Crop Agriculture
- Horticulture and Greenhouse Growing Media
- Home Gardening
- Turf, Landscaping and Urban Trees
- Livestock Feed and Bedding
- Land Reclamation
- Y-o-Y Growth Trend Analysis By Application, 2021 to 2025
- Absolute $ Opportunity Analysis By Application, 2026 to 2036
- Global Market Analysis and Forecast, By Form, 2021 to 2036
- Introduction / Key Findings
- Historical Market Size Value (USD Million) Analysis By Form, 2021 to 2025
- Current and Future Market Size Value (USD Million) Analysis and Forecast By Form, 2026 to 2036
- Granular
- Pelletized
- Powder and Fines
- Liquid Suspensions
- Y-o-Y Growth Trend Analysis By Form, 2021 to 2025
- Absolute $ Opportunity Analysis By Form, 2026 to 2036
- Global Market Analysis and Forecast, By Sales Channel, 2021 to 2036
- Introduction / Key Findings
- Historical Market Size Value (USD Million) Analysis By Sales Channel, 2021 to 2025
- Current and Future Market Size Value (USD Million) Analysis and Forecast By Sales Channel, 2026 to 2036
- Agricultural Distributors and Cooperatives
- Direct Sales to Farms and Growers
- Garden Centers and Retail
- Online Sales
- Y-o-Y Growth Trend Analysis By Sales Channel, 2021 to 2025
- Absolute $ Opportunity Analysis By Sales Channel, 2026 to 2036
- Global Market Analysis and Forecast, By Region, 2021 to 2036
- Introduction
- Historical Market Size Value (USD Million) Analysis By Region, 2021 to 2025
- Current Market Size Value (USD Million) Analysis and Forecast By Region, 2026 to 2036
- North America
- Latin America
- Europe
- East Asia
- South Asia and Pacific
- Middle East and Africa
- Market Attractiveness Analysis By Region
- North America Market Analysis and Forecast, By Country, 2021 to 2036
- Historical Market Size Value (USD Million) Trend Analysis By Market Taxonomy, 2021 to 2025
- Market Size Value (USD Million) Forecast By Market Taxonomy, 2026 to 2036
- By Country
- By Enrichment Type
- By Feedstock
- By Application
- By Form
- By Sales Channel
- Market Attractiveness Analysis
- By Country
- By Enrichment Type
- By Feedstock
- By Application
- By Form
- By Sales Channel
- Key Takeaways
- Latin America Market Analysis and Forecast, By Country
- Historical Market Size Value (USD Million) Trend Analysis By Market Taxonomy, 2021 to 2025
- Market Size Value (USD Million) Forecast By Market Taxonomy, 2026 to 2036
- By Country
- By Enrichment Type
- By Feedstock
- By Application
- By Form
- By Sales Channel
- Market Attractiveness Analysis
- By Country
- By Enrichment Type
- By Feedstock
- By Application
- By Form
- By Sales Channel
- Key Takeaways
- Europe Market Analysis and Forecast, By Country
- Historical Market Size Value (USD Million) Trend Analysis By Market Taxonomy, 2021 to 2025
- Market Size Value (USD Million) Forecast By Market Taxonomy, 2026 to 2036
- By Country
- By Enrichment Type
- By Feedstock
- By Application
- By Form
- By Sales Channel
- Market Attractiveness Analysis
- By Country
- By Enrichment Type
- By Feedstock
- By Application
- By Form
- By Sales Channel
- Key Takeaways
- East Asia Market Analysis and Forecast, By Country
- Historical Market Size Value (USD Million) Trend Analysis By Market Taxonomy, 2021 to 2025
- Market Size Value (USD Million) Forecast By Market Taxonomy, 2026 to 2036
- By Country
- By Enrichment Type
- By Feedstock
- By Application
- By Form
- By Sales Channel
- Market Attractiveness Analysis
- By Country
- By Enrichment Type
- By Feedstock
- By Application
- By Form
- By Sales Channel
- Key Takeaways
- South Asia and Pacific Market Analysis and Forecast, By Country
- Historical Market Size Value (USD Million) Trend Analysis By Market Taxonomy, 2021 to 2025
- Market Size Value (USD Million) Forecast By Market Taxonomy, 2026 to 2036
- By Country
- By Enrichment Type
- By Feedstock
- By Application
- By Form
- By Sales Channel
- Market Attractiveness Analysis
- By Country
- By Enrichment Type
- By Feedstock
- By Application
- By Form
- By Sales Channel
- Key Takeaways
- Middle East and Africa Market Analysis and Forecast, By Country
- Historical Market Size Value (USD Million) Trend Analysis By Market Taxonomy, 2021 to 2025
- Market Size Value (USD Million) Forecast By Market Taxonomy, 2026 to 2036
- By Country
- By Enrichment Type
- By Feedstock
- By Application
- By Form
- By Sales Channel
- Market Attractiveness Analysis
- By Country
- By Enrichment Type
- By Feedstock
- By Application
- By Form
- By Sales Channel
- Key Takeaways
- Key Countries Market Analysis
- India
- Pricing Analysis
- Market Share Analysis, 2025
- By Enrichment Type
- By Feedstock
- By Application
- By Form
- By Sales Channel
- China
- Pricing Analysis
- Market Share Analysis, 2025
- By Enrichment Type
- By Feedstock
- By Application
- By Form
- By Sales Channel
- Brazil
- Pricing Analysis
- Market Share Analysis, 2025
- By Enrichment Type
- By Feedstock
- By Application
- By Form
- By Sales Channel
- Australia
- Pricing Analysis
- Market Share Analysis, 2025
- By Enrichment Type
- By Feedstock
- By Application
- By Form
- By Sales Channel
- United States
- Pricing Analysis
- Market Share Analysis, 2025
- By Enrichment Type
- By Feedstock
- By Application
- By Form
- By Sales Channel
- Canada
- Pricing Analysis
- Market Share Analysis, 2025
- By Enrichment Type
- By Feedstock
- By Application
- By Form
- By Sales Channel
- Germany
- Pricing Analysis
- Market Share Analysis, 2025
- By Enrichment Type
- By Feedstock
- By Application
- By Form
- By Sales Channel
- United Kingdom
- Pricing Analysis
- Market Share Analysis, 2025
- By Enrichment Type
- By Feedstock
- By Application
- By Form
- By Sales Channel
- Switzerland
- Pricing Analysis
- Market Share Analysis, 2025
- By Enrichment Type
- By Feedstock
- By Application
- By Form
- By Sales Channel
- Japan
- Pricing Analysis
- Market Share Analysis, 2025
- By Enrichment Type
- By Feedstock
- By Application
- By Form
- By Sales Channel
- India
- Market Structure Analysis
- Competition Dashboard
- Competition Benchmarking
- Market Share Analysis of Top Players
- By Regional
- By Enrichment Type
- By Feedstock
- By Application
- By Form
- By Sales Channel
- Emerging Startups
- Innovation Benchmarking
- Competition Analysis
- Competition Deep Dive
- Novocarbo
- Overview
- Product Portfolio
- Profitability by Market Segments
- Sales Footprint
- Strategy Overview
- Marketing Strategy
- Product Strategy
- Channel Strategy
- Varaha
- Applied Carbon
- Wakefield BioChar
- Carbon Gold
- Pacific Biochar
- Black Owl Biochar
- Biochar Now
- Carbofex
- Novocarbo
- Case Studies
- Success Stories
- Recent Developments
- Competition Deep Dive
- Assumptions & Acronyms Used
List of Tables
- Table 1: Global Market Value (USD Million) Forecast by Region, 2021 to 2036
- Table 2: Global Market Value (USD Million) Forecast by Enrichment Type, 2021 to 2036
- Table 3: Global Market Value (USD Million) Forecast by Feedstock, 2021 to 2036
- Table 4: Global Market Value (USD Million) Forecast by Application, 2021 to 2036
- Table 5: Global Market Value (USD Million) Forecast by Form, 2021 to 2036
- Table 6: Global Market Value (USD Million) Forecast by Sales Channel, 2021 to 2036
- Table 7: North America Market Value (USD Million) Forecast by Country, 2021 to 2036
- Table 8: North America Market Value (USD Million) Forecast by Enrichment Type, 2021 to 2036
- Table 9: North America Market Value (USD Million) Forecast by Feedstock, 2021 to 2036
- Table 10: North America Market Value (USD Million) Forecast by Application, 2021 to 2036
- Table 11: North America Market Value (USD Million) Forecast by Form, 2021 to 2036
- Table 12: North America Market Value (USD Million) Forecast by Sales Channel, 2021 to 2036
- Table 13: Latin America Market Value (USD Million) Forecast by Country, 2021 to 2036
- Table 14: Latin America Market Value (USD Million) Forecast by Enrichment Type, 2021 to 2036
- Table 15: Latin America Market Value (USD Million) Forecast by Feedstock, 2021 to 2036
- Table 16: Latin America Market Value (USD Million) Forecast by Application, 2021 to 2036
- Table 17: Latin America Market Value (USD Million) Forecast by Form, 2021 to 2036
- Table 18: Latin America Market Value (USD Million) Forecast by Sales Channel, 2021 to 2036
- Table 19: Europe Market Value (USD Million) Forecast by Country, 2021 to 2036
- Table 20: Europe Market Value (USD Million) Forecast by Enrichment Type, 2021 to 2036
- Table 21: Europe Market Value (USD Million) Forecast by Feedstock, 2021 to 2036
- Table 22: Europe Market Value (USD Million) Forecast by Application, 2021 to 2036
- Table 23: Europe Market Value (USD Million) Forecast by Form, 2021 to 2036
- Table 24: Europe Market Value (USD Million) Forecast by Sales Channel, 2021 to 2036
- Table 25: East Asia Market Value (USD Million) Forecast by Country, 2021 to 2036
- Table 26: East Asia Market Value (USD Million) Forecast by Enrichment Type, 2021 to 2036
- Table 27: East Asia Market Value (USD Million) Forecast by Feedstock, 2021 to 2036
- Table 28: East Asia Market Value (USD Million) Forecast by Application, 2021 to 2036
- Table 29: East Asia Market Value (USD Million) Forecast by Form, 2021 to 2036
- Table 30: East Asia Market Value (USD Million) Forecast by Sales Channel, 2021 to 2036
- Table 31: South Asia and Pacific Market Value (USD Million) Forecast by Country, 2021 to 2036
- Table 32: South Asia and Pacific Market Value (USD Million) Forecast by Enrichment Type, 2021 to 2036
- Table 33: South Asia and Pacific Market Value (USD Million) Forecast by Feedstock, 2021 to 2036
- Table 34: South Asia and Pacific Market Value (USD Million) Forecast by Application, 2021 to 2036
- Table 35: South Asia and Pacific Market Value (USD Million) Forecast by Form, 2021 to 2036
- Table 36: South Asia and Pacific Market Value (USD Million) Forecast by Sales Channel, 2021 to 2036
- Table 37: Middle East and Africa Market Value (USD Million) Forecast by Country, 2021 to 2036
- Table 38: Middle East and Africa Market Value (USD Million) Forecast by Enrichment Type, 2021 to 2036
- Table 39: Middle East and Africa Market Value (USD Million) Forecast by Feedstock, 2021 to 2036
- Table 40: Middle East and Africa Market Value (USD Million) Forecast by Application, 2021 to 2036
- Table 41: Middle East and Africa Market Value (USD Million) Forecast by Form, 2021 to 2036
- Table 42: Middle East and Africa Market Value (USD Million) Forecast by Sales Channel, 2021 to 2036
List of Figures
- Figure 1: Global Market Pricing Analysis
- Figure 2: Global Market Value (USD Million) Forecast 2021-2036
- Figure 3: Global Market Value Share and BPS Analysis by Enrichment Type, 2026 and 2036
- Figure 4: Global Market Y-o-Y Growth Comparison by Enrichment Type, 2026-2036
- Figure 5: Global Market Attractiveness Analysis by Enrichment Type
- Figure 6: Global Market Value Share and BPS Analysis by Feedstock, 2026 and 2036
- Figure 7: Global Market Y-o-Y Growth Comparison by Feedstock, 2026-2036
- Figure 8: Global Market Attractiveness Analysis by Feedstock
- Figure 9: Global Market Value Share and BPS Analysis by Application, 2026 and 2036
- Figure 10: Global Market Y-o-Y Growth Comparison by Application, 2026-2036
- Figure 11: Global Market Attractiveness Analysis by Application
- Figure 12: Global Market Value Share and BPS Analysis by Form, 2026 and 2036
- Figure 13: Global Market Y-o-Y Growth Comparison by Form, 2026-2036
- Figure 14: Global Market Attractiveness Analysis by Form
- Figure 15: Global Market Value Share and BPS Analysis by Sales Channel, 2026 and 2036
- Figure 16: Global Market Y-o-Y Growth Comparison by Sales Channel, 2026-2036
- Figure 17: Global Market Attractiveness Analysis by Sales Channel
- Figure 18: Global Market Value (USD Million) Share and BPS Analysis by Region, 2026 and 2036
- Figure 19: Global Market Y-o-Y Growth Comparison by Region, 2026-2036
- Figure 20: Global Market Attractiveness Analysis by Region
- Figure 21: North America Market Incremental Dollar Opportunity, 2026-2036
- Figure 22: Latin America Market Incremental Dollar Opportunity, 2026-2036
- Figure 23: Europe Market Incremental Dollar Opportunity, 2026-2036
- Figure 24: East Asia Market Incremental Dollar Opportunity, 2026-2036
- Figure 25: South Asia and Pacific Market Incremental Dollar Opportunity, 2026-2036
- Figure 26: Middle East and Africa Market Incremental Dollar Opportunity, 2026-2036
- Figure 27: North America Market Value Share and BPS Analysis by Country, 2026 and 2036
- Figure 28: North America Market Value Share and BPS Analysis by Enrichment Type, 2026 and 2036
- Figure 29: North America Market Y-o-Y Growth Comparison by Enrichment Type, 2026-2036
- Figure 30: North America Market Attractiveness Analysis by Enrichment Type
- Figure 31: North America Market Value Share and BPS Analysis by Feedstock, 2026 and 2036
- Figure 32: North America Market Y-o-Y Growth Comparison by Feedstock, 2026-2036
- Figure 33: North America Market Attractiveness Analysis by Feedstock
- Figure 34: North America Market Value Share and BPS Analysis by Application, 2026 and 2036
- Figure 35: North America Market Y-o-Y Growth Comparison by Application, 2026-2036
- Figure 36: North America Market Attractiveness Analysis by Application
- Figure 37: North America Market Value Share and BPS Analysis by Form, 2026 and 2036
- Figure 38: North America Market Y-o-Y Growth Comparison by Form, 2026-2036
- Figure 39: North America Market Attractiveness Analysis by Form
- Figure 40: North America Market Value Share and BPS Analysis by Sales Channel, 2026 and 2036
- Figure 41: North America Market Y-o-Y Growth Comparison by Sales Channel, 2026-2036
- Figure 42: North America Market Attractiveness Analysis by Sales Channel
- Figure 43: Latin America Market Value Share and BPS Analysis by Country, 2026 and 2036
- Figure 44: Latin America Market Value Share and BPS Analysis by Enrichment Type, 2026 and 2036
- Figure 45: Latin America Market Y-o-Y Growth Comparison by Enrichment Type, 2026-2036
- Figure 46: Latin America Market Attractiveness Analysis by Enrichment Type
- Figure 47: Latin America Market Value Share and BPS Analysis by Feedstock, 2026 and 2036
- Figure 48: Latin America Market Y-o-Y Growth Comparison by Feedstock, 2026-2036
- Figure 49: Latin America Market Attractiveness Analysis by Feedstock
- Figure 50: Latin America Market Value Share and BPS Analysis by Application, 2026 and 2036
- Figure 51: Latin America Market Y-o-Y Growth Comparison by Application, 2026-2036
- Figure 52: Latin America Market Attractiveness Analysis by Application
- Figure 53: Latin America Market Value Share and BPS Analysis by Form, 2026 and 2036
- Figure 54: Latin America Market Y-o-Y Growth Comparison by Form, 2026-2036
- Figure 55: Latin America Market Attractiveness Analysis by Form
- Figure 56: Latin America Market Value Share and BPS Analysis by Sales Channel, 2026 and 2036
- Figure 57: Latin America Market Y-o-Y Growth Comparison by Sales Channel, 2026-2036
- Figure 58: Latin America Market Attractiveness Analysis by Sales Channel
- Figure 59: Europe Market Value Share and BPS Analysis by Country, 2026 and 2036
- Figure 60: Europe Market Value Share and BPS Analysis by Enrichment Type, 2026 and 2036
- Figure 61: Europe Market Y-o-Y Growth Comparison by Enrichment Type, 2026-2036
- Figure 62: Europe Market Attractiveness Analysis by Enrichment Type
- Figure 63: Europe Market Value Share and BPS Analysis by Feedstock, 2026 and 2036
- Figure 64: Europe Market Y-o-Y Growth Comparison by Feedstock, 2026-2036
- Figure 65: Europe Market Attractiveness Analysis by Feedstock
- Figure 66: Europe Market Value Share and BPS Analysis by Application, 2026 and 2036
- Figure 67: Europe Market Y-o-Y Growth Comparison by Application, 2026-2036
- Figure 68: Europe Market Attractiveness Analysis by Application
- Figure 69: Europe Market Value Share and BPS Analysis by Form, 2026 and 2036
- Figure 70: Europe Market Y-o-Y Growth Comparison by Form, 2026-2036
- Figure 71: Europe Market Attractiveness Analysis by Form
- Figure 72: Europe Market Value Share and BPS Analysis by Sales Channel, 2026 and 2036
- Figure 73: Europe Market Y-o-Y Growth Comparison by Sales Channel, 2026-2036
- Figure 74: Europe Market Attractiveness Analysis by Sales Channel
- Figure 75: East Asia Market Value Share and BPS Analysis by Country, 2026 and 2036
- Figure 76: East Asia Market Value Share and BPS Analysis by Enrichment Type, 2026 and 2036
- Figure 77: East Asia Market Y-o-Y Growth Comparison by Enrichment Type, 2026-2036
- Figure 78: East Asia Market Attractiveness Analysis by Enrichment Type
- Figure 79: East Asia Market Value Share and BPS Analysis by Feedstock, 2026 and 2036
- Figure 80: East Asia Market Y-o-Y Growth Comparison by Feedstock, 2026-2036
- Figure 81: East Asia Market Attractiveness Analysis by Feedstock
- Figure 82: East Asia Market Value Share and BPS Analysis by Application, 2026 and 2036
- Figure 83: East Asia Market Y-o-Y Growth Comparison by Application, 2026-2036
- Figure 84: East Asia Market Attractiveness Analysis by Application
- Figure 85: East Asia Market Value Share and BPS Analysis by Form, 2026 and 2036
- Figure 86: East Asia Market Y-o-Y Growth Comparison by Form, 2026-2036
- Figure 87: East Asia Market Attractiveness Analysis by Form
- Figure 88: East Asia Market Value Share and BPS Analysis by Sales Channel, 2026 and 2036
- Figure 89: East Asia Market Y-o-Y Growth Comparison by Sales Channel, 2026-2036
- Figure 90: East Asia Market Attractiveness Analysis by Sales Channel
- Figure 91: South Asia and Pacific Market Value Share and BPS Analysis by Country, 2026 and 2036
- Figure 92: South Asia and Pacific Market Value Share and BPS Analysis by Enrichment Type, 2026 and 2036
- Figure 93: South Asia and Pacific Market Y-o-Y Growth Comparison by Enrichment Type, 2026-2036
- Figure 94: South Asia and Pacific Market Attractiveness Analysis by Enrichment Type
- Figure 95: South Asia and Pacific Market Value Share and BPS Analysis by Feedstock, 2026 and 2036
- Figure 96: South Asia and Pacific Market Y-o-Y Growth Comparison by Feedstock, 2026-2036
- Figure 97: South Asia and Pacific Market Attractiveness Analysis by Feedstock
- Figure 98: South Asia and Pacific Market Value Share and BPS Analysis by Application, 2026 and 2036
- Figure 99: South Asia and Pacific Market Y-o-Y Growth Comparison by Application, 2026-2036
- Figure 100: South Asia and Pacific Market Attractiveness Analysis by Application
- Figure 101: South Asia and Pacific Market Value Share and BPS Analysis by Form, 2026 and 2036
- Figure 102: South Asia and Pacific Market Y-o-Y Growth Comparison by Form, 2026-2036
- Figure 103: South Asia and Pacific Market Attractiveness Analysis by Form
- Figure 104: South Asia and Pacific Market Value Share and BPS Analysis by Sales Channel, 2026 and 2036
- Figure 105: South Asia and Pacific Market Y-o-Y Growth Comparison by Sales Channel, 2026-2036
- Figure 106: South Asia and Pacific Market Attractiveness Analysis by Sales Channel
- Figure 107: Middle East and Africa Market Value Share and BPS Analysis by Country, 2026 and 2036
- Figure 108: Middle East and Africa Market Value Share and BPS Analysis by Enrichment Type, 2026 and 2036
- Figure 109: Middle East and Africa Market Y-o-Y Growth Comparison by Enrichment Type, 2026-2036
- Figure 110: Middle East and Africa Market Attractiveness Analysis by Enrichment Type
- Figure 111: Middle East and Africa Market Value Share and BPS Analysis by Feedstock, 2026 and 2036
- Figure 112: Middle East and Africa Market Y-o-Y Growth Comparison by Feedstock, 2026-2036
- Figure 113: Middle East and Africa Market Attractiveness Analysis by Feedstock
- Figure 114: Middle East and Africa Market Value Share and BPS Analysis by Application, 2026 and 2036
- Figure 115: Middle East and Africa Market Y-o-Y Growth Comparison by Application, 2026-2036
- Figure 116: Middle East and Africa Market Attractiveness Analysis by Application
- Figure 117: Middle East and Africa Market Value Share and BPS Analysis by Form, 2026 and 2036
- Figure 118: Middle East and Africa Market Y-o-Y Growth Comparison by Form, 2026-2036
- Figure 119: Middle East and Africa Market Attractiveness Analysis by Form
- Figure 120: Middle East and Africa Market Value Share and BPS Analysis by Sales Channel, 2026 and 2036
- Figure 121: Middle East and Africa Market Y-o-Y Growth Comparison by Sales Channel, 2026-2036
- Figure 122: Middle East and Africa Market Attractiveness Analysis by Sales Channel
- Figure 123: Global Market - Tier Structure Analysis
- Figure 124: Global Market - Company Share Analysis
Frequently Asked Questions
How big is the enriched biochar market in 2026?
The global enriched biochar market is valued at USD 127.7 million in 2026, up from USD 115.0 million in 2025.
What is the forecast for the enriched biochar market?
The market is projected to reach USD 379.1 million by 2036, growing at a CAGR of 11.5% from 2026.
Which enrichment type leads the enriched biochar market?
Compost and organic matter blends lead with 34.0% of 2026 revenue. Microbial inoculated biochar is projected to grow at 13.3% a year, above the market rate of 11.5%.
Which application uses the most enriched biochar?
Field crop agriculture is the largest application, with 38.0% of 2026 revenue, and its share is projected to rise to 41.6% by 2036.
Which country is the largest enriched biochar market?
The United States is the largest market, with 26.0% of global revenue in 2026. China follows with 14.0% and Germany with 8.0%.
Which countries are expected to grow above the global rate?
India is projected to grow at 15.0% a year, and China and Brazil at 13.0%, against 11.5% for the global market.
Why are carbon credits important to enriched biochar sales?
Credits for the carbon stored in biochar give producers a second source of income, which lets them sell the product to farmers at a lower price and fund enrichment and spreading.
What are the main risks for enriched biochar producers?
The main risks are high product cost relative to yield gains, pauses in carbon credit purchasing, uneven product quality and competition with other uses for wood and crop residues.
Preview the report firsthand - request a free sample
Get SampleGet the brochure for pricing and purchase details.
Get PDF
