Global EPE Foam Packaging Market Outlook

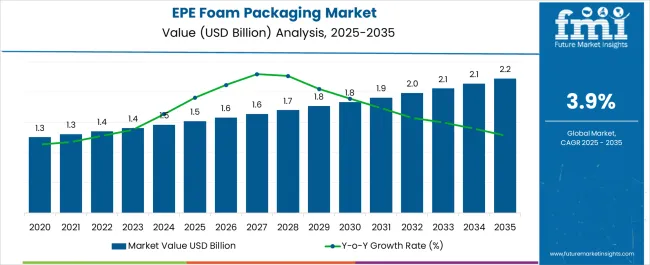
According to Future Market Insights research, during the projected period, the global EPE foam market is expected to grow at a CAGR of 4.1%. The market value is projected to increase from US$ 1.4 Bn in 2023 to US$ 2.1 Bn by 2033. The global EPE foam packaging market size is projected to be worth US$ 1.4 Bn in 2023. EPE foam packaging refers to the use of expanded polyethylene foam material as a protective packaging option for various end-user applications. EPE foam is a lightweight, durable, and flexible material that is widely used in the packaging industry due to its excellent shock-absorbing properties, thermal insulation, and water resistance. EPE foam packaging products can be found in various forms such as sheets, rolls, pouches, bags, and custom-moulded shapes to fit specific products. The EPE foam packaging market includes the production, distribution, and sales of these products for use in different industries, including electronics, automotive, healthcare, and consumer goods amongst many others. The market is driven by factors such as the growing demand for eco-friendly and sustainable packaging solutions, the increasing use of e-commerce platforms, and the need for product protection during transportation and storage.

Driving factors propelling the Demand for global EPE Foam Packaging include:

  • The automotive industry is significant market for EPE foam packaging, given the need for protective packaging during transportation of automotive parts and components. With the growth of the automotive industry globally, the demand for EPE foam packaging is expected to increase.
  • The consumer electronics industry is a another significant market for EPE foam packaging, given the need for protection against damage during transportation and storage. With the increasing demand for electronic devices globally, the EPE foam packaging market is expected to grow.
  • EPE foam is an excellent shock absorber and provides excellent protection against impacts and scratches during transportation and storage.
  • The increasing demand for eco-friendly and sustainable packaging solutions is a significant driving factor for the EPE foam packaging market. EPE foam is a recyclable and reusable material that reduces the amount of waste generated by packaging materials.

Major restraint factors holding back the EPE Foam Packaging market:

  • As consumers become increasingly concerned about the impact of packaging waste on the environment, there is growing pressure on companies to use sustainable and biodegradable packaging materials. EPE foam packaging, which is made from non-biodegradable materials, is facing increased scrutiny and is seen as a less eco-friendly option.
  • The production of EPE foam packaging requires specialized equipment and expertise, which can be expensive. Additionally, the raw materials used in the production process can also be costly, further driving up production costs.
  • EPE foam packaging faces competition from a range of alternative materials, including molded pulp packaging, paper-based packaging, and biodegradable plastics. These materials offer similar protective properties while also addressing some of the environmental concerns associated with EPE foam packaging.

Parallel growth opportunities are witnessing for market growth:

  • The construction industry is the area where the EPE foam packaging market is witnessing growth opportunities. EPE foam is increasingly being used as an insulation material in construction applications due to its excellent thermal and acoustic insulation properties.
  • The lightweight and shock-absorbing properties of EPE foam make it an ideal material for packaging automotive parts during transportation.
  • The food and beverage industry is a significant consumer of EPE foam packaging. With the increasing demand for packaged food and beverages, the EPE foam packaging market is expected to grow. The rise in online food ordering and home delivery services has further boosted the demand for EPE foam packaging in this sector.
  • EPE foam packaging offers a sustainable alternative to traditional packaging materials, such as plastic and paper.
  • EPE foam is a demanding material for protecting products during shipping, and the growth of e-commerce has led to an increase in the demand for this type of packaging material.

Latest key trends propelling in EPE Foam Packaging market:

  • EPE foam packaging is widely used in the aerospace industry to protect fragile components during transportation and handling.
  • EPE foam insulation is an effective and affordable solution for insulation applications in the construction industry. With the increasing focus on energy efficiency and sustainability, the demand for EPE foam insulation is growing.
  • Manufacturers are exploring the integration of smart technologies such as RFID tags and sensors into EPE foam packaging solutions. This enables better tracking and monitoring of products during transportation and storage.
  • The automotive aftermarket is a growing market for EPE foam packaging, with a rising demand for customized packaging solutions for replacement parts and accessories.
  • The pharmaceutical industry is another key end-user of EPE foam packaging, with a growing demand for packaging solutions that ensure the safe transportation of drugs and medical devices.
Attributes Details
EPE Foam Packaging Market Size (2023) US$ 1.4 billion
EPE Foam Packaging Market Projected Size (2033) US$ 2.1 billion
Value CAGR (2023 to 2033) 4.1%

Don't pay for what you don't need

Customize your report by selecting specific countries or regions and save 30%!

2018 to 2022 Global EPE Foam Packaging Market Demand Outlook Compared to 2023 to 2033 Forecast

From 2018 to 2022, the global EPE Foam Packaging market experienced a CAGR of 2.8%, reaching a market size of US$ 1.2 billion in 2023.

EPE foam was primarily used for packaging electronic products, but its use has since expanded to other industries, such as automotive, healthcare, and food and beverage. The increasing demand for sustainable packaging solutions has also driven the growth of the EPE foam market, as it is recyclable and can be reused multiple times.

Future Market Outlook global EPE Foam Packaging Industry

The global EPE Foam packaging market is estimated at around US$ 1.4 Bn by the year 2023, accelerating with a CAGR of 4.1% between 2023 and 2033. According to the study on the analysis of EPE Foam Packaging Market, it is expected to increase to roughly US$ 2.1 Bn by 2033.

The growing trend towards sustainable packaging materials, EPE foam packaging, which is recyclable and eco-friendly. The end-use industries of EPE foam packaging, such as electronics, automotive, and healthcare, which is likely to drive the demand for EPE foam packaging. The increasing use of EPE foam for packaging is becoming more diverse since the material can be utilised for buffers, ribs, encapsulation blocks, sticky back sheets, support pads and corner pads. It is less expensive and more durable than other materials and is widely used in the packaging of consumer electronics including as washing machine, refrigerator, televisions, laptop computers, desktop computers, and other equipment.
Ismail Sutaria
Ismail Sutaria

Principal Consultant

Talk to Analyst

Find your sweet spots for generating winning opportunities in this market.

Country-wise Insights

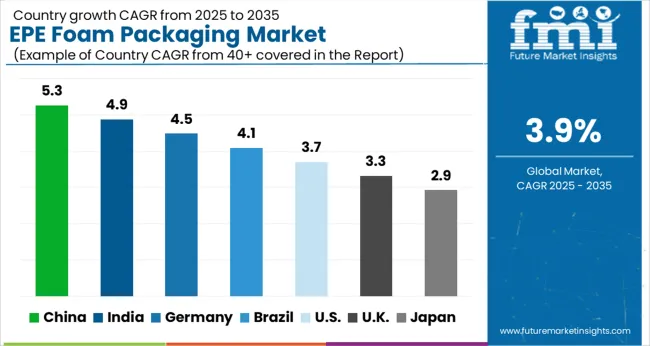
United States is account significant market share in EPE Foam Packaging market

Country The United States
Market Size (US$ million) by End of Forecast Period (2033) US$ 497.6 million
CAGR % 2023 to End of Forecast (2033) 3.6%

EPE (expanded polyethylene) foam is a versatile material that is widely used in packaging applications due to its excellent shock absorption, cushioning, and insulation properties. The demand for EPE foam packaging in the United States is driven by various factors such as the growth of e-commerce and the increasing need for safe and secure packaging for various products. EPE foam packaging is used in a wide range of industries such as electronics, healthcare, automotive, food and beverage, and consumer goods.

India owns a strong market base for EPE Foam Packaging market

Country India
Market Size (US$ million) by End of Forecast Period (2033) US$ 238.6 million
CAGR % 2023 to End of Forecast (2033) 5.6%

The packaging industry in India is expected to grow rapidly in the coming years, driven by the growth of e-commerce, the expansion of organized retail, and increased demand from the manufacturing and pharmaceutical sectors. These trends are likely to fuel the demand for EPE foam packaging in India. With the increasing focus on sustainable packaging, there is also a growing trend towards the use of eco-friendly and biodegradable materials in the Indian packaging industry, which could impact the demand for EPE foam packaging in the long run.

China own expected notable growth potential in EPE Foam Packaging market

Country China
Market Size (US$ million) by End of Forecast Period (2033) US$ 456.4 million
CAGR % 2023 to End of Forecast (2033) 5.1%

China's rapid economic growth and increasing demand for packaged goods have contributed to the growth of the EPE foam packaging market in recent years. In addition, the growth of e-commerce in China has fueled the demand for lightweight and protective packaging materials, making EPE foam an attractive option for many businesses.

Category-wise Insights

How anti-static ESD foam market segment holds the major market in EPE Foam packaging market?

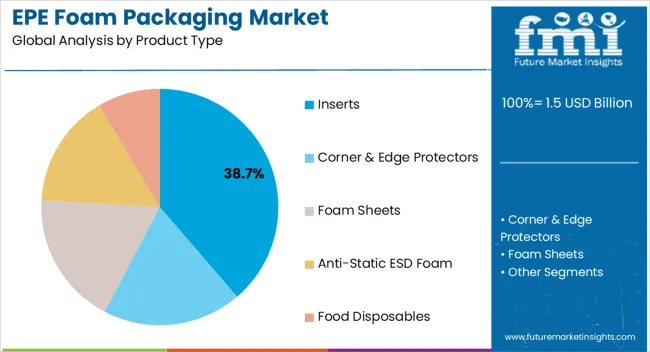
The anti-static ESD foam market segment holds a major share in the EPE (Expanded Polyethylene) foam packaging market due to the increasing demand for electronic products and the need for their safe transportation and storage. ESD foam is commonly used for packaging electronic components such as microchips, circuit boards, and other sensitive electronic devices.

ESD foam is also used in the aerospace, automotive, and medical device industries, where it provides protection against electrostatic discharge during handling and assembly processes. With the increasing adoption of electronic devices in various industries, the demand for ESD foam packaging is expected to continue to grow in the coming years.

Furthermore, the rise in demand for lightweight and eco-friendly packaging solutions is also driving the growth of the EPE foam packaging market, of which anti-static ESD foam is a key segment. EPE foam is a recyclable material that offers excellent shock absorption and cushioning properties, making it an ideal material for packaging fragile and sensitive products.

Although, the demand for anti-static ESD foam in the EPE foam packaging market is driven by the increasing need for safe and secure transportation of electronic components and the growing demand for lightweight and eco-friendly packaging solutions.

Why the demand for insulation packaging is rising in market?

Insulation packaging is designed to protect products from temperature fluctuations, moisture, and other environmental factors that can damage or compromise their quality.

One of the major factors driving the rising demand for insulation packaging is the increasing need for temperature-controlled packaging solutions. Many products, such as food, pharmaceuticals, and medical devices, require specific temperature conditions to maintain their quality and efficacy. Insulation packaging helps to keep these products at the required temperature during transportation and storage.

Another factor driving the demand for insulation packaging is the growth of e-commerce. With more people shopping online, there is an increased need for effective packaging solutions to protect products during shipping. Insulation packaging helps to keep products safe from temperature changes, moisture, and other hazards during transit. In addition to temperature control, insulation packaging also offers excellent cushioning and protection for fragile and sensitive products. This is particularly important in industries such as electronics and automotive, where products can be easily damaged during transportation.

How food service industry is leading role in market?

EPE foam is an excellent packaging material for food service products because of its lightweight, cushioning, and insulating properties. It can help to protect food products during transport, storage, and distribution, and it can also help to keep food fresh and at the desired temperature.

In the food service industry, EPE foam packaging is commonly used for take-out containers, cups, and trays. It is also used for packaging perishable food items such as fruits, vegetables, and meats. The use of EPE foam packaging in the food service industry has increased over the years due to its many benefits, including its affordability, durability, and recyclability.

Furthermore, the increasing demand for food delivery and take-out services due to changing consumer lifestyles has also contributed to the growth of the EPE foam packaging market in the food service industry. EPE foam packaging is a cost-effective and efficient solution for food delivery and take-out, as it is lightweight, easy to transport, and can be customized to fit different food items.

Although, the food service industry is a major contributor to the growth of the EPE foam packaging market, and this trend is likely to continue as the industry continues to evolve and adapt to changing consumer needs and preferences.
Get the data you need at a Fraction of the cost

Personalize your report by choosing insights you need
and save 40%!

How market players stay competitive in EPE Foam Packaging market?

Market players can focus on differentiating themselves through unique product offerings and value-added services. For example, they can develop customized EPE foam solutions for specific industries or applications, such as medical devices or automotive components. They can also offer additional services such as design, prototyping, and testing to help customers optimize their packaging solutions. Market players can leverage technology such as automation and data analytics to improve efficiency, reduce costs, and offer faster turnaround times.

Key strategies in EPE Foam Packaging market:

Product Innovation

EPE foam packaging market could be the incorporation of smart technology into the foam packaging. This could involve embedding sensors into the foam that can detect changes in temperature, humidity, or other environmental factors that could impact the contents of the packaging. The sensors could then transmit this information in real-time to a smartphone app or other device, allowing the user to monitor and adjust the packaging as needed. This innovation could be particularly useful for industries such as pharmaceuticals or food packaging, where temperature control and monitoring are critical. Additionally, this technology could help reduce waste by allowing companies to more accurately monitor the condition of their products and avoid discarding them prematurely due to uncertainty about their storage conditions.

Customization:

EPE foam packaging is to offer personalized foam inserts that are specifically tailored to the shape and size of the product being packaged. This could involve using 3D scanning technology to create a digital model of the product, which could then be used to design a foam insert that perfectly fits the product's dimensions and shape. Customization would ensure that the product is securely and efficiently packed, reducing the risk of damage during transportation. Additionally, companies could offer customized branding on the foam inserts, such as embossing or printing the company logo onto the foam. This would not only improve brand recognition but also add an extra layer of professionalism and attention to detail to the packaging.

Sustainability:

EPE foam packaging market is to develop foam packaging that is completely biodegradable and compostable. This could be achieved by using natural materials such as starch or cellulose to create the foam, rather than petroleum-based materials. The foam could also be treated with enzymes or other additives to speed up the degradation process. This innovation would demonstrate a commitment to sustainability and responsible environmental stewardship, helping to build customer loyalty and brand reputation.

Strategic Expansion:

Companies could explore opportunities in the construction industry, where EPE foam is increasingly being used as a lightweight and durable insulation material. Companies could target the automotive industry, where EPE foam is used in sound insulation and vibration dampening applications.

Key Players in the EPE Foam Packaging market

  • Mefron Technologies
  • Flexipack Group
  • Snehal Packaging Industry
  • Vento Foam Pvt. Ltd.
  • Foamtech
  • ESD Goods
  • Sinkery Foam
  • PAX Solutions
  • Leenol
  • Anu Industries
  • INTCO Recycling
  • Suzhou Hi-tech Zone Chuangfei Packaging Technology Co., Ltd.

Segmentation Analysis of the EPE Foam Packaging Market

Product Type:

  • Inserts
  • Corner & Edge Protectors
  • Foam Sheets
  • Anti-Static ESD Foam
  • Food Disposables

Distribution Channel:

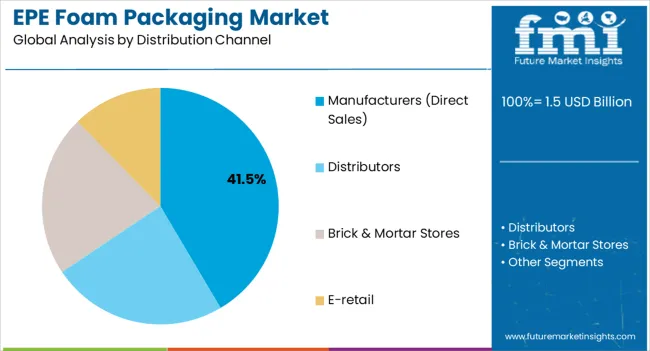
  • Manufacturers (Direct Sales)
  • Distributors
  • Brick & Mortar Stores
  • E-retail

End Use:

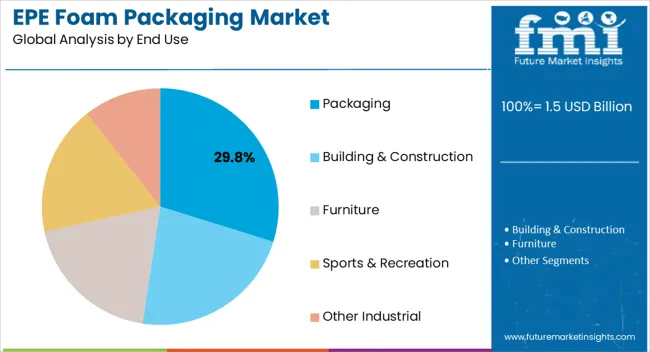
  • Packaging
    • Food Service
      • Trays
      • Clamshells
      • Plates
      • Bowls
      • Cups
    • Protective Packaging
      • Wrapping
      • Cushioning
      • Insulation
  • Building & Construction
  • Furniture
  • Sports & Recreation
  • Other Industrial

Frequently Asked Questions

How Big is the EPE Foam Packaging Market?

The market is expected to generate revenue of US$ 1.4 billion in 2023.

Which Factors are Propelling the Market Growth?

Surging demand for sustainable packing solutions are propelling the market growth.

Which Trend Has Been Spotted in the Global Market?

Customized packaging solutions to replace parts and accessories is a key trend in the market.

Which Opportunities are Emerging in the Market?

Manufacturers can leverage on the increasing demand for high-performance and lightweight packaging solutions.

Who are the Leading Manufacturers of EPE Foam Packaging?

Foamtech, ESD Goods, and Sinkery Foam are the leading manufacturers.

Table of Content
1. Executive Summary 
    1.1. Global Market Outlook
    1.2. Market Analysis
    1.3. Analysis and Recommendations
2. Market Overview
    2.1. Market Coverage / Taxonomy
    2.2. Market Definition / Scope / Limitations
3. Key Market Trends
    3.1. Key Trends Impacting the Market
    3.2. Product Innovation / Development Trends
4. Key Success Factors
    4.1. Product Adoption / Usage Analysis
    4.2. Product USPs / Features
    4.3. Go-to-market Strategy
    4.4. Strategic Promotional Strategies
5. Global Market Demand Analysis 2018 to 2022 and Forecast, 2023 to 2033
    5.1. Historical Market Volume (Tonnes) Analysis, 2018 to 2022
    5.2. Current and Future Market Volume (Tonnes) Projections, 2023 to 2033
    5.3. Y-o-Y Growth Trend Analysis
6. Global Market - Pricing Analysis
    6.1. Regional Pricing Analysis
    6.2. Global Average Pricing Analysis Benchmark
7. Global Market Demand (in Value or Size in US$ Million) Analysis 2018 to 2022 and Forecast, 2023 to 2033
    7.1. Historical Market Value (US$ Million) Analysis, 2018 to 2022
    7.2. Current and Future Market Value (US$ Million) Projections, 2023 to 2033
8. Market Background
    8.1. Global Food Packaging Market Overview
    8.2. Global Market Overview
    8.3. Comparative Study for In-house Packaging Vs. Contract Packaging
    8.4. Packers and Co-packers Supply Chain for Market
    8.5. Forecast Factors - Relevance & Impact
    8.6. Value Chain Analysis & Profitability Margin
        8.6.1. Exhaustive List of Raw Product Type (Foam cups) Suppliers
        8.6.2. Exhaustive List of Market Manufacturers / Converters / Distributors
        8.6.3. Exhaustive List of Brand Owners/ Customer Base (Potential Customers)
    8.7. Case-based Scenario – Impact Assessment
        8.7.1. Current Statistics
        8.7.2. Short-Mid-Long Term Outlook
        8.7.3. Likely Rebound
    8.8. Market Dynamics
        8.8.1. Drivers
        8.8.2. Restraints
        8.8.3. Opportunity Analysis
    8.9. Supply Demand Analysis
        8.9.1. Import /Export Analysis
    8.10. SIC, NAICs and HS Code for Market Products
9. Global Market Analysis 2018 to 2022 and Forecast 2023 to 2033, By Product Type 
    9.1. Introduction / Key Findings
    9.2. Historical Market Size (US$ Million) and Volume (Tonnes) Analysis By Product Type , 2018 to 2022
    9.3. Current and Future Market Size (US$ Million) and Volume (Tonnes) Analysis and Forecast By Product Type , 2023 to 2033
        9.3.1. Inserts
        9.3.2. Corner & Edge Protectors
        9.3.3. Anti-Static ESD Foam
        9.3.4. Food Disposables
    9.4. Market Attractiveness Analysis By Product Type
10. Global Market Analysis 2018 to 2022 and Forecast 2023 to 2033, By Distribution Channel
    10.1. Introduction / Key Findings
    10.2. Historical Market Size (US$ Million) and Volume (Tonnes) Analysis By Distribution Channel, 2018 to 2022
    10.3. Current and Future Market Size (US$ Million) and Volume (Tonnes) Analysis and Forecast By Distribution Channel, 2023 to 2033
        10.3.1. Manufacturers (Distribution Sales)
        10.3.2. Distributors
        10.3.3. Brick & Mortar Stores
        10.3.4. E-retail
    10.4. Market Attractiveness Analysis By Distribution Channel
11. Global Market Analysis 2018 to 2022 and Forecast 2023 to 2033, By End Use
    11.1. Introduction / Key Findings
    11.2. Historical Market Size (US$ Million) and Volume (Tonnes) Analysis By End Use, 2018 to 2022
    11.3. Current and Future Market Size (US$ Million) and Volume (Tonnes) Analysis and Forecast By End Use, 2023 to 2033
        11.3.1. Packaging
            11.3.1.1. Food Service
                11.3.1.1.1. Trays
                11.3.1.1.2. Clamshell
                11.3.1.1.3. Plates
                11.3.1.1.4. Bowls
                11.3.1.1.5. Cups
            11.3.1.2. Protective Packaging
                11.3.1.2.1. Wrapping
                11.3.1.2.2. Cushioning
                11.3.1.2.3. Insulation
        11.3.2. Building and Construction
        11.3.3. Furniture
        11.3.4. Sports and Recreation
        11.3.5. Other Industrial
    11.4. Market Attractiveness Analysis By End Use
12. Global Market Analysis 2018 to 2022 and Forecast 2023 to 2033, by Region
    12.1. Introduction / Key Findings
    12.2. Historical Market Size (US$ Million) and Volume (Tonnes) Analysis By Region, 2018 to 2022
    12.3. Current and Future Market Size (US$ Million) and Volume (Tonnes) Analysis and Forecast By Region, 2023 to 2033
        12.3.1. North America
        12.3.2. Latin America
        12.3.3. East Asia
        12.3.4. South Asia & Pacific
        12.3.5. Western Europe
        12.3.6. Eastern Europe
        12.3.7. Central Asia
        12.3.8. Russia & Belarus
        12.3.9. Balkan & Baltic Countries
        12.3.10. Middle East & Africa (MEA)
    12.4. Market Attractiveness Analysis By Region
13. North America Market Analysis 2018 to 2022 and Forecast 2023 to 2033
    13.1. Introduction / Key Findings
    13.2. Historical Market Size (US$ Million) and Volume (Tonnes) Analysis by Market Taxonomy, 2018 to 2022
    13.3. Current Market Size (US$ Million) and Volume (Tonnes) Analysis and Forecast by Market Taxonomy, 2023 to 2033
        13.3.1. By Country
            13.3.1.1. U.S.
            13.3.1.2. Canada
        13.3.2. By Product Type
        13.3.3. By Distribution Channel
        13.3.4. By End Use
    13.4. Market Attractiveness Analysis
        13.4.1. By Country
        13.4.2. By Product Type
        13.4.3. By Distribution Channel
        13.4.4. By End Use
14. Latin America Market Analysis 2018 to 2022 and Forecast 2023 to 2033
    14.1. Introduction / Key Findings
    14.2. Historical Market Size (US$ Million) and Volume (Tonnes) Analysis by Market Taxonomy, 2018 to 2022
    14.3. Current Market Size (US$ Million) and Volume (Tonnes) Analysis and Forecast by Market Taxonomy, 2023 to 2033
        14.3.1. By Country
            14.3.1.1. Brazil
            14.3.1.2. Mexico
            14.3.1.3. Argentina
            14.3.1.4. Rest of Latin America
        14.3.2. By Product Type
        14.3.3. By Distribution Channel
        14.3.4. By End Use
    14.4. Market Attractiveness Analysis
        14.4.1. By Country
        14.4.2. By Product Type
        14.4.3. By Distribution Channel
        14.4.4. By End Use
15. East Asia Market Analysis 2018 to 2022 and Forecast 2023 to 2033
    15.1. Introduction / Key Findings
    15.2. Historical Market Size (US$ Million) and Volume (Tonnes) Analysis by Market Taxonomy, 2018 to 2022
    15.3. Current Market Size (US$ Million) and Volume (Tonnes) Analysis and Forecast by Market Taxonomy, 2023 to 2033
        15.3.1. By Country
            15.3.1.1. China
            15.3.1.2. Japan
            15.3.1.3. South Korea
        15.3.2. By Product Type
        15.3.3. By Distribution Channel
        15.3.4. By End Use
    15.4. Market Attractiveness Analysis
        15.4.1. By Country
        15.4.2. By Product Type
        15.4.3. By Application Channel
        15.4.4. By End Use
16. South Asia & Pacific Market Analysis 2018 to 2022 and Forecast 2023 to 2033
    16.1. Introduction / Key Findings
    16.2. Historical Market Size (US$ Million) and Volume (Tonnes) Analysis by Market Taxonomy, 2018 to 2022
    16.3. Current Market Size (US$ Million) and Volume (Tonnes) Analysis and Forecast by Market Taxonomy, 2023 to 2033
        16.3.1. By Country
            16.3.1.1. India
            16.3.1.2. ASEAN
            16.3.1.3. Australia & New Zealand
        16.3.2. By Product Type
        16.3.3. By Distribution Channel
        16.3.4. By End Use
    16.4. Market Attractiveness Analysis
        16.4.1. By Country
        16.4.2. By Product Type
        16.4.3. By Distribution Channel
        16.4.4. By End Use
17. Western Europe Market Analysis 2018 to 2022 and Forecast 2023 to 2033
    17.1. Introduction / Key Findings
    17.2. Historical Market Size (US$ Million) and Volume (Tonnes) Analysis by Market Taxonomy, 2018 to 2022
    17.3. Current Market Size (US$ Million) and Volume (Tonnes) Analysis and Forecast by Market Taxonomy, 2023 to 2033
        17.3.1. By Country
            17.3.1.1. Germany
            17.3.1.2. France
            17.3.1.3. Spain
            17.3.1.4. Italy
            17.3.1.5. United Kingdom
            17.3.1.6. BENELUX
            17.3.1.7. Nordics
            17.3.1.8. Rest of Western Europe
        17.3.2. By Product Type
        17.3.3. By Capacity
        17.3.4. By Application
        17.3.5. By Distribution Channel
        17.3.6. By End Use
    17.4. Market Attractiveness Analysis
        17.4.1. By Country
        17.4.2. By Product Type
        17.4.3. By Distribution Channel
        17.4.4. By End Use
18. Eastern Europe Market Analysis 2018 to 2022 and Forecast 2023 to 2033
    18.1. Introduction / Key Findings
    18.2. Historical Market Size (US$ Million) and Volume (Tonnes) Analysis by Market Taxonomy, 2018 to 2022
    18.3. Current Market Size (US$ Million) and Volume (Tonnes) Analysis and Forecast by Market Taxonomy, 2023 to 2033
        18.3.1. By Country
            18.3.1.1. Poland
            18.3.1.2. Hungary
            18.3.1.3. Austria
            18.3.1.4. Czech Republic
            18.3.1.5. Rest of Eastern Europe
        18.3.2. By Product Type
        18.3.3. By Distribution Channel
        18.3.4. By End Use
    18.4. Market Attractiveness Analysis
        18.4.1. By Country
        18.4.2. By Product Type
        18.4.3. By Distribution Channel
        18.4.4. By End Use
19. Central Asia Market Analysis 2018 to 2022 and Forecast 2023 to 2033
    19.1. Introduction / Key Findings
    19.2. Historical Market Size (US$ Million) and Volume (Tonnes) Analysis by Market Taxonomy, 2018 to 2022
    19.3. Current Market Size (US$ Million) and Volume (Tonnes) Analysis and Forecast by Market Taxonomy, 2023 to 2033
        19.3.1. By Country
            19.3.1.1. Kazakhstan
            19.3.1.2. Kyrgyzstan
            19.3.1.3. Tajikistan
            19.3.1.4. Turkmenistan
            19.3.1.5. Uzbekistan
        19.3.2. By Product Type
        19.3.3. By Distribution Channel
        19.3.4. By End Use
    19.4. Market Attractiveness Analysis
        19.4.1. By Country
        19.4.2. By Product Type
        19.4.3. By Distribution Channel
        19.4.4. By End Use
20. Russia & Belarus Market Analysis 2018 to 2022 and Forecast 2023 to 2033
    20.1. Introduction / Key Findings
    20.2. Historical Market Size (US$ Million) and Volume (Tonnes) Analysis by Market Taxonomy, 2018 to 2022
    20.3. Current Market Size (US$ Million) and Volume (Tonnes) Analysis and Forecast by Market Taxonomy, 2023 to 2033
        20.3.1. By Country
            20.3.1.1. Russia
            20.3.1.2. Belarus
        20.3.2. By Product Type
        20.3.3. By Distribution Channel
        20.3.4. By End Use
    20.4. Market Attractiveness Analysis
        20.4.1. By Country
        20.4.2. By Product Type
        20.4.3. By Distribution Channel
        20.4.4. By End Use
21. Balkan & Baltic Countries Market Analysis 2018 to 2022 and Forecast 2023 to 2033
    21.1. Introduction / Key Findings
    21.2. Historical Market Size (US$ Million) and Volume (Tonnes) Analysis by Market Taxonomy, 2018 to 2022
    21.3. Current Market Size (US$ Million) and Volume (Tonnes) Analysis and Forecast by Market Taxonomy, 2023 to 2033
        21.3.1. By Country
            21.3.1.1. Romania
            21.3.1.2. Greece
            21.3.1.3. Bulgaria
            21.3.1.4. Lithuania
            21.3.1.5. Estonia
            21.3.1.6. Latvia
        21.3.2. By Product Type
        21.3.3. By Application Channel
        21.3.4. By End Use
    21.4. Market Attractiveness Analysis
        21.4.1. By Country
        21.4.2. By Product Type
        21.4.3. By Distribution Channel
        21.4.4. By End Use
22. Middle East & Africa Market Analysis 2018 to 2022 and Forecast 2023 to 2033
    22.1. Introduction / Key Findings
    22.2. Historical Market Size (US$ Million) and Volume (Tonnes) Analysis by Market Taxonomy, 2018 to 2022
    22.3. Current Market Size (US$ Million) and Volume (Tonnes) Analysis and Forecast by Market Taxonomy, 2023 to 2033
        22.3.1. By Country
            22.3.1.1. GCC Countries
            22.3.1.2. Turkey
            22.3.1.3. Northern Africa
            22.3.1.4. South Africa
            22.3.1.5. Israel
            22.3.1.6. Saudi Arabia
        22.3.2. By Product Type
        22.3.3. By Distribution Channel
        22.3.4. By End Use
    22.4. Market Attractiveness Analysis
        22.4.1. By Country
        22.4.2. By Product Type
        22.4.3. By Distribution Channel
        22.4.4. By End Use
23. Country wise Market Analysis 2023 & 2033
    23.1. USA Market  Analysis
        23.1.1. By Product Type
        23.1.2. By Distribution Channel
        23.1.3. By End Use
    23.2. Canada Market Analysis
        23.2.1. By Product Type
        23.2.2. By Distribution Channel
        23.2.3. By End Use
    23.3. Brazil Market Analysis
        23.3.1. By Product Type
        23.3.2. By Distribution Channel
        23.3.3. By End Use
    23.4. Mexico Market Analysis
        23.4.1. By Product Type
        23.4.2. By Distribution Channel
        23.4.3. By End Use
    23.5. Germany Market Analysis
        23.5.1. By Product Type
        23.5.2. By Distribution Channel
        23.5.3. By End Use
    23.6. U.K. Market Analysis
        23.6.1. By Product Type
        23.6.2. By Distribution Channel
        23.6.3. By End Use
    23.7. Spain Market Analysis
        23.7.1. By Product Type
        23.7.2. By Distribution Channel
        23.7.3. By End Use
    23.8. France Market Analysis
        23.8.1. By Product Type
        23.8.2. By Distribution Channel
        23.8.3. By End Use
    23.9. Italy Market Analysis
        23.9.1. By Product Type
        23.9.2. By Distribution Channel
        23.9.3. By End Use
    23.10. Russia Market Analysis
        23.10.1. By Product Type
        23.10.2. By Distribution Channel
        23.10.3. By End Use
    23.11. China Market Analysis
        23.11.1. By Product Type
        23.11.2. By Distribution Channel
        23.11.3. By End Use
    23.12. Japan Market Analysis
        23.12.1. By Product Type
        23.12.2. By Distribution Channel
        23.12.3. By End Use
    23.13. India Market Analysis
        23.13.1. By Product Type
        23.13.2. By Distribution Channel
        23.13.3. By End Use
    23.14. GCC Market Analysis
        23.14.1. By Product Type
        23.14.2. By Distribution Channel
        23.14.3. By End Use
    23.15. Australia Market Analysis
        23.15.1. By Product Type
        23.15.2. By Distribution Channel
        23.15.3. By End Use
24. Brand Share Analysis
    24.1. Key End User Brands in the Market
        24.1.1. Nestlé AG
            24.1.1.1. Product Portfolio
            24.1.1.2. Market Share (%)
            24.1.1.3. Investment in Packaging
            24.1.1.4. Sales/Turnover
            24.1.1.5. Strategy
            24.1.1.6. Go-to Market
            24.1.1.7. Preferred Channel Partners and Suppliers
        24.1.2. Procter & Gamble (P&G)
        24.1.3. Unilever plc
        24.1.4. Beiersdorf AG
        24.1.5. Mondelez International, Inc.
        24.1.6. Danone S.A.
        24.1.7. Colgate-Palmolive
        24.1.8. Reckitt Benckiser Group plc
        24.1.9. Johnson & Johnson
        24.1.10. The Kraft Heinz Company
25. Market Structure Analysis
    25.1. Market Analysis by Tier of Companies (Bioplastics Packaging Bag)
    25.2. Market Share Analysis of Top Players
    25.3. Market Presence Analysis
26. Competition Analysis
    26.1. Competition Dashboard
    26.2. Competition Benchmarking
    26.3. Competition Deep Dive
        26.3.1. Dart Container Corporation
            26.3.1.1. Overview
            26.3.1.2. Product Portfolio
            26.3.1.3. Profitability by Market Segments (Product/Channel/Region)
            26.3.1.4. Sales Footprint
            26.3.1.5. Strategy Overview
        26.3.2. D&W Fine Pack LLC
            26.3.2.1. Overview
            26.3.2.2. Product Portfolio
            26.3.2.3. Profitability by Market Segments (Product/Channel/Region)
            26.3.2.4. Sales Footprint
            26.3.2.5. Strategy Overview
        26.3.3. Berry Global Inc.
            26.3.3.1. Overview
            26.3.3.2. Product Portfolio
            26.3.3.3. Profitability by Market Segments (Product/Channel/Region)
            26.3.3.4. Sales Footprint
            26.3.3.5. Strategy Overview
        26.3.4. Genpak LLC
            26.3.4.1. Overview
            26.3.4.2. Product Portfolio
            26.3.4.3. Profitability by Market Segments (Product/Channel/Region)
            26.3.4.4. Sales Footprint
            26.3.4.5. Strategy Overview
        26.3.5. Georgia-Pacific LLCCornware U.K. Ltd.
            26.3.5.1. Overview
            26.3.5.2. Product Portfolio
            26.3.5.3. Profitability by Market Segments (Product/Channel/Region)
            26.3.5.4. Sales Footprint
            26.3.5.5. Strategy Overview
        26.3.6. WinCup
            26.3.6.1. Overview
            26.3.6.2. Product Portfolio
            26.3.6.3. Profitability by Market Segments (Product/Channel/Region)
            26.3.6.4. Sales Footprint
            26.3.6.5. Strategy Overview
        26.3.7. JIT Manufacturing
            26.3.7.1. Overview
            26.3.7.2. Product Portfolio
            26.3.7.3. Profitability by Market Segments (Product/Channel/Region)
            26.3.7.4. Sales Footprint
            26.3.7.5. Strategy Overview
        26.3.8. Winpak Ltd
            26.3.8.1. Overview
            26.3.8.2. Product Portfolio
            26.3.8.3. Profitability by Market Segments (Product/Channel/Region)
            26.3.8.4. Sales Footprint
            26.3.8.5. Strategy Overview
        26.3.9. Cosmoplast
            26.3.9.1. Overview
            26.3.9.2. Product Portfolio
            26.3.9.3. Profitability by Market Segments (Product/Channel/Region)
            26.3.9.4. Sales Footprint
            26.3.9.5. Strategy Overview
        26.3.10. LC MAIZE MANUFACTURING SDN BHD
            26.3.10.1. Overview
            26.3.10.2. Product Portfolio
            26.3.10.3. Profitability by Market Segments (Product/Channel/Region)
            26.3.10.4. Sales Footprint
            26.3.10.5. Strategy Overview
        26.3.11. Al Reyadh Plastic Industries LLC
            26.3.11.1. Overview
            26.3.11.2. Product Portfolio
            26.3.11.3. Profitability by Market Segments (Product/Channel/Region)
            26.3.11.4. Sales Footprint
            26.3.11.5. Strategy Overview
        26.3.12. Luban Pack
            26.3.12.1. Overview
            26.3.12.2. Product Portfolio
            26.3.12.3. Profitability by Market Segments (Product/Channel/Region)
            26.3.12.4. Sales Footprint
            26.3.12.5. Strategy Overview
        26.3.13. Chemco Industries, Inc.
            26.3.13.1. Overview
            26.3.13.2. Product Portfolio
            26.3.13.3. Profitability by Market Segments (Product/Channel/Region)
            26.3.13.4. Sales Footprint
            26.3.13.5. Strategy Overview
        26.3.14. Sudek USA Inc.
            26.3.14.1. Overview
            26.3.14.2. Product Portfolio
            26.3.14.3. Profitability by Market Segments (Product/Channel/Region)
            26.3.14.4. Sales Footprint
            26.3.14.5. Strategy Overview
        26.3.15. Darnel Group
            26.3.15.1. Overview
            26.3.15.2. Product Portfolio
            26.3.15.3. Profitability by Market Segments (Product/Channel/Region)
            26.3.15.4. Sales Footprint
            26.3.15.5. Strategy Overview
        26.3.16. Falcon pack
            26.3.16.1. Overview
            26.3.16.2. Product Portfolio
            26.3.16.3. Profitability by Market Segments (Product/Channel/Region)
            26.3.16.4. Sales Footprint
            26.3.16.5. Strategy Overview
        26.3.17. Megafoam Containers Enterprise Sdn Bhd (MEGAFOAM)
            26.3.17.1. Overview
            26.3.17.2. Product Portfolio
            26.3.17.3. Profitability by Market Segments (Product/Channel/Region)
            26.3.17.4. Sales Footprint
            26.3.17.5. Strategy Overview
        26.3.18. Multipack International
            26.3.18.1. Overview
            26.3.18.2. Product Portfolio
            26.3.18.3. Profitability by Market Segments (Product/Channel/Region)
            26.3.18.4. Sales Footprint
            26.3.18.5. Strategy Overview
        26.3.19. Michael Procos S.A.
            26.3.19.1. Overview
            26.3.19.2. Product Portfolio
            26.3.19.3. Profitability by Market Segments (Product/Channel/Region)
            26.3.19.4. Sales Footprint
            26.3.19.5. Strategy Overview
        26.3.20. GALLEGOPLAST,S.L
            26.3.20.1. Overview
            26.3.20.2. Product Portfolio
            26.3.20.3. Profitability by Market Segments (Product/Channel/Region)
            26.3.20.4. Sales Footprint
            26.3.20.5. Strategy Overview
27. Assumptions and Acronyms Used
28. Research Methodology

Explore Packaging Insights

View Reports
Future Market Insights

EPE Foam Packaging Market

Schedule a Call