
- Market Size (2026)
- USD 29.1 Bn
- Forecast (2036)
- USD 45.2 Bn
- CAGR (2026 to 2036)
- 4.5%
How Big Is the Ethylene Oxide Market in 2026?
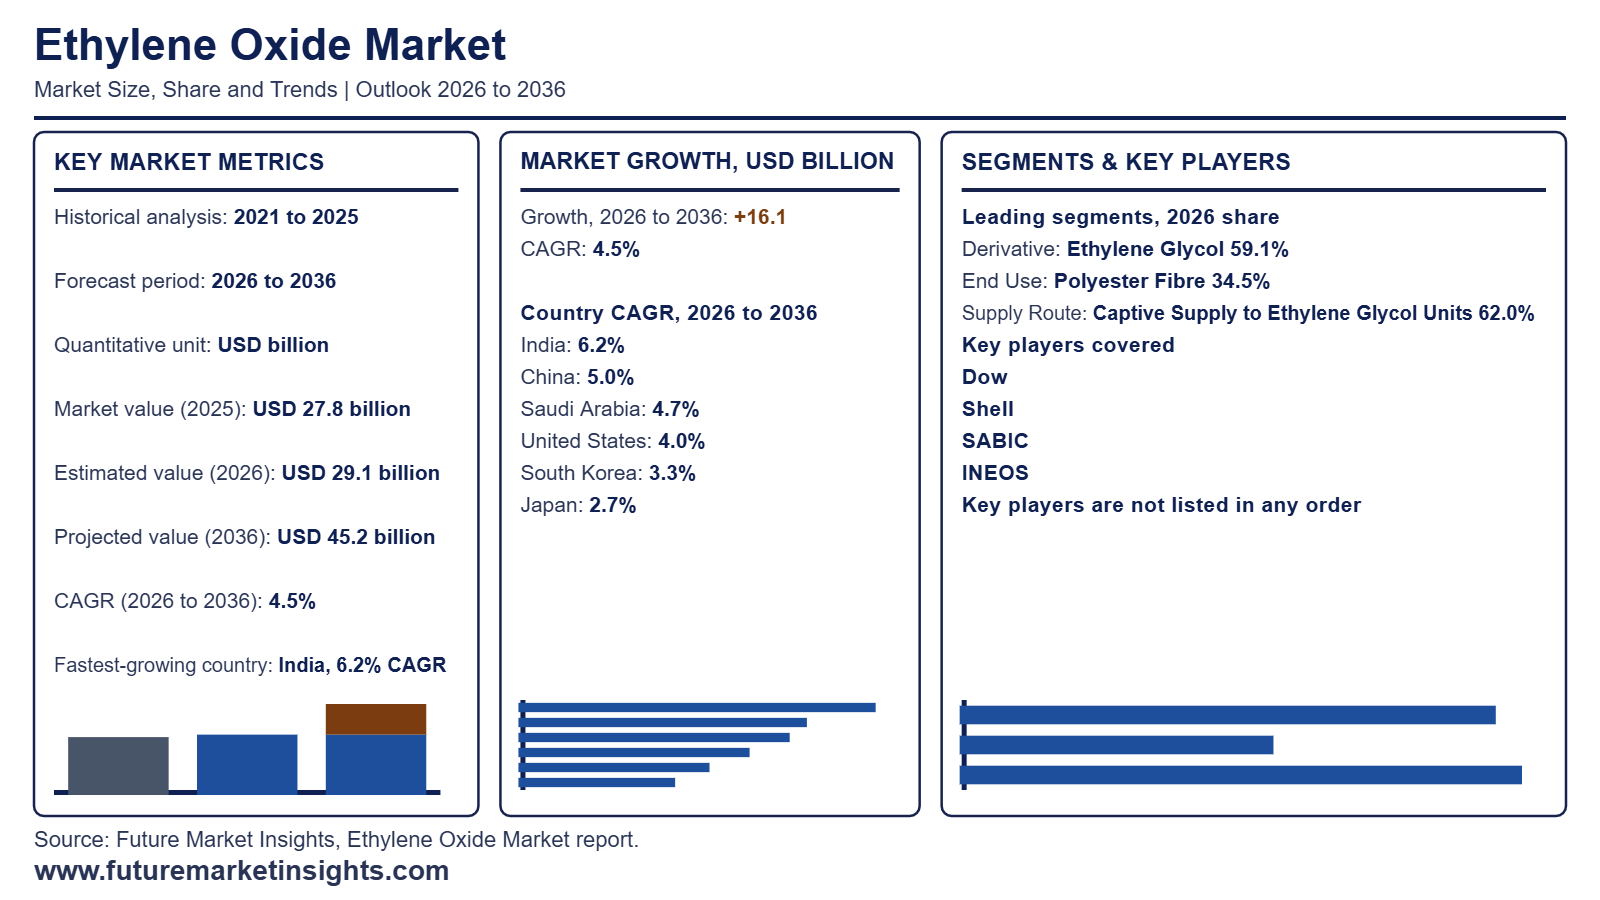
The global ethylene oxide market is valued at USD 29.1 billion in 2026, up from USD 27.8 billion in 2025, and is projected by Future Market Insights (FMI) to reach USD 45.2 billion by 2036, expanding at a 4.5% CAGR to generate USD 16.1 billion in incremental revenue over the forecast decade.
| Metric | Value |
|---|---|
| Market size, 2025 | USD 27.8 billion |
| Estimated market size, 2026 | USD 29.1 billion |
| Projected market size, 2036 | USD 45.2 billion |
| CAGR, 2026 to 2036 | 4.5% |
| Incremental opportunity, 2026 to 2036 | USD 16.1 billion |
| Leading derivative, 2026 | Ethylene glycol, 59.1% |
| Leading end use, 2026 | Polyester fibre, 34.5% |
| Leading supply route, 2026 | Captive supply to ethylene glycol units, 62.0% |
| Leading feedstock source, 2026 | Naphtha-based ethylene, 44.7% |
| Fastest-growing countries, 2026 to 2036 | India 6.2%, China 5.0%, Saudi Arabia 4.7% |
| Tier-1 companies | Dow, Shell, SABIC, INEOS |
Source: Future Market Insights (FMI) analysis
Executive Market Overview
Demand for ethylene oxide (EO) follows the ethylene-to-glycol-to-polyester chain, so plant integration matters more than spot availability. Conversion into ethylene glycol absorbs 59.1% of derivative demand, and captive supply to glycol units takes 62.0% of supply routes because EO is reactive and hazardous. Polyester spinners lead end use at 34.5%, and China's chemical fibre output rose 4.9% to 87.01 million tonnes in 2025 (National Bureau of Statistics of China, January 2026), a downstream signal for polyester fibre. Revenue rises from USD 29.1 billion to USD 45.2 billion at a 4.5% CAGR. India (6.2%) and China (5.0%) lead growth, with Saudi Arabia (4.7%), the USA (4.0%), South Korea (3.3%), Taiwan (3.2%) and Japan (2.7%) following.
Hazard controls and customer qualification are the main restraint, because few buyers can store and handle EO safely, so most volume never reaches the merchant channel. Naphtha-based ethylene supplies 44.7% of feedstock, yet record US ethane production of 2.8 million barrels per day in 2024 (U.S. Energy Information Administration, March 2025) keeps ethane-fed Gulf Coast plants cost-competitive. Producers respond with long-term ethylene supply and offtake contracts, and by placing qualified EO in specialty ethoxylates where glycol margins are thin. Sizing values EO at first external sale or captive transfer, excluding downstream product.
Analyst Perspective
“I expect value in ethylene oxide to accrue to producers integrated into ethoxylates, ethanolamines and glycol ethers, not to merchant volume, because the product is hazardous to move and most of it is consumed where it is made. The watch-point is ethylene feedstock cost and glycol oversupply: I have seen operating rates and margins fall each time new glycol capacity arrived ahead of polyester demand.”
- Nikhil Kaitwade, Principal Analyst at Future Market Insights
Major Market Trends and Insights
- Captive Integration Keeps Most Ethylene Oxide Out of Merchant Trade: Close-coupled oxidation and glycol units avoid transporting a reactive, hazardous intermediate, so operators secure ethylene feedstock before they secure customers. FMI places captive supply to ethylene glycol units at 62.0% of supply route in 2026, while India leads country growth at a 6.2% CAGR against the global 4.5%. Dow (October 2025) agreed to supply an additional 100 KTA of ethylene to MEGlobal's Oyster Creek glycol plant.
- Chinese Ethylene Output Outpaces Fibre Demand, Pressuring Plant Utilisation: Polyester chains pull glycol, but when feedstock capacity grows faster than downstream consumption, integrated operators defend run rates by chasing contract volumes ahead of price. The National Bureau of Statistics of China (January 2026) reported 2025 ethylene output up 6.4% to 41.51 million tonnes against chemical fibre output up 4.9% to 87.01 million tonnes, while FMI projects China at a 5.0% CAGR.
- Local Ethoxylation Capacity Moves EO Value Into Specialty Derivatives: Where glycol margins tighten, producers convert EO into surfactants and excipients near formulators, because specialty buyers pay for specification and technical support rather than tonnage. Clariant (November 2025) completed a CHF 80 million expansion at Daya Bay, China, which it said significantly increased its ethylene oxide derivatives capacity. All routes outside captive glycol supply together hold 38.0% of FMI's 2026 supply-route split.
What Are the Main Drivers, Restraints, and Opportunities?
Polyester and glycol operating rates anchor ethylene oxide offtake, while cracker oversupply and glycol margin pressure limit pricing power. That leaves ethoxylated specialty derivatives near formulators as the main avenue to raise revenue per tonne of EO.
Driver: Polyester Demand and Integrated Glycol Plants Secure Offtake
Because 62.0% of EO moves captively into glycol units, polyester fibre operating rates set offtake, and integrated operators secure ethylene before they sign customers. National Bureau of Statistics of China (January 2026) reported 2025 chemical fibre output up 4.9% to 87.01 million tonnes. Dow (October 2025) added 100 KTA of ethylene supply for MEGlobal’s Oyster Creek glycol plant, set against record U.S. ethane output of 2.8 million barrels per day in 2024 (U.S. Energy Information Administration, March 2025). Glycol buyers gain run-rate stability, while merchant EO sellers lose volume that never leaves the site.
Restraint: Glycol Oversupply and Cracker Rationalization Pressure Margins
When ethylene capacity outgrows polyester demand, integrated operators defend run rates by chasing contract volumes ahead of price, which erodes margins on ethylene glycol sold into fibre and PET chains. National Bureau of Statistics of China (January 2026) shows 2025 ethylene output up 6.4% against chemical fibre at 4.9%. Hydrocarbon Processing (February 2026) reported that South Korea approved the suspension of Lotte Chemical’s 1.1 million tonne Daesan cracker for three years to ease oversupply. Naphtha-based producers, at 44.7% of feedstock, carry the most exposure, while fibre spinners gain leverage in glycol contract talks.
Opportunity: Local Ethoxylated Specialty Derivatives Beyond Commodity Glycol
Where glycol margins tighten, producers convert qualified EO into surfactants, ethanolamines and excipients near formulators, who pay for specification and technical support rather than tonnage, which lifts alcohol ethoxylates revenue per tonne. Clariant (November 2025) completed a CHF 80 million expansion at Daya Bay, China, adding EO derivative capacity for personal care, home care and pharmaceutical customers. FMI projects surfactant ethoxylates at 5.6% and polycarboxylate ether monomers at 5.9% through 2036, against a market CAGR of 4.5%, with India leading countries at 6.2%. Suppliers with validated specifications win these orders.
How Is the Ethylene Oxide Market Segmented?
The global ethylene oxide market is segmented by derivative, end use, supply route, ethylene feedstock source, and region, with all volumes standardised to metric tonnes of ethylene oxide equivalent.
| Segmentation Axis | Sub-Segments Covered | 2026 Leading Segment & Share | Main Growth Benchmark (2026 to 2036) |
|---|---|---|---|
| Derivative | Ethylene Glycol, Surfactant Ethoxylates, Ethanolamines, Glycol Ethers, Polycarboxylate Ether Monomers | Ethylene Glycol (59.1% share) | Polycarboxylate Ether Monomers lead growth at 6.3% CAGR vs. Ethylene Glycol at 4.3% CAGR |
| End Use | Polyester Fibre, PET Packaging and Films, Detergents and Personal Care, Construction Chemicals, Antifreeze and Coolants | Polyester Fibre (34.5% share) | Construction Chemicals lead growth at 6.0% CAGR vs. Polyester Fibre at 4.1% CAGR |
| Supply Route | Captive Supply to Ethylene Glycol Units, Captive Supply to Other Derivative Plants, Merchant Bulk Sales, Merchant Packaged and Specialty Sales | Captive Supply to Ethylene Glycol Units (62.0% share) | Merchant Packaged and Specialty Sales lead growth at 5.7% CAGR |
| Ethylene Feedstock Source | Naphtha-Based Ethylene, Ethane-Based Ethylene, Coal and Methanol-To-Olefins Based Ethylene | Naphtha-Based Ethylene (44.7% share) | Ethane-Based Ethylene leads growth at 5.8% CAGR vs. Naphtha-Based at 4.0% CAGR |
| Region | Asia Pacific, North America, Europe, Middle East & Africa, Latin America | Asia Pacific (58.0% share) | Asia Pacific share rises to 59.7% by 2036; Middle East & Africa grows fastest at 5.4% CAGR |
Source: Future Market Insights analysis of the ethylene oxide market, 2026.
Why Does the Ethylene Glycol Segment Lead by Derivative?
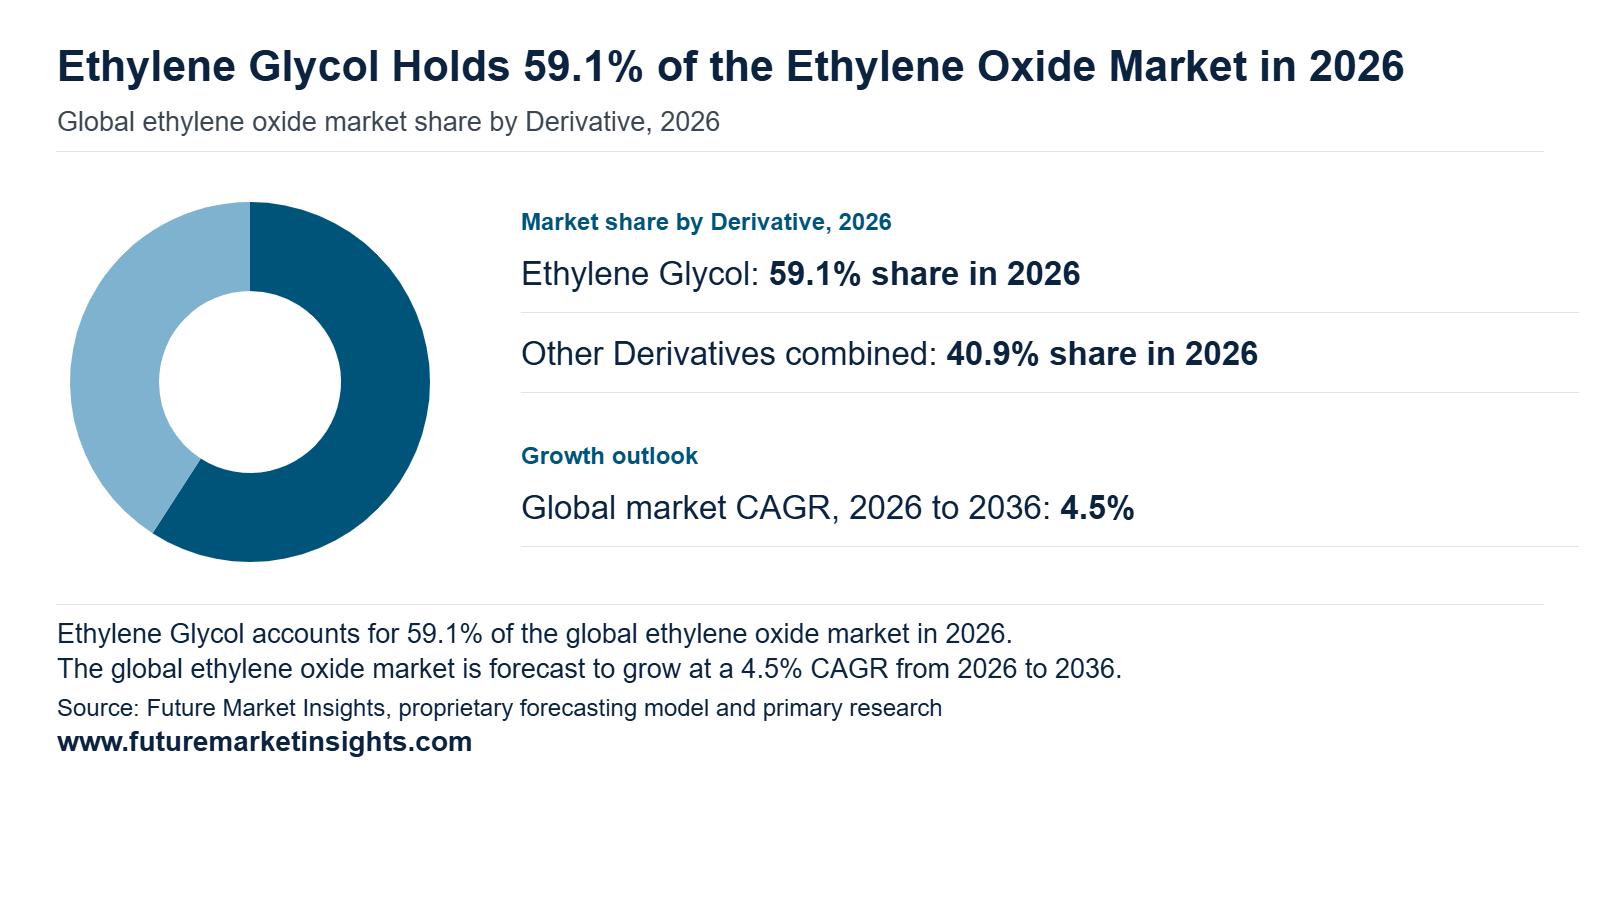
Ethylene Glycol holds 59.1% of derivative demand in 2026, easing to 57.4% by 2036 at a 4.3% CAGR. A glycol unit absorbs ethylene oxide continuously, so integrated operators run reactor and conversion assets as one train and avoid storing a reactive, hazardous intermediate. The liquid output then feeds polyester and PET buyers on established contracts, so EO value is realised through ethylene glycol margins rather than an open EO price. Dow (October 2025) agreed to supply an additional 100 KTA of ethylene to MEGlobal's co-located Oyster Creek glycol plant, securing conversion feedstock. Polycarboxylate Ether Monomers grow fastest at 6.3% CAGR, from a much smaller base.
Why Does the Polyester Fibre Segment Lead by End Use?
Polyester Fibre accounts for 34.5% of end-use demand in 2026, moderating to 32.9% by 2036 at a 4.1% CAGR. Spinners buy monoethylene glycol on continuity and purity specifications, so every running line of polyester fibre pulls EO through the glycol chain, while PET resin and film makers compete for the same glycol and set the allocation margin. Reliance Industries (May 2026) reported that global polyester demand rose 4.8% to 101.3 MMT in calendar 2025, yet glycol demand grew only 3.4%, so fibre output is outpacing glycol offtake. Construction Chemicals grows fastest at 6.0% CAGR.
Why Does the Captive Supply to Ethylene Glycol Units Segment Lead by Supply Route?
Captive Supply to Ethylene Glycol Units takes 62.0% of supply route volume in 2026, easing to 60.8% by 2036 at a 4.4% CAGR. EO is reactive and toxic, so producers keep oxidation reactors and derivative units on short transfer lines, removing third-party handling cost, storage liability and qualification delays. Merchant channels survive where purity justifies the logistics: surfactant, glycol ether and specialty buyers take drummed or tanked volumes through certified ISO tank container networks, and merchant pricing must recover that freight and compliance cost. INEOS (May 2024) completed its Bayport acquisition, a high-purity EO site it positions for third-party customers. Merchant Packaged and Specialty Sales grow fastest at 5.7% CAGR.
Why Does the Naphtha-Based Ethylene Segment Lead by Ethylene Feedstock Source?
Naphtha-Based Ethylene supplies 44.7% of feedstock in 2026, easing to 42.2% by 2036 at a 4.0% CAGR. Crackers embedded in Asian and European refinery-petrochemical complexes already feed EO and derivative units, and co-product credits from propylene and aromatics cushion margins. The exposure is petroleum liquid feedstock cost, because ethane-based routes compete directly on conversion economics. Hydrocarbon Processing (April 2026) reported that CPC restarted its No. 4 naphtha cracker in Taiwan seven days early, lifting monthly ethylene supply to 79,000 tonnes from just over 60,000, showing how regional EO supply depends on cracker uptime. Ethane-Based Ethylene grows fastest at 5.8% CAGR.
Ethylene Oxide Market by Region and Country (2026 to 2036)
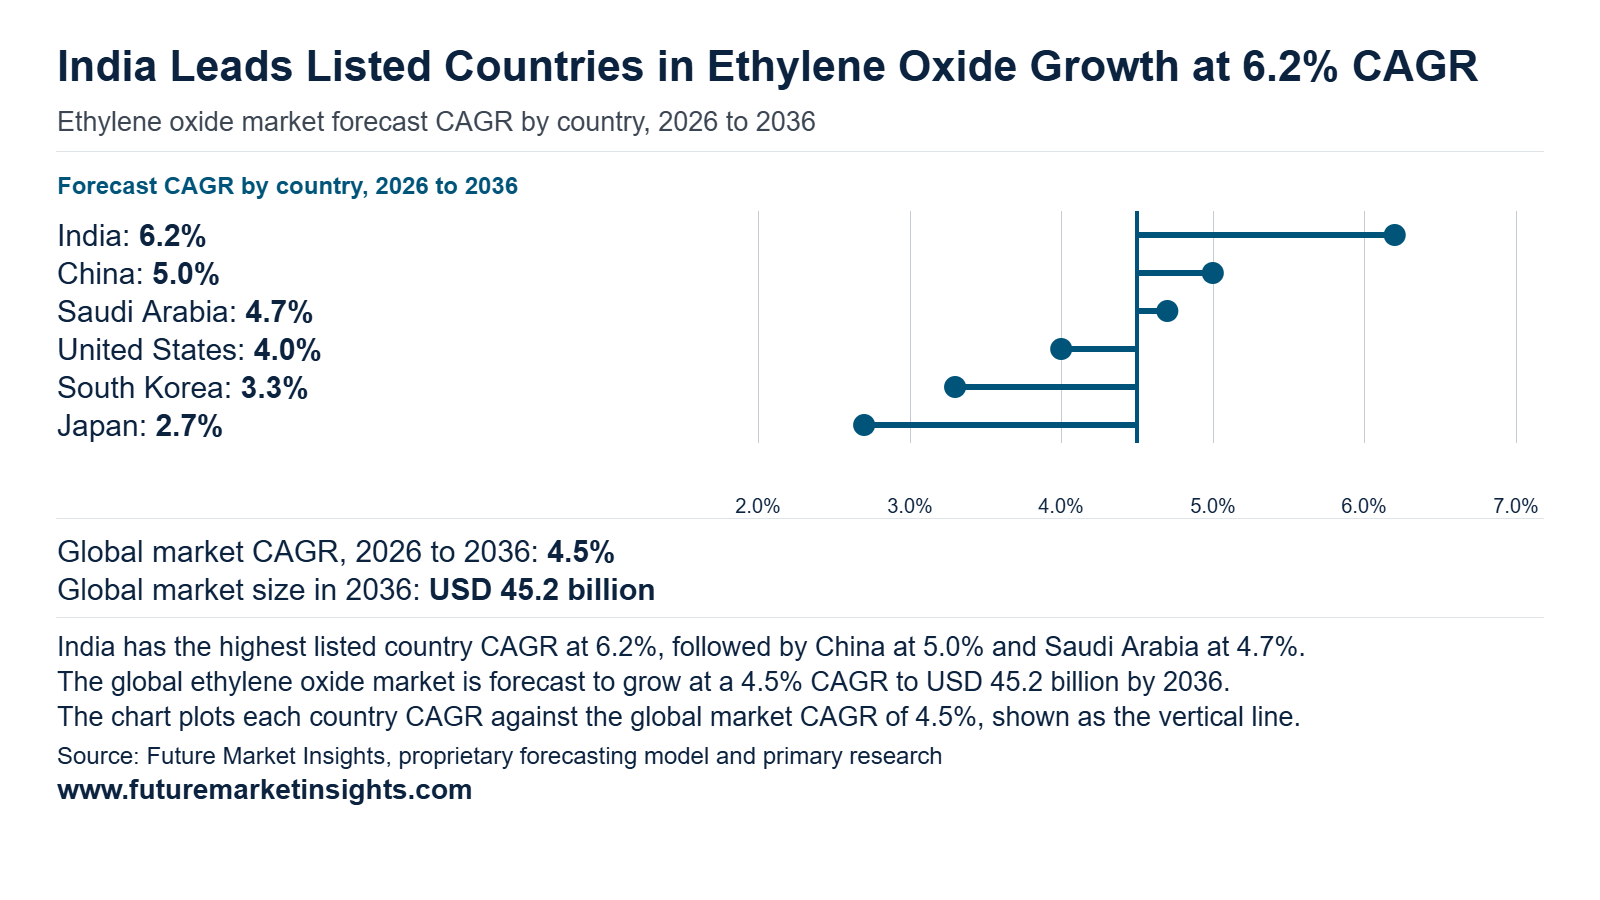
Asia Pacific keeps the majority of global ethylene oxide revenue, and concentration deepens slightly rather than narrows. The five tracked Asian countries rise from 51.4% of global revenue in 2026 to 52.8% in 2036. The seven tracked countries together move from 69.4% to 70.2%. China adds USD 7.14 billion, about 44% of the USD 16.1 billion global gain, and lifts its share from 39.0% to 40.9%. India and Saudi Arabia form the emerging cluster, rising from USD 2.21 billion to USD 3.76 billion (+USD 1.55 billion).
| Country | 2026 Revenue | 2036 Revenue | 10-Year Addition | 2026 to 2036 CAGR | Global Share (2026 → 2036) |
|---|---|---|---|---|---|
| India | USD 1.05 billion | USD 1.92 billion | +USD 0.87 billion | 6.2% | 3.6% → 4.2% |
| China | USD 11.35 billion | USD 18.49 billion | +USD 7.14 billion | 5.0% | 39.0% → 40.9% |
| Saudi Arabia | USD 1.16 billion | USD 1.84 billion | +USD 0.68 billion | 4.7% | 4.0% → 4.1% |
| United States | USD 4.07 billion | USD 6.02 billion | +USD 1.95 billion | 4.0% | 14.0% → 13.3% |
| South Korea | USD 0.93 billion | USD 1.29 billion | +USD 0.36 billion | 3.3% | 3.2% → 2.9% |
| Taiwan | USD 0.52 billion | USD 0.71 billion | +USD 0.19 billion | 3.2% | 1.8% → 1.6% |
| Japan | USD 1.11 billion | USD 1.45 billion | +USD 0.34 billion | 2.7% | 3.8% → 3.2% |
Source: Future Market Insights analysis of the ethylene oxide market, 2026.
China
China remains the largest ethylene oxide market, rising 1.63-fold from USD 11.35 billion in 2026 to USD 18.49 billion by 2036 (5.0% CAGR). It adds USD 7.14 billion and gains the most share, from 39.0% to 40.9%. Captive ethylene oxide feeding glycol and polyester units keeps volumes high, but supply is outrunning demand. Chemical Processing (January 2026) reports BASF brought ethylene oxide, ethylene glycol and polyethylene plants online at its 1 million tonne Zhanjiang site. Bloomin Global (December 2025) puts 2025 average prices near RMB 6,500 per tonne, a 17-year low, on capacity above 7.8 million tonnes. Naphtha-fed merchant producers carry the heaviest losses.
United States
The United States is the second-largest market, growing at a 4.0% CAGR from USD 4.07 billion to USD 6.02 billion. It adds USD 1.95 billion, while its share slips from 14.0% to 13.3%, the largest share loss among tracked countries. Demand rests on glycol for export polyester chains and on medical sterilisation. The US Environmental Protection Agency (March 2026) proposes repealing the 2024 sterilizer emissions standards, noting ethylene oxide sterilises 50% of US medical devices, about 20 billion units a year. Lower compliance spending lets sterilisers avoid forced consolidation, which protects merchant ethylene oxide offtake, while glycol exporters stay exposed to Asian trade policy.
Saudi Arabia
Saudi Arabia is the third-fastest-growing market at a 4.7% CAGR, rising 1.59-fold from USD 1.16 billion to USD 1.84 billion. It adds USD 0.68 billion and edges its share from 4.0% to 4.1%. Export-led glycol volumes from Jubail and Yanbu, backed by competitive domestic feedstock, anchor demand, while localisation policy pulls more derivatives onshore. SABIC (March 2026) took a final investment decision on an ethylene oxide catalyst plant in Saudi Arabia under the Shareek public-private partnership programme, aimed at localising and securing catalyst supply. Local catalyst supply trims a recurring import cost and cushions margins when glycol netbacks thin.
Japan
Japan is the slowest-growing tracked market, expanding at a 2.7% CAGR from USD 1.11 billion to USD 1.45 billion. It adds USD 0.34 billion, and its share falls from 3.8% to 3.2%. Demand is anchored in domestic surfactant, ethoxylate and glycol use, with no export growth engine to offset an ageing population. Asahi Kasei (January 2026) confirms that Asahi Kasei, Mitsui Chemicals and Mitsubishi Chemical will discontinue the Mizushima ethylene plant by fiscal 2030, cutting western Japan ethylene capacity from 951,000 to 455,000 tonnes a year. Tighter regional feedstock should push producers toward higher-margin ethoxylate grades over commodity glycol.
India
India is the fastest-growing market, rising 1.83-fold at a 6.2% CAGR from USD 1.05 billion to USD 1.92 billion. It adds USD 0.87 billion and lifts its share from 3.6% to 4.2%. Polyester fibre, India's largest glycol outlet, drives consumption, and import substitution is pulling ethylene oxide and glycol capacity onshore. Argus Media (November 2025) reports the Gazette of India notice of 12 November 2025 cancelled Bureau of Indian Standards quality controls on PTA, ethylene glycol and polyester products, removing the main administrative barrier to Chinese imports. Open imports cap domestic glycol pricing, so integrated producers hold the margin advantage.
South Korea
South Korea grows at a 3.3% CAGR from USD 0.93 billion to USD 1.29 billion, adding USD 0.36 billion while its share eases from 3.2% to 2.9%. Demand follows polyester and surfactant users, but government-led cracker rationalisation limits feedstock-led expansion. Korea JoongAng Daily (July 2026) reports the government approved a Yeosu plan closing Yeochun NCC units 2 and 3, a cut of 1.39 million tonnes a year. With Daesan, closures total 2.49 million tonnes, about 68% of the 3.7 million tonne target. Ethylene oxide producers without integrated ethylene face higher input costs as the remaining target is allocated.
Taiwan
Taiwan expands at a 3.2% CAGR from USD 0.52 billion to USD 0.71 billion, adding USD 0.19 billion while its share eases from 1.8% to 1.6%. A small domestic base serving textile and polyester chains caps volume growth. Hydrocarbon Processing (January 2026) reports Formosa Petrochemical extended the shutdown of its 700,000 tonne No. 1 Mailiao cracker indefinitely, removing nearly a quarter of its 2.935 million tonne ethylene capacity. The remaining crackers run at 70% to 75%. A retrofit of No. 3 to cheaper ethane feedstock from 2027 should improve ethylene oxide cost positions after that date.
Competitive Environment and Notable Companies
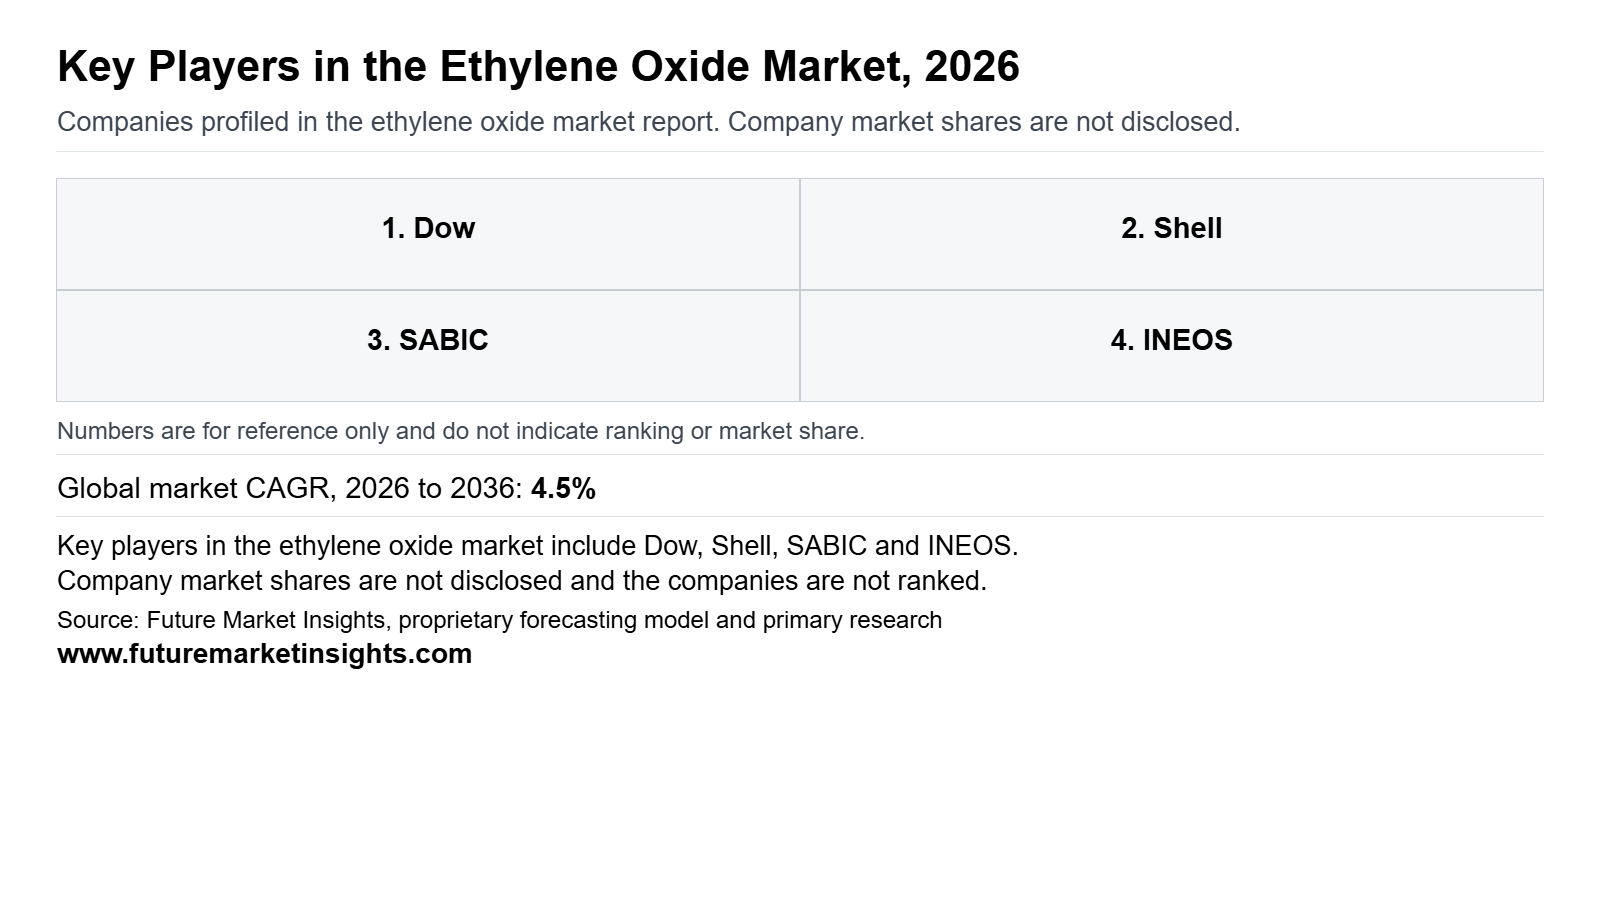
Notable companies operating in the global ethylene oxide market include Dow, Shell, SABIC, INEOS, BASF, Sinopec, Reliance Industries, Indorama Ventures, MEGlobal, and Clariant. Competition runs across three positions. Integrated ethylene-to-glycol producers (Dow, SABIC, Sinopec, Reliance Industries, MEGlobal) compete on feedstock cost and glycol margins, with EO largely consumed internally. EO asset and technology owners (Shell, INEOS, BASF) compete on purified EO availability and licensed plant yields. Ethoxylation specialists (Indorama Ventures, Clariant) compete on formulation support and technical service. Because new EO capacity is being commissioned in China rather than at mature Western sites, licensing and local conversion partnerships offer the clearest route into growth countries.
How Are Companies Positioned in the Ethylene Oxide Market?
Positioning depends on how each producer monetises EO. Integrated glycol producers such as Dow, SABIC, Sinopec, Reliance Industries and MEGlobal leave little EO for merchant buyers: even Indorama Ventures, a surfactants seller, sold only 43,572 tonnes of the 497,597 tonnes it produced in 2024, about 8.8% (Indorama Ventures, 2025). Dow agreed to supply ethylene equivalent to an extra 100 KTA to MEGlobal's co-located Oyster Creek glycol plant (Hydrocarbon Processing, October 2025). Shell sits outside this pattern as a licensor, having issued licences for 89 EO/EG plants (Shell Catalysts & Technologies, 2026).
What Matters When a Buyer Selects an Ethylene Oxide Supplier?
Buyers screen EO suppliers on continuity at the point of use, because EO is classified as hazardous (Indorama Ventures, 2025) and is converted on site or on a shared platform. INEOS promoted Bayport as a site where customers could co-locate on an existing EO and derivatives platform (INEOS, May 2024), then declared force majeure there on 16 October 2026 after equipment failure and lifted it on 6 November 2026 (GreenChem Industries, November 2026). A three-week outage makes second-source qualification and force majeure terms a practical selection test alongside price.
Which Capabilities Distinguish Product Offers?
Offers now differ on certified carbon footprint as well as purity and derivative breadth. Shell Chemicals and Syensqo announced mass-balanced EO solutions with up to 51% lower feedstock footprint under ISCC certification, designed as drop-in products without reformulation or requalification (Chemical Processing, April 2026). Indovinya will use Air Liquide renewable oxygen to cut the footprint of selected products by up to 15% (Indovinya, July 2026), and MEGlobal became the first US glycol producer with ISCC Carbon Footprint Certification (MEGlobal, October 2026). BASF pairs purified EO with alkoxylates at Antwerp (BASF, October 2023).
How Does Geographic Reach Affect Competition?
Western producers hold mature sites, while new EO and glycol capacity is landing in China. BASF brought EO, ethylene glycol and polyethylene plants online at Zhanjiang behind a 1 million tonne ethylene cracker (Chemical Processing, January 2026). SABIC's Fujian complex, with ethylene glycols downstream, is on course for start-up in Q4 2026 (MEES, July 2026). Clariant invested CHF 80 million to lift EO derivative output at Daya Bay (Chemical Engineering, November 2025). Each build-out favours local conversion and gives licensors such as Shell a route into new plants.
| Verified Company Evidence (2026) | Commercial Effect | Buyer Action |
|---|---|---|
| April 2026: Shell Chemicals Europe and Syensqo announced mass-balanced, lower-carbon EO solutions for agricultural and industrial markets, verified under ISCC Carbon Footprint Certification (Chemical Processing, April 2026). | Turns carbon credentials into a certified, drop-in supply route, so EO suppliers can compete on documented footprint without changing the product specification. | Request ISCC certificates and mass-balance boundaries, and test whether the Scope 3 gain justifies any price premium. |
| 15 July 2026: Indovinya, the surfactants business of Indorama Ventures, agreed with Air Liquide to supply renewable oxygen for EO production, cutting the footprint of selected products by up to 15% (Indovinya, July 2026). | Targets an input to EO rather than new capacity, so the gain is a positioning advantage for ethoxylates, not added volume. | Ask ethoxylate suppliers which grades carry the lower footprint and how it is verified before renewing contracts. |
| 16 October to 6 November 2026: INEOS Oxide declared force majeure on EO and EO derivatives at Bayport, Texas, after equipment failure, and lifted it on 6 November 2026 (GreenChem Industries, October and November 2026). | A three-week interruption at a single US EO platform exposed buyers dependent on one site for EO derivatives. | Review force majeure and allocation clauses, and qualify a second source for critical EO derivatives. |
Source: Verified corporate disclosures and Future Market Insights analysis, 2026.
| Company | Core Positioning | Verified Activity & Source Attribution |
|---|---|---|
| Dow | Integrated ethylene-to-glycol operations, US Gulf Coast ethylene supply | Agreed to supply ethylene equivalent to an additional 100 KTA to MEGlobal's Oyster Creek glycol plant (Hydrocarbon Processing, October 2025). |
| Shell | EO/EG process technology licensor with affiliate EO capacity | Announced low-carbon EO solutions with Syensqo in April 2026 (Chemical Processing, April 2026); has issued licences for 89 EO/EG plants (Shell Catalysts & Technologies, 2026). |
| SABIC | Integrated ethylene-to-glycol operations in Saudi Arabia, with a China project | Fujian complex, with ethylene glycols among its downstream units, is on course for start-up in Q4 2026 (MEES, July 2026). |
| INEOS | High-purity EO and derivatives in Europe and the United States | Declared force majeure at Bayport on 16 October 2026 and lifted it on 6 November 2026 (GreenChem Industries, November 2026); completed the Bayport acquisition in May 2024 (INEOS, May 2024). |
| BASF | Integrated EO asset with alkoxylate conversion at Antwerp | Brought EO, ethylene glycol and polyethylene plants online at Zhanjiang (Chemical Processing, January 2026); started the expanded Antwerp complex, an investment above EUR 500 million, in October 2023 (BASF, October 2023). |
| Sinopec | Integrated EO/EG producer in China | Operates integrated EO/EG capacity in China; no dated, EO-specific development was verified for the last 12 months. |
| Reliance Industries | Integrated ethylene-to-glycol operations in India | Reported 1.2 MMT of MEG and by-products sold in FY 2025-26 against 1.1 MMT in FY 2024-25 (Reliance Industries, Annual Report 2025-26). |
| Indorama Ventures | Downstream oxides and surfactant chemistry, United States and Latin America | Indovinya signed a renewable oxygen agreement with Air Liquide for EO production on 15 July 2026 (Indovinya, July 2026); sold 43,572 tonnes of EO externally in 2024 (Indorama Ventures, 2025). |
| MEGlobal | Glycol manufacturing and marketing, United States and Canada | MEGlobal Americas became the first US ethylene glycol producer with ISCC Carbon Footprint Certification, covering MEG and DEG at Oyster Creek, on 27 October 2026 (MEGlobal, October 2026). |
| Clariant | Ethoxylation and specialty derivative platform, China-based capacity | Unveiled expanded Daya Bay Care Chemicals facilities after a CHF 80 million investment, raising EO derivative output (Chemical Engineering, November 2025). |
Source: Verified corporate disclosures and Future Market Insights analysis, 2026.
Ethylene Oxide Market Report Scope and Research Methodology
FMI sizes the global ethylene oxide market from the value of ethylene oxide at first external sale or captive transfer into listed derivatives, cross-checked against wider national ethylene and derivative chemical industry totals. Captive flows into ethylene glycol and other derivative plants are valued on a comparable EO-equivalent basis, so merchant and captive volumes sit on a single value basis. Primary interviews with manufacturers, technology developers, distributors, end users and procurement teams anchor the model, and desk research on trade data, regulatory publications, standards and company filings is used to verify capacity, approvals and commercial activity. Segment and regional estimates are reconciled before the final total is calculated, so segment and national figures sum to the global market total in every year. Company disclosures are used strictly to verify product positioning, assets and launches rather than to estimate proprietary company revenues.
| Coverage Field | Report Scope |
|---|---|
| Market definition | Ethylene oxide sold at first external sale or transferred captively into listed derivatives, with captive flows valued on a comparable EO-equivalent basis. |
| Derivatives | Ethylene glycol, surfactant ethoxylates, ethanolamines, glycol ethers, and polycarboxylate ether monomers. |
| End uses | Polyester fibre, PET packaging and films, detergents and personal care, construction chemicals, and antifreeze and coolants. |
| Supply routes | Captive supply to ethylene glycol units, captive supply to other derivative plants, merchant bulk sales, and merchant packaged and specialty sales. |
| Ethylene feedstock sources | Naphtha-based ethylene, ethane-based ethylene, and coal and methanol-to-olefins based ethylene. |
| Exclusions | Downstream ethylene glycol, polyester, PET, surfactant and service revenues as separate additions, and substitute or adjacent chemicals. |
| Quantitative units | USD billion for value. |
| Value basis | Product value of ethylene oxide at first external sale or captive transfer, counted on an EO-equivalent basis for captive flows. |
| Regions covered | North America, Latin America, Western Europe, Eastern Europe, East Asia, South Asia and Pacific, and Middle East and Africa. |
| National coverage | USA, China, Saudi Arabia, India, Taiwan, South Korea, and Japan. |
| Companies covered | Dow, Shell, SABIC, INEOS, BASF, Sinopec, Reliance Industries, Indorama Ventures, MEGlobal, and Clariant. |
| Forecast period | 2026 to 2036. |
| Approach | Primary and secondary research with market triangulation, followed by data validation against independent indicators to avoid double counting. |
Source: Future Market Insights analysis of the ethylene oxide market, 2026.
Research Sources and Bibliography
- Argus Media (November 2025). India revokes BIS quality controls across chemicals. https://www.argusmedia.com/zh/news-and-insights/latest-market-news/2753495-india-revokes-bis-quality-controls-across-chemicals
- Asahi Kasei (January 2026). Asahi Kasei, Mitsui Chemicals, and Mitsubishi Chemical enter basic agreement to promote decarbonization of ethylene production in western Japan. https://www.asahi-kasei.com/news/2025/e260127.html
- BASF (October 2023). BASF started up expanded ethylene oxide and derivatives complex at its Verbund site in Antwerp. https://www.basf.com/global/en/media/news-releases/2023/10/p-23-335
- Bloomin Global (December 2025). China’s Ethylene Oxide Prices Fall to 17-Year Low Amid Overcapacity and Weak Demand. https://www.bloominglobal.com/media/detail/chinas-ethylene-oxide-prices-fall-to-17-year-low-amid-overcapacity-and-weak-demand
- Chemical Engineering (November 2025). Clariant unveils expanded facilities for specialty chemicals in China. https://www.chemengonline.com/clariant-unveils-expanded-facilities-for-specialty-chemicals-in-china
- Chemical Processing (January 2026). BASF Starts Steam Cracker at China Site Powered with Renewable Energy. https://www.chemicalprocessing.com/industrynews/news/55341953/basf-starts-steam-cracker-at-china-site-powered-with-renewable-energy
- Chemical Processing (April 2026). Syensqo, Shell partner on lower-carbon ethylene oxide solutions. https://www.chemicalprocessing.com/industrynews/news/55369618/syensqo-shell-partner-on-lower-carbon-ethylene-oxide-solutions
- Clariant (December 2022). Clariant announces new investments to enhance Chinese ethoxylation plant. https://www.clariant.com/de/Corporate/News/2022/12/Clariant-announces-new-investments-to-enhance-Chinese-ethoxylation-plant
- Clariant (November 2025). Clariant celebrates Care Chemicals expansion at Daya Bay, strengthening its position in China. https://www.clariant.com/de/Corporate/News/2025/11/Clariant-celebrates-Care-Chemicals-expansion-at-Daya-Bay-strengthening-its-position-in-China
- Dow (October 2025). Dow and MEGlobal expand strategic ethylene supply agreement. https://corporate.dow.com/en-us/news/press-releases/dow-and-meglobal-expand-strategic-ethylene-supply-agreement.html
- Dow (n.d.). Dow Applications Policies. https://www.dow.com/en-us/support/product-safety.html
- Dow (n.d.). Process Licensing and Catalysts for Chemical Manufacturing. https://www.dow.com/en-us/category/market/mkt-chem-mfg-industrial/sub-chem-process-licensing.html
- GreenChem Industries (October 2026). INEOS Oxide declares force majeure at Bayport site, effective immediately. https://www.greenchemindustries.com/article/620/ineos-oxide-declares-force-majeure-at-bayport-site-effective-immediately
- GreenChem Industries (November 2026). INEOS Oxide lifts force majeure on ethylene oxide and derivatives, effective November 6, 2026. https://www.greenchemindustries.com/article/627/ineos-oxide-lifts-force-majeure-on-ethylene-oxide-and-derivatives-effective-november-6-2026
- Hydrocarbon Processing (October 2025). Dow and MEGlobal expand strategic ethylene supply agreement. https://hydrocarbonprocessing.com/news/2025/10/dow-and-meglobal-expand-strategic-ethylene-supply-agreement/
- Hydrocarbon Processing (January 2026). Formosa Petrochemical extends Taiwan cracker shutdown due to weak derivative margins. https://hydrocarbonprocessing.com/news/2026/01/formosa-petrochemical-extends-taiwan-cracker-shutdown-due-to-weak-derivative-margins/
- Indorama Ventures (April 2022). Indorama Ventures completes acquisition of Brazil-based Oxiteno, extending growth profile into attractive surfactant markets. https://www.indoramaventures.com/en/updates/other-release/1903/indorama-ventures-completes-acquisition-of-brazil-based-oxiteno-extending-growth-profile-into-attractive-surfactant-markets
- Indorama Ventures (2025). Key chemical safety, production and compliance with persistent chemical regulations. https://sustainability.indoramaventures.com/storage/content/document/misc/2025/key-chemical-safety-production-and-compliance-with-persistent-chemical-regulations.pdf
- Indovinya (July 2026). Indovinya advances sustainable solutions with agreement for the supply of renewable oxygen from Air Liquide. https://indovinya.indoramaventures.com/indovinya-advances-sustainable-solutions-with-agreement-for-the-supply-of-renewable-oxygen-from-air-liquide/
- INEOS (May 2024). INEOS Completes Purchase of LyondellBasell’s Ethylene Oxide and Derivatives Business. https://www.ineos.com/businesses/ineos-oxide/news/ineos-completes-purchase-of-lyondellbasells-ethylene-oxide-and-derivatives-business/
- Japan Petrochemical Industry Association (n.d.). Ethylene Production. https://www.jpca.or.jp/english/04ethylen_product/index.htm
- Japan Petrochemical Industry Association (n.d.). Production Capacity for Major Petrochemicals (as of December 2024). https://www.jpca.or.jp/english/05product_capacity/index.htm
- Korea JoongAng Daily (July 2026). Gov’t approves 2nd petrochemical restructuring proposal with Yeosu project. https://www.koreajoongangdaily.com/business/govt-approves-2nd-petrochemical-restructuring-proposal-with-yeosu-project/12786272
- MEES (July 2026). Sabic’s Fujian project nears completion. https://www.mees.com/index.php/2026/7/31/refining-petrochemicals/sabics-fujian-project-nears-completion/9db95090-8ce0-11f1-b231-010563b3ebf3
- MEGlobal (October 2026). MEGlobal becomes first U.S. ethylene glycol producer to earn ISCC Carbon Footprint Certification. https://www.meglobal.biz/meglobal-becomes-first-u-s-ethylene-glycol-producer-to-earn-iscc-carbon-footprint-certification/
- Ministry of Economic Affairs, Taiwan (April 2026). https://www.moea.gov.tw/Mns/populace/news/News.aspx?kind=1&menu_id=40&news_id=122287
- Ministry of Textiles, Government of India (October 2026). Ministry of Textiles to Open PLI Scheme Portal for accepting new applications from 1st November 2026. https://www.pib.gov.in/PressReleseDetailm.aspx?PRID=2329667&lang=1®=1
- Ministry of Trade, Industry and Resources, South Korea (February 2026). MOTIR Approves First Petrochemical Restructuring Project, Unveils Support Package of Over KRW 2.1 Trillion. https://english.motir.go.kr/eng/article/EATCLdfa319ada/2512/view
- National Bureau of Statistics of China (February 2026). Statistical Communiqué of the People’s Republic of China on the 2025 National Economic and Social Development. https://www.stats.gov.cn/english/PressRelease/202602/t20260228_1962661.html
- Occupational Safety and Health Administration (n.d.). 29 CFR 1910.1047 - Ethylene Oxide. https://www.osha.gov/laws-regs/regulations/standardnumber/1910/1910.1047
- Reliance Industries (2026). Oil to Chemicals: Integrated Annual Report 2025-26. https://www.ril.com/ar2025-26/oil-to-chemicals.html
- SABIC (January 2024). SABIC Announces Final Investment Decision for the SABIC Fujian Petrochemical Complex. https://www.sabic.com/en/news/42713-sabic-fujian-investment
- SABIC (2025). Petrochemicals: Chemicals, Integrated Annual Report 2025. https://www.sabic.com/en/reports/integrated-report-2025/business-performance/chemicals
- SABIC (March 2026). SABIC announces full year 2025 financial results. https://www.saudiexchange.sa/Resources/fsPdf/23754_381_2026-03-03_20-58-00_en.pdf
- Saudi Aramco (February 2026). Aramco’s gas strategy builds momentum with major progress towards growth target. https://www.aramco.com/en/news-media/news/2026/aramcos-gas-strategy-builds-momentum-with-major-progress-towards-growth-target
- Shell Catalysts & Technologies (October 2025). OMEGA Process. https://www.shell.com/business-customers/catalysts-technologies/licensed-technologies/petrochemicals/ethylene-oxide-production/omega-process.html
- Sinopec Shanghai Petrochemical (January 2026). Major Operating Data of the 2025 Financial Year. https://www1.hkexnews.hk/listedco/listconews/sehk/2026/0119/2026011901137.pdf
- U.S. Energy Information Administration (March 2025). U.S. ethane production, consumption, and exports set new records in 2024. https://www.eia.gov/TodayinEnergy/detail.php?id=64785
- US Environmental Protection Agency (March 2026). Fact Sheet: EPA Proposes Reconsideration of Air Toxics Standards for Ethylene Oxide Commercial Sterilization Facilities. https://www.epa.gov/system/files/documents/2026-03/eto-2026-proposal-fact-sheet-final.pdf
- Xia et al. (February 2024). Synthesis and Modification of Polycarboxylate Superplasticizers: A Review. https://pmc.ncbi.nlm.nih.gov/articles/PMC10934894/
Table of Content
- Key Takeaways
- Market Size and CAGR
- Top Growth Driver
- Fastest Growing Segment
- Leading Region
- Key Companies
- Emerging Opportunities
- Executive Summary
- Global Market Outlook
- Demand-side Trends
- Supply-side Trends
- Technology Roadmap Analysis
- Analysis and Recommendations
- Analyst Perspective (What is happening? Why now? What should investors know?)
- Key Questions Answered
- How large is the market?
- What is the CAGR?
- What are key trends?
- Which region dominates?
- Who are the leaders?
Read More...
- Market Overview
- Market Coverage / Taxonomy
- Market Definition / Scope / Limitations
- Research Methodology
- Chapter Orientation
- Analytical Lens and Working Hypotheses
- Market Structure, Signals, and Trend Drivers
- Benchmarking and Cross-market Comparability
- Market Sizing, Forecasting, and Opportunity Mapping
- Research Design and Evidence Framework
- Desk Research Programme (Secondary Evidence)
- Expert Input and Fieldwork (Primary Evidence)
- Tooling, Models, and Reference Databases
- Data Engineering and Model Build
- Quality Assurance and Audit Trail
- Market Background
- Market Dynamics (Drivers, Restraints, Opportunity, Trends)
- Scenario Forecast (Optimistic, Likely, Conservative)
- Impact Analysis
- AI Impact
- Sustainability Impact
- Regulatory Impact
- Technology Impact
- Consumer / Buyer Analysis
- Purchase Drivers
- Adoption Barriers
- Buyer Journey
- Opportunity Map Analysis
- Product Life Cycle Analysis
- Supply Chain Analysis
- Investment Feasibility Matrix
- Value Chain Analysis
- PESTLE and Porter's Analysis
- Regulatory Landscape
- Regional Parent Market Outlook
- Production and Consumption Statistics
- Import and Export Statistics
- Global Market Analysis and Forecast, 2021 to 2036
- Historical Market Size Value (USD Million) Analysis, 2021 to 2025
- Current and Future Market Size Value (USD Million) Projections, 2026 to 2036
- Y-o-Y Growth Trend Analysis
- Absolute $ Opportunity Analysis
- Global Market Pricing Analysis, 2021 to 2036
- Global Market Analysis and Forecast, By Derivative, 2021 to 2036
- Introduction / Key Findings
- Historical Market Size Value (USD Million) Analysis By Derivative, 2021 to 2025
- Current and Future Market Size Value (USD Million) Analysis and Forecast By Derivative, 2026 to 2036
- Ethylene Glycol
- Surfactant Ethoxylates
- Ethanolamines
- Glycol Ethers
- Polycarboxylate Ether Monomers
- Y-o-Y Growth Trend Analysis By Derivative, 2021 to 2025
- Absolute $ Opportunity Analysis By Derivative, 2026 to 2036
- Global Market Analysis and Forecast, By End Use, 2021 to 2036
- Introduction / Key Findings
- Historical Market Size Value (USD Million) Analysis By End Use, 2021 to 2025
- Current and Future Market Size Value (USD Million) Analysis and Forecast By End Use, 2026 to 2036
- Polyester Fibre
- PET Packaging and Films
- Detergents and Personal Care
- Construction Chemicals
- Antifreeze and Coolants
- Y-o-Y Growth Trend Analysis By End Use, 2021 to 2025
- Absolute $ Opportunity Analysis By End Use, 2026 to 2036
- Global Market Analysis and Forecast, By Supply Route, 2021 to 2036
- Introduction / Key Findings
- Historical Market Size Value (USD Million) Analysis By Supply Route, 2021 to 2025
- Current and Future Market Size Value (USD Million) Analysis and Forecast By Supply Route, 2026 to 2036
- Captive Supply to Ethylene Glycol Units
- Captive Supply to Other Derivative Plants
- Merchant Bulk Sales
- Merchant Packaged and Specialty Sales
- Y-o-Y Growth Trend Analysis By Supply Route, 2021 to 2025
- Absolute $ Opportunity Analysis By Supply Route, 2026 to 2036
- Global Market Analysis and Forecast, By Ethylene Feedstock Source, 2021 to 2036
- Introduction / Key Findings
- Historical Market Size Value (USD Million) Analysis By Ethylene Feedstock Source, 2021 to 2025
- Current and Future Market Size Value (USD Million) Analysis and Forecast By Ethylene Feedstock Source, 2026 to 2036
- Naphtha-Based Ethylene
- Ethane-Based Ethylene
- Coal and Methanol-To-Olefins Based Ethylene
- Y-o-Y Growth Trend Analysis By Ethylene Feedstock Source, 2021 to 2025
- Absolute $ Opportunity Analysis By Ethylene Feedstock Source, 2026 to 2036
- Global Market Analysis and Forecast, By Region, 2021 to 2036
- Introduction
- Historical Market Size Value (USD Million) Analysis By Region, 2021 to 2025
- Current Market Size Value (USD Million) Analysis and Forecast By Region, 2026 to 2036
- North America
- Latin America
- Western Europe
- Eastern Europe
- East Asia
- South Asia and Pacific
- Middle East and Africa
- Market Attractiveness Analysis By Region
- North America Market Analysis and Forecast, By Country, 2021 to 2036
- Historical Market Size Value (USD Million) Trend Analysis By Market Taxonomy, 2021 to 2025
- Market Size Value (USD Million) Forecast By Market Taxonomy, 2026 to 2036
- By Country
- United States
- Canada
- By Derivative
- By End Use
- By Supply Route
- By Ethylene Feedstock Source
- By Country
- Market Attractiveness Analysis
- By Country
- By Derivative
- By End Use
- By Supply Route
- By Ethylene Feedstock Source
- Key Takeaways
- Latin America Market Analysis and Forecast, By Country, 2021 to 2036
- Historical Market Size Value (USD Million) Trend Analysis By Market Taxonomy, 2021 to 2025
- Market Size Value (USD Million) Forecast By Market Taxonomy, 2026 to 2036
- By Country
- Brazil
- Mexico
- Argentina
- Chile
- By Derivative
- By End Use
- By Supply Route
- By Ethylene Feedstock Source
- By Country
- Market Attractiveness Analysis
- By Country
- By Derivative
- By End Use
- By Supply Route
- By Ethylene Feedstock Source
- Key Takeaways
- Western Europe Market Analysis and Forecast, By Country, 2021 to 2036
- Historical Market Size Value (USD Million) Trend Analysis By Market Taxonomy, 2021 to 2025
- Market Size Value (USD Million) Forecast By Market Taxonomy, 2026 to 2036
- By Country
- Germany
- France
- United Kingdom
- Italy
- Spain
- Benelux
- Nordics
- By Derivative
- By End Use
- By Supply Route
- By Ethylene Feedstock Source
- By Country
- Market Attractiveness Analysis
- By Country
- By Derivative
- By End Use
- By Supply Route
- By Ethylene Feedstock Source
- Key Takeaways
- Eastern Europe Market Analysis and Forecast, By Country, 2021 to 2036
- Historical Market Size Value (USD Million) Trend Analysis By Market Taxonomy, 2021 to 2025
- Market Size Value (USD Million) Forecast By Market Taxonomy, 2026 to 2036
- By Country
- Poland
- Czech Republic
- Romania
- Hungary
- By Derivative
- By End Use
- By Supply Route
- By Ethylene Feedstock Source
- By Country
- Market Attractiveness Analysis
- By Country
- By Derivative
- By End Use
- By Supply Route
- By Ethylene Feedstock Source
- Key Takeaways
- East Asia Market Analysis and Forecast, By Country, 2021 to 2036
- Historical Market Size Value (USD Million) Trend Analysis By Market Taxonomy, 2021 to 2025
- Market Size Value (USD Million) Forecast By Market Taxonomy, 2026 to 2036
- By Country
- China
- Japan
- South Korea
- By Derivative
- By End Use
- By Supply Route
- By Ethylene Feedstock Source
- By Country
- Market Attractiveness Analysis
- By Country
- By Derivative
- By End Use
- By Supply Route
- By Ethylene Feedstock Source
- Key Takeaways
- South Asia and Pacific Market Analysis and Forecast, By Country, 2021 to 2036
- Historical Market Size Value (USD Million) Trend Analysis By Market Taxonomy, 2021 to 2025
- Market Size Value (USD Million) Forecast By Market Taxonomy, 2026 to 2036
- By Country
- India
- ASEAN
- Australia and New Zealand
- By Derivative
- By End Use
- By Supply Route
- By Ethylene Feedstock Source
- By Country
- Market Attractiveness Analysis
- By Country
- By Derivative
- By End Use
- By Supply Route
- By Ethylene Feedstock Source
- Key Takeaways
- Middle East and Africa Market Analysis and Forecast, By Country, 2021 to 2036
- Historical Market Size Value (USD Million) Trend Analysis By Market Taxonomy, 2021 to 2025
- Market Size Value (USD Million) Forecast By Market Taxonomy, 2026 to 2036
- By Country
- GCC Countries
- South Africa
- Türkiye
- Israel
- By Derivative
- By End Use
- By Supply Route
- By Ethylene Feedstock Source
- By Country
- Market Attractiveness Analysis
- By Country
- By Derivative
- By End Use
- By Supply Route
- By Ethylene Feedstock Source
- Key Takeaways
- Key Countries Market Analysis
- United States
- Pricing Analysis
- Market Share Analysis, 2025
- By Derivative
- By End Use
- By Supply Route
- By Ethylene Feedstock Source
- Canada
- Pricing Analysis
- Market Share Analysis, 2025
- By Derivative
- By End Use
- By Supply Route
- By Ethylene Feedstock Source
- Brazil
- Pricing Analysis
- Market Share Analysis, 2025
- By Derivative
- By End Use
- By Supply Route
- By Ethylene Feedstock Source
- Mexico
- Pricing Analysis
- Market Share Analysis, 2025
- By Derivative
- By End Use
- By Supply Route
- By Ethylene Feedstock Source
- Argentina
- Pricing Analysis
- Market Share Analysis, 2025
- By Derivative
- By End Use
- By Supply Route
- By Ethylene Feedstock Source
- Chile
- Pricing Analysis
- Market Share Analysis, 2025
- By Derivative
- By End Use
- By Supply Route
- By Ethylene Feedstock Source
- Germany
- Pricing Analysis
- Market Share Analysis, 2025
- By Derivative
- By End Use
- By Supply Route
- By Ethylene Feedstock Source
- France
- Pricing Analysis
- Market Share Analysis, 2025
- By Derivative
- By End Use
- By Supply Route
- By Ethylene Feedstock Source
- United Kingdom
- Pricing Analysis
- Market Share Analysis, 2025
- By Derivative
- By End Use
- By Supply Route
- By Ethylene Feedstock Source
- Italy
- Pricing Analysis
- Market Share Analysis, 2025
- By Derivative
- By End Use
- By Supply Route
- By Ethylene Feedstock Source
- Spain
- Pricing Analysis
- Market Share Analysis, 2025
- By Derivative
- By End Use
- By Supply Route
- By Ethylene Feedstock Source
- Benelux
- Pricing Analysis
- Market Share Analysis, 2025
- By Derivative
- By End Use
- By Supply Route
- By Ethylene Feedstock Source
- Nordics
- Pricing Analysis
- Market Share Analysis, 2025
- By Derivative
- By End Use
- By Supply Route
- By Ethylene Feedstock Source
- Poland
- Pricing Analysis
- Market Share Analysis, 2025
- By Derivative
- By End Use
- By Supply Route
- By Ethylene Feedstock Source
- Czech Republic
- Pricing Analysis
- Market Share Analysis, 2025
- By Derivative
- By End Use
- By Supply Route
- By Ethylene Feedstock Source
- Romania
- Pricing Analysis
- Market Share Analysis, 2025
- By Derivative
- By End Use
- By Supply Route
- By Ethylene Feedstock Source
- Hungary
- Pricing Analysis
- Market Share Analysis, 2025
- By Derivative
- By End Use
- By Supply Route
- By Ethylene Feedstock Source
- China
- Pricing Analysis
- Market Share Analysis, 2025
- By Derivative
- By End Use
- By Supply Route
- By Ethylene Feedstock Source
- Japan
- Pricing Analysis
- Market Share Analysis, 2025
- By Derivative
- By End Use
- By Supply Route
- By Ethylene Feedstock Source
- South Korea
- Pricing Analysis
- Market Share Analysis, 2025
- By Derivative
- By End Use
- By Supply Route
- By Ethylene Feedstock Source
- India
- Pricing Analysis
- Market Share Analysis, 2025
- By Derivative
- By End Use
- By Supply Route
- By Ethylene Feedstock Source
- ASEAN
- Pricing Analysis
- Market Share Analysis, 2025
- By Derivative
- By End Use
- By Supply Route
- By Ethylene Feedstock Source
- Australia and New Zealand
- Pricing Analysis
- Market Share Analysis, 2025
- By Derivative
- By End Use
- By Supply Route
- By Ethylene Feedstock Source
- GCC Countries
- Pricing Analysis
- Market Share Analysis, 2025
- By Derivative
- By End Use
- By Supply Route
- By Ethylene Feedstock Source
- South Africa
- Pricing Analysis
- Market Share Analysis, 2025
- By Derivative
- By End Use
- By Supply Route
- By Ethylene Feedstock Source
- Türkiye
- Pricing Analysis
- Market Share Analysis, 2025
- By Derivative
- By End Use
- By Supply Route
- By Ethylene Feedstock Source
- Israel
- Pricing Analysis
- Market Share Analysis, 2025
- By Derivative
- By End Use
- By Supply Route
- By Ethylene Feedstock Source
- United States
- Market Structure Analysis
- Competition Dashboard
- Competition Benchmarking
- Market Share Analysis of Top Players
- By Region
- By Derivative
- By End Use
- By Supply Route
- By Ethylene Feedstock Source
- Emerging Startups
- Innovation Benchmarking
- Competition Analysis
- Competition Deep Dive
- Dow
- Overview
- Product Portfolio
- Profitability by Market Segments
- Sales Footprint
- Strategy Overview
- Marketing Strategy
- Product Strategy
- Channel Strategy
- SABIC
- Sinopec
- Reliance Industries
- MEGlobal
- Shell
- INEOS
- BASF
- Indorama Ventures
- Clariant
- Dow
- Case Studies
- Success Stories
- Recent Developments
- Competition Deep Dive
- Assumptions & Acronyms Used
List of Tables
- Table 1: Global Market Value (USD Million) Forecast by Region, 2021 to 2036
- Table 2: Global Market Value (USD Million) Forecast by Derivative, 2021 to 2036
- Table 3: Global Market Value (USD Million) Forecast by End Use, 2021 to 2036
- Table 4: Global Market Value (USD Million) Forecast by Supply Route, 2021 to 2036
- Table 5: Global Market Value (USD Million) Forecast by Ethylene Feedstock Source, 2021 to 2036
- Table 6: North America Market Value (USD Million) Forecast by Country, 2021 to 2036
- Table 7: North America Market Value (USD Million) Forecast by Derivative, 2021 to 2036
- Table 8: North America Market Value (USD Million) Forecast by End Use, 2021 to 2036
- Table 9: North America Market Value (USD Million) Forecast by Supply Route, 2021 to 2036
- Table 10: North America Market Value (USD Million) Forecast by Ethylene Feedstock Source, 2021 to 2036
- Table 11: Latin America Market Value (USD Million) Forecast by Country, 2021 to 2036
- Table 12: Latin America Market Value (USD Million) Forecast by Derivative, 2021 to 2036
- Table 13: Latin America Market Value (USD Million) Forecast by End Use, 2021 to 2036
- Table 14: Latin America Market Value (USD Million) Forecast by Supply Route, 2021 to 2036
- Table 15: Latin America Market Value (USD Million) Forecast by Ethylene Feedstock Source, 2021 to 2036
- Table 16: Western Europe Market Value (USD Million) Forecast by Country, 2021 to 2036
- Table 17: Western Europe Market Value (USD Million) Forecast by Derivative, 2021 to 2036
- Table 18: Western Europe Market Value (USD Million) Forecast by End Use, 2021 to 2036
- Table 19: Western Europe Market Value (USD Million) Forecast by Supply Route, 2021 to 2036
- Table 20: Western Europe Market Value (USD Million) Forecast by Ethylene Feedstock Source, 2021 to 2036
- Table 21: Eastern Europe Market Value (USD Million) Forecast by Country, 2021 to 2036
- Table 22: Eastern Europe Market Value (USD Million) Forecast by Derivative, 2021 to 2036
- Table 23: Eastern Europe Market Value (USD Million) Forecast by End Use, 2021 to 2036
- Table 24: Eastern Europe Market Value (USD Million) Forecast by Supply Route, 2021 to 2036
- Table 25: Eastern Europe Market Value (USD Million) Forecast by Ethylene Feedstock Source, 2021 to 2036
- Table 26: East Asia Market Value (USD Million) Forecast by Country, 2021 to 2036
- Table 27: East Asia Market Value (USD Million) Forecast by Derivative, 2021 to 2036
- Table 28: East Asia Market Value (USD Million) Forecast by End Use, 2021 to 2036
- Table 29: East Asia Market Value (USD Million) Forecast by Supply Route, 2021 to 2036
- Table 30: East Asia Market Value (USD Million) Forecast by Ethylene Feedstock Source, 2021 to 2036
- Table 31: South Asia and Pacific Market Value (USD Million) Forecast by Country, 2021 to 2036
- Table 32: South Asia and Pacific Market Value (USD Million) Forecast by Derivative, 2021 to 2036
- Table 33: South Asia and Pacific Market Value (USD Million) Forecast by End Use, 2021 to 2036
- Table 34: South Asia and Pacific Market Value (USD Million) Forecast by Supply Route, 2021 to 2036
- Table 35: South Asia and Pacific Market Value (USD Million) Forecast by Ethylene Feedstock Source, 2021 to 2036
- Table 36: Middle East and Africa Market Value (USD Million) Forecast by Country, 2021 to 2036
- Table 37: Middle East and Africa Market Value (USD Million) Forecast by Derivative, 2021 to 2036
- Table 38: Middle East and Africa Market Value (USD Million) Forecast by End Use, 2021 to 2036
- Table 39: Middle East and Africa Market Value (USD Million) Forecast by Supply Route, 2021 to 2036
- Table 40: Middle East and Africa Market Value (USD Million) Forecast by Ethylene Feedstock Source, 2021 to 2036
List of Figures
- Figure 1: Global Market Pricing Analysis
- Figure 2: Global Market Value (USD Million) Forecast 2021-2036
- Figure 3: Global Market Value Share and BPS Analysis by Derivative, 2026 and 2036
- Figure 4: Global Market Y-o-Y Growth Comparison by Derivative, 2026-2036
- Figure 5: Global Market Attractiveness Analysis by Derivative
- Figure 6: Global Market Value Share and BPS Analysis by End Use, 2026 and 2036
- Figure 7: Global Market Y-o-Y Growth Comparison by End Use, 2026-2036
- Figure 8: Global Market Attractiveness Analysis by End Use
- Figure 9: Global Market Value Share and BPS Analysis by Supply Route, 2026 and 2036
- Figure 10: Global Market Y-o-Y Growth Comparison by Supply Route, 2026-2036
- Figure 11: Global Market Attractiveness Analysis by Supply Route
- Figure 12: Global Market Value Share and BPS Analysis by Ethylene Feedstock Source, 2026 and 2036
- Figure 13: Global Market Y-o-Y Growth Comparison by Ethylene Feedstock Source, 2026-2036
- Figure 14: Global Market Attractiveness Analysis by Ethylene Feedstock Source
- Figure 15: Global Market Value (USD Million) Share and BPS Analysis by Region, 2026 and 2036
- Figure 16: Global Market Y-o-Y Growth Comparison by Region, 2026-2036
- Figure 17: Global Market Attractiveness Analysis by Region
- Figure 18: North America Market Incremental Dollar Opportunity, 2026-2036
- Figure 19: Latin America Market Incremental Dollar Opportunity, 2026-2036
- Figure 20: Western Europe Market Incremental Dollar Opportunity, 2026-2036
- Figure 21: Eastern Europe Market Incremental Dollar Opportunity, 2026-2036
- Figure 22: East Asia Market Incremental Dollar Opportunity, 2026-2036
- Figure 23: South Asia and Pacific Market Incremental Dollar Opportunity, 2026-2036
- Figure 24: Middle East and Africa Market Incremental Dollar Opportunity, 2026-2036
- Figure 25: North America Market Value Share and BPS Analysis by Country, 2026 and 2036
- Figure 26: North America Market Value Share and BPS Analysis by Derivative, 2026 and 2036
- Figure 27: North America Market Y-o-Y Growth Comparison by Derivative, 2026-2036
- Figure 28: North America Market Attractiveness Analysis by Derivative
- Figure 29: North America Market Value Share and BPS Analysis by End Use, 2026 and 2036
- Figure 30: North America Market Y-o-Y Growth Comparison by End Use, 2026-2036
- Figure 31: North America Market Attractiveness Analysis by End Use
- Figure 32: North America Market Value Share and BPS Analysis by Supply Route, 2026 and 2036
- Figure 33: North America Market Y-o-Y Growth Comparison by Supply Route, 2026-2036
- Figure 34: North America Market Attractiveness Analysis by Supply Route
- Figure 35: North America Market Value Share and BPS Analysis by Ethylene Feedstock Source, 2026 and 2036
- Figure 36: North America Market Y-o-Y Growth Comparison by Ethylene Feedstock Source, 2026-2036
- Figure 37: North America Market Attractiveness Analysis by Ethylene Feedstock Source
- Figure 38: Latin America Market Value Share and BPS Analysis by Country, 2026 and 2036
- Figure 39: Latin America Market Value Share and BPS Analysis by Derivative, 2026 and 2036
- Figure 40: Latin America Market Y-o-Y Growth Comparison by Derivative, 2026-2036
- Figure 41: Latin America Market Attractiveness Analysis by Derivative
- Figure 42: Latin America Market Value Share and BPS Analysis by End Use, 2026 and 2036
- Figure 43: Latin America Market Y-o-Y Growth Comparison by End Use, 2026-2036
- Figure 44: Latin America Market Attractiveness Analysis by End Use
- Figure 45: Latin America Market Value Share and BPS Analysis by Supply Route, 2026 and 2036
- Figure 46: Latin America Market Y-o-Y Growth Comparison by Supply Route, 2026-2036
- Figure 47: Latin America Market Attractiveness Analysis by Supply Route
- Figure 48: Latin America Market Value Share and BPS Analysis by Ethylene Feedstock Source, 2026 and 2036
- Figure 49: Latin America Market Y-o-Y Growth Comparison by Ethylene Feedstock Source, 2026-2036
- Figure 50: Latin America Market Attractiveness Analysis by Ethylene Feedstock Source
- Figure 51: Western Europe Market Value Share and BPS Analysis by Country, 2026 and 2036
- Figure 52: Western Europe Market Value Share and BPS Analysis by Derivative, 2026 and 2036
- Figure 53: Western Europe Market Y-o-Y Growth Comparison by Derivative, 2026-2036
- Figure 54: Western Europe Market Attractiveness Analysis by Derivative
- Figure 55: Western Europe Market Value Share and BPS Analysis by End Use, 2026 and 2036
- Figure 56: Western Europe Market Y-o-Y Growth Comparison by End Use, 2026-2036
- Figure 57: Western Europe Market Attractiveness Analysis by End Use
- Figure 58: Western Europe Market Value Share and BPS Analysis by Supply Route, 2026 and 2036
- Figure 59: Western Europe Market Y-o-Y Growth Comparison by Supply Route, 2026-2036
- Figure 60: Western Europe Market Attractiveness Analysis by Supply Route
- Figure 61: Western Europe Market Value Share and BPS Analysis by Ethylene Feedstock Source, 2026 and 2036
- Figure 62: Western Europe Market Y-o-Y Growth Comparison by Ethylene Feedstock Source, 2026-2036
- Figure 63: Western Europe Market Attractiveness Analysis by Ethylene Feedstock Source
- Figure 64: Eastern Europe Market Value Share and BPS Analysis by Country, 2026 and 2036
- Figure 65: Eastern Europe Market Value Share and BPS Analysis by Derivative, 2026 and 2036
- Figure 66: Eastern Europe Market Y-o-Y Growth Comparison by Derivative, 2026-2036
- Figure 67: Eastern Europe Market Attractiveness Analysis by Derivative
- Figure 68: Eastern Europe Market Value Share and BPS Analysis by End Use, 2026 and 2036
- Figure 69: Eastern Europe Market Y-o-Y Growth Comparison by End Use, 2026-2036
- Figure 70: Eastern Europe Market Attractiveness Analysis by End Use
- Figure 71: Eastern Europe Market Value Share and BPS Analysis by Supply Route, 2026 and 2036
- Figure 72: Eastern Europe Market Y-o-Y Growth Comparison by Supply Route, 2026-2036
- Figure 73: Eastern Europe Market Attractiveness Analysis by Supply Route
- Figure 74: Eastern Europe Market Value Share and BPS Analysis by Ethylene Feedstock Source, 2026 and 2036
- Figure 75: Eastern Europe Market Y-o-Y Growth Comparison by Ethylene Feedstock Source, 2026-2036
- Figure 76: Eastern Europe Market Attractiveness Analysis by Ethylene Feedstock Source
- Figure 77: East Asia Market Value Share and BPS Analysis by Country, 2026 and 2036
- Figure 78: East Asia Market Value Share and BPS Analysis by Derivative, 2026 and 2036
- Figure 79: East Asia Market Y-o-Y Growth Comparison by Derivative, 2026-2036
- Figure 80: East Asia Market Attractiveness Analysis by Derivative
- Figure 81: East Asia Market Value Share and BPS Analysis by End Use, 2026 and 2036
- Figure 82: East Asia Market Y-o-Y Growth Comparison by End Use, 2026-2036
- Figure 83: East Asia Market Attractiveness Analysis by End Use
- Figure 84: East Asia Market Value Share and BPS Analysis by Supply Route, 2026 and 2036
- Figure 85: East Asia Market Y-o-Y Growth Comparison by Supply Route, 2026-2036
- Figure 86: East Asia Market Attractiveness Analysis by Supply Route
- Figure 87: East Asia Market Value Share and BPS Analysis by Ethylene Feedstock Source, 2026 and 2036
- Figure 88: East Asia Market Y-o-Y Growth Comparison by Ethylene Feedstock Source, 2026-2036
- Figure 89: East Asia Market Attractiveness Analysis by Ethylene Feedstock Source
- Figure 90: South Asia and Pacific Market Value Share and BPS Analysis by Country, 2026 and 2036
- Figure 91: South Asia and Pacific Market Value Share and BPS Analysis by Derivative, 2026 and 2036
- Figure 92: South Asia and Pacific Market Y-o-Y Growth Comparison by Derivative, 2026-2036
- Figure 93: South Asia and Pacific Market Attractiveness Analysis by Derivative
- Figure 94: South Asia and Pacific Market Value Share and BPS Analysis by End Use, 2026 and 2036
- Figure 95: South Asia and Pacific Market Y-o-Y Growth Comparison by End Use, 2026-2036
- Figure 96: South Asia and Pacific Market Attractiveness Analysis by End Use
- Figure 97: South Asia and Pacific Market Value Share and BPS Analysis by Supply Route, 2026 and 2036
- Figure 98: South Asia and Pacific Market Y-o-Y Growth Comparison by Supply Route, 2026-2036
- Figure 99: South Asia and Pacific Market Attractiveness Analysis by Supply Route
- Figure 100: South Asia and Pacific Market Value Share and BPS Analysis by Ethylene Feedstock Source, 2026 and 2036
- Figure 101: South Asia and Pacific Market Y-o-Y Growth Comparison by Ethylene Feedstock Source, 2026-2036
- Figure 102: South Asia and Pacific Market Attractiveness Analysis by Ethylene Feedstock Source
- Figure 103: Middle East and Africa Market Value Share and BPS Analysis by Country, 2026 and 2036
- Figure 104: Middle East and Africa Market Value Share and BPS Analysis by Derivative, 2026 and 2036
- Figure 105: Middle East and Africa Market Y-o-Y Growth Comparison by Derivative, 2026-2036
- Figure 106: Middle East and Africa Market Attractiveness Analysis by Derivative
- Figure 107: Middle East and Africa Market Value Share and BPS Analysis by End Use, 2026 and 2036
- Figure 108: Middle East and Africa Market Y-o-Y Growth Comparison by End Use, 2026-2036
- Figure 109: Middle East and Africa Market Attractiveness Analysis by End Use
- Figure 110: Middle East and Africa Market Value Share and BPS Analysis by Supply Route, 2026 and 2036
- Figure 111: Middle East and Africa Market Y-o-Y Growth Comparison by Supply Route, 2026-2036
- Figure 112: Middle East and Africa Market Attractiveness Analysis by Supply Route
- Figure 113: Middle East and Africa Market Value Share and BPS Analysis by Ethylene Feedstock Source, 2026 and 2036
- Figure 114: Middle East and Africa Market Y-o-Y Growth Comparison by Ethylene Feedstock Source, 2026-2036
- Figure 115: Middle East and Africa Market Attractiveness Analysis by Ethylene Feedstock Source
- Figure 116: Global Market - Tier Structure Analysis
- Figure 117: Global Market - Company Share Analysis
Frequently Asked Questions
How big is the Ethylene Oxide Market in 2026?
Future Market Insights estimates the global ethylene oxide market at USD 29.1 billion in 2026, projected to reach USD 45.2 billion by 2036.
How fast is the Ethylene Oxide Market expected to grow through 2036?
FMI projects a 4.5% CAGR from 2026 to 2036, taking the global market from USD 29.1 billion in 2026 to USD 45.2 billion by 2036.
Which derivative segment leads the Ethylene Oxide Market?
Ethylene glycol leads the derivative segment with a 59.1% share in 2026, supported by its extensive use in polyester manufacturing and integrated EO-to-glycol conversion.
Which end-use segment leads the Ethylene Oxide Market?
Polyester fibre accounts for 34.5% of the ethylene oxide market in 2026, driven by monoethylene glycol requirements across polyester fibre production.
Which countries are expected to grow fastest in the Ethylene Oxide Market?
India is projected to grow fastest among profiled countries at a 6.2% CAGR from 2026 to 2036, followed by China at 5.0%.
Which companies are profiled in the Ethylene Oxide Market?
The key companies profiled in the ethylene oxide market include Dow, Shell, SABIC, INEOS, BASF, Sinopec, Reliance Industries, Indorama Ventures, MEGlobal, and Clariant. Their activities span ethylene oxide production, technology licensing, captive glycol conversion, and specialty derivatives.
Preview the report firsthand - request a free sample
Get SampleGet the brochure for pricing and purchase details.
Get PDF
