

- Market Size (2026)
- USD 520.6 Mn
- Forecast (2036)
- USD 950.1 Mn
- CAGR (2026 to 2036)
- 6.2%
How big is the Excavation Drainage Mats Market in 2026?
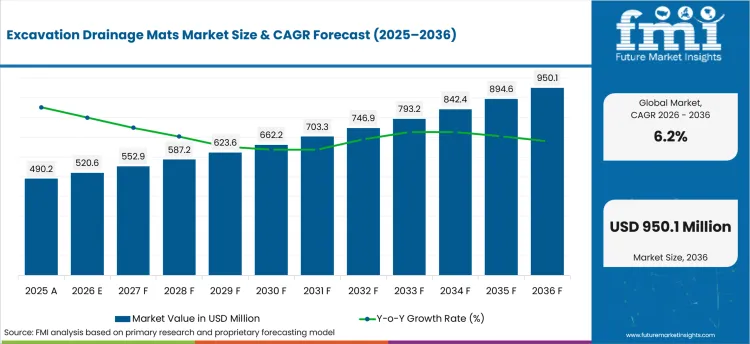
USD 520.6 million in 2026 and USD 950.1 million by 2036 at a 6.2% CAGR.
Sales in excavation drainage mats market are projected to grow at 6.2% CAGR through 2036, driving valuation to USD 950.1 million by 2036 from USD 520.6 million in 2026. Wet utility trenches and retaining-wall excavations need controlled drainage before backfill begins. Procurement teams reviewing geocomposite drainage systems compare flow under soil pressure and filter compatibility. In September 2025, the USA Environmental Protection Agency assigned USD 1.23 billion to supplemental clean-water revolving funds. The funding base is expected to keep drainage materials visible in wastewater rehabilitation packages where groundwater and seepage complicate excavation work.
India and China are projected to favor mats that shorten wet-ground preparation during road and utility expansion. Accounts in the United States and Germany are expected to review stress-test records and installation details during public works review. Field engineers compare water flow along the mat under soil pressure and resistance to clogging before accepting a substitute for aggregate drainage. Procurement teams following geosynthetic infrastructure materials are anticipated to examine roll dimensions and local stock alongside technical data. China’s State Council reported in June 2026 that about 770,000 km of urban underground pipelines are planned for construction or upgrade during 2026-2030. Contractors are forecast to favor systems that make drainage installation easier to sequence around pipe bedding and backfill inspection.
| Metric | Value |
|---|---|
| 2025 Market Size | USD 490.2 million |
| 2026 Market Size | USD 520.6 million |
| 2036 Market Size | USD 950.1 million |
| Forecast CAGR (2026-2036) | 6.2% |
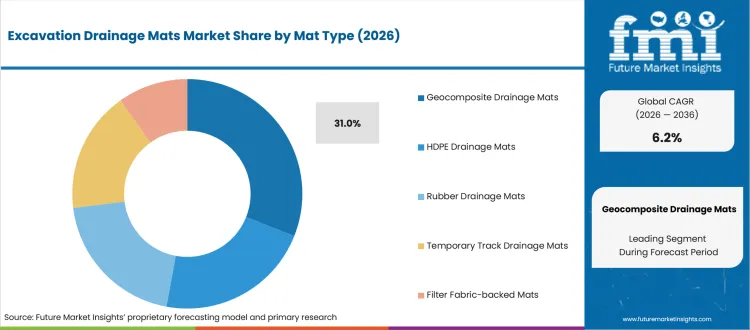
| Mat Type Focus | Geocomposite Drainage Mats |
| Geocomposite Drainage Mats Share (2026) | 31.0% |
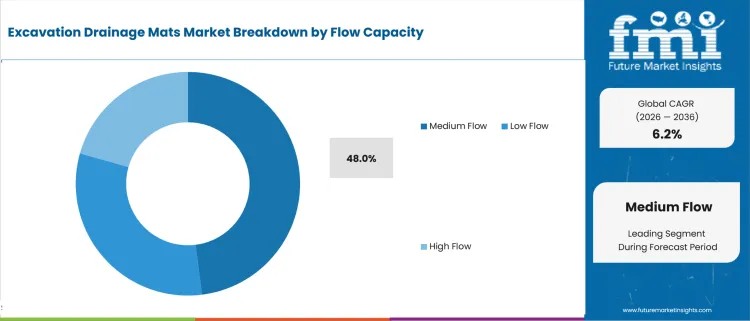
| Flow Capacity Focus | Medium Flow |
| Medium Flow Share (2026) | 48.0% |
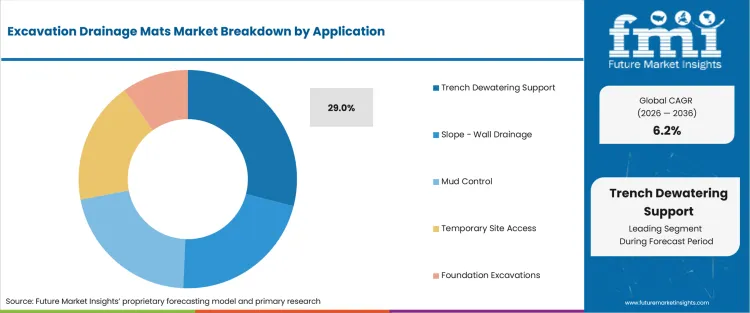
| Application Focus | Trench Dewatering Support |
| Trench Dewatering Support Share (2026) | 29.0% |
| Fastest-growing Country | India |
| India CAGR by 2036 | 8.0% |
Summary of the Excavation Drainage Mats Market
| Market Signal | Commercial Impact |
|---|---|
| Demand and Growth Drivers | Excavation work creates a narrow timing window for drainage because water must be controlled before bedding or backfill closes access. Civil contractors are expected to value mats that reduce stone handling and keep wet work fronts usable for longer periods.
|
| Product and Segment View | Geocomposite drainage mats are projected to lead mat type choices because a filter layer and drainage core arrive as one installed system. Medium-flow products are expected to fit routine trench and wall drainage where extreme discharge capacity is unnecessary.
|
| Geography and Growth Outlook | Country demand differs by project scale and approval practice. India and China are expected to emphasize field availability while Germany and Japan are projected to place greater weight on documented drainage performance and installation control.
|
| Competitive Landscape | Competition centers on verified drainage performance under load and the ability to support designers before tender release. Product range alone does not settle an approval where soil conditions and connection details differ across projects.
|
| Analyst Perspective | Flow capacity after soil loading separates a useful drainage mat from a thin product that only looks convenient before burial. Engineering teams are expected to ask how the core and filter behave together after backfill and repeated wetting.
- Nikhil Kaitwade, Principal Consultant at Future Market Insights |
Source: FMI's proprietary forecasting model and primary research
How is the excavation drainage mats market segmented?
The excavation drainage mats industry is segmented by mat type, flow capacity, application, end use, sales channel, and region.
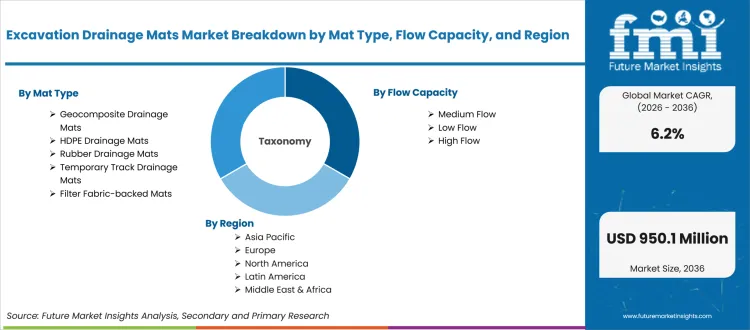
The excavation drainage mats market is segmented by mat type, flow capacity, application, end use, and sales channel. Mat types cover geocomposite, HDPE, rubber, temporary track, and filter fabric-backed mats. Flow capacity covers low, medium, and high flow. Applications include trench dewatering support, slope or wall drainage, mud control, temporary site access, and foundation excavations. End uses cover civil construction, utilities, mining or quarrying, roadworks, and industrial sites. Sales channels include geosynthetic distributors, rental providers, direct manufacturers, and contractor supply. Regions include North America, Latin America, Europe, East Asia, South Asia, Oceania, and Middle East and Africa. The State Council Information Office reported in October 2025 that underground pipeline networks were expected to generate investment demand exceeding 5 trillion yuan. Related South Asian geosynthetic demand reflects road and utility excavation.
What supports demand for geocomposite drainage mats within the mat type category?
Narrow excavations leave limited room for stone delivery and spreading beside the trench edge. In June 2026, Freudenberg Performance Materials presented geotextiles and nonwovens for road construction at a civil engineering event in Ljubljana. The event placed filtration materials before civil engineering specifiers who compare their roles inside buried drainage details. Site engineers still need flow data that reflects actual soil load and outlet spacing before approving a drainage substitution.
- Based on mat type, geocomposite drainage mats are projected to account for 31.0% in 2026 because one system combines drainage and filtration. Solmax reported in May 2025 that MIRAFI H2Rx covered 27,000 m² on a canal-adjacent road project in Thailand. Civil contractors comparing geocell stabilization systems are expected to assess where drainage and ground support solve different parts of the same wet-site problem.
- Geocomposite drainage mats are drawing demand from geotechnical engineers because the format reduces layer depth and simplifies handling beside retaining walls. ABG Geosynthetics reported in June 2025 that Fildrain installation was more than 50% faster than the stone method used for comparison. Design teams are anticipated to weigh installation savings against flow evidence and durability requirements for the project.
How is medium flow positioned within the flow capacity category?
Routine trench and wall drainage usually needs steady discharge instead of capacity reserved for heavy seepage zones. NAUE reported in November 2025 that Secudrain collects and discharges percolation water behind bridge abutments and retaining walls. The direct civil use makes expected water paths and soil pressure central to medium-flow selection. Contractors still check whether the mat carries water after backfill and whether outlets remain accessible during construction.
- By flow capacity, medium flow is estimated to hold 48.0% in 2026 because the capacity fits routine trench seepage and wall drainage. ABG Geosynthetics reported in June 2025 that Fildrain 7DD/ST170 replaced a 6C stone drainage layer on the A140 Long Stratton Bypass. The road application shows why routine drainage design must balance steady discharge with roll handling under embankment work.
- Demand for medium-flow mats is forecast to grow among utility contractors because handling helps constrained repair sites. Flow verification remains necessary before contractors change a trench detail during utility work.
What drives trench dewatering support within the application category?
Groundwater entering an open trench often softens bedding and complicates inspection before pipes or foundations are placed. Solmax reported in May 2025 that MIRAFI H2Rx was used on a Thailand road over soft clay and high groundwater. Drainage mats address a different layer of the same water-control problem by creating a defined path for seepage. Utility crews judge them by outlet continuity and resistance to soil intrusion during backfill.
- In 2026, trench dewatering support is expected to lead application demand with 29.0% share because crews need groundwater relief before bedding acceptance. The USA Environmental Protection Agency reported in May 2026 that fiscal 2026 state revolving fund allotments for water infrastructure totaled $7.2 billion. Utility excavation related to funded programs is anticipated to keep temporary drainage planning visible during project preparation.
- Utility crews purchase trench drainage mats because the materials keep bedding areas workable between pumping cycles. Mat selection is estimated to reflect soil fines and available discharge points during active trench work.
What are the drivers, restraints, and opportunities in the excavation drainage mats market?
Near-term purchases are projected to reflect wet-site productivity and proof of flow under soil pressure while thinner drainage layers are expected to reduce aggregate handling.
- Driver: Civil contractors are expected to purchase drainage mats when wet excavations interrupt bedding work and aggregate delivery creates extra handling near open trenches.
- Restraint: Approval is anticipated to slow where suppliers cannot show flow performance under the project’s soil load or explain filter compatibility with local fines.
- Opportunity: Geocomposite systems are projected to gain specification space when contractors need thinner drainage layers and fewer truck movements around constrained excavation sites.
Wet excavation changes the daily work sequence because crews are unable to place bedding or close a trench until seepage is controlled. Contractors are expected to compare mat installation against aggregate delivery where limited urban space constrains stockpiles.
Technical approval becomes harder when a product sheet gives nominal flow without showing performance under project soil pressure. The USA Department of Transportation reported in January 2025 that a new FHWA final rule ended the general waiver for manufactured products in federal-aid highway and bridge projects. The rule brings sourcing evidence into material review alongside technical fit. Public works reviewers are forecast to ask whether mat tests reflect real soil pressure and expected fines. Unclear outlet details are anticipated to delay acceptance even when material is available.
The constraint creates an opening for manufacturers that combine laboratory flow data with installation guidance and local project support. Solmax reported in June 2026 that an Eco Botanic City project used 1,385 m of geocomposite-reinforced walls with planned internal drainage. The opportunity is forecast to favor proposals that explain where the mat starts and how collected water leaves the excavation.
Which country CAGRs are profiled in the excavation drainage mats market?
.webp "Top Country Growth Comparison Excavation Drainage Mats Market Cagr (2026 2036)")
| Country | CAGR |
|---|---|
| United States | 5.2% |
| China | 7.2% |
| India | 8.0% |
| Germany | 4.8% |
| United Kingdom | 5.6% |
| Japan | 4.5% |
| Australia | 5.9% |
Source: FMI's proprietary forecasting model and primary research
How do country-level CAGRs compare in the excavation drainage mats market?
Country growth depends on funded excavation work and the way public agencies approve substitutes for aggregate drainage. The State Council Information Office reported in May 2026 that China had built nearly 3.9 million km of urban underground pipelines by the end of 2025. India and China are projected to emphasize installation speed on expanding road and utility programs. Germany and Japan are estimated to place more weight on test evidence during rehabilitation work. Accounts in the United Kingdom and Australia are anticipated to balance documentation needs with regional delivery coverage.
- The United States has a large queue of funded and planned water projects that keeps underground construction active across municipal systems. Excavation drainage mat demand is expected to grow at 5.2% CAGR over the assessment period because trench rehabilitation and strict contractor documentation support demand. The USA Environmental Protection Agency reported Water Infrastructure Finance and Innovation Act financing availability of USD 6.5 billion in November 2025. The program supports projects where rehabilitation and wet excavations need planned water control. State revolving fund administrators and municipal engineering consultants shape approved material lists. Contractors value domestic stock and field response under changing groundwater conditions. Supplier selection depends on flow evidence for the project and local response capacity.
- Gaochang District in Turpan began a drainage and flood-control pipe program that directly expands underground work fronts. Local contractors face hot conditions and deep utility corridors where drainage sequencing affects excavation stability. Excavation drainage mat demand in China is forecast to rise at 7.2% CAGR over the forecast period led by city pipeline renewal and local manufacturing access. Turpan’s municipal government reported that the district drainage and flood-control pipe program reached 26 km in March 2025. The work creates a clear use case for thin drainage layers near trenches and retaining structures. Municipal construction bureaus and local civil contractors compare price against delivery reliability. Product acceptance hinges on field proof under local backfill soils.
- India’s road program keeps drainage work close to new corridors and rural connectivity projects. Adoption of excavation drainage mats in India is estimated to expand at 8.0% CAGR through 2036 supported by road construction and utility expansion. Data from the Press Information Bureau showed PMGSY completed road length at 4.11 lakh km for 2014-2026 in its June 2026 release. Road contractors and state public works departments regularly manage wet shoulders and culvert excavations along those routes. NHAI and state public works departments shape material acceptance through project specifications and field checks. Procurement favors suppliers with local technical staff and regional stock. The open question is whether mat-based details move beyond metro work into routine road packages.
- German civil works procurement gives technical approval a visible place before installation starts. Contractors often need drainage layers beside transport structures where long service life and documented materials shape review. Germany’s excavation drainage mats sector is projected to record 4.8% CAGR during the assessment period because rehabilitation work creates purchases based on project specifications. Destatis estimated the 2025 decline in construction gross value added after price adjustments at 3.6% in its January 2026 release. The decline makes evidence on installed cost more consequential during material substitution decisions. Deutsche Bahn and engineering consultancies influence how drainage products are documented for rail-related earthworks. Supplier reviews favor test data that matches the load condition stated in the design.
- United Kingdom drainage procurement depends on water-company investment and road works that expose buried assets. Contractors compare access time and material handling before choosing a drainage detail for constrained urban excavations. ABG Geosynthetics gives local engineering teams a domestic source of Fildrain design support. In the United Kingdom, excavation drainage mat demand is anticipated to advance at 5.6% CAGR through 2036 led by water network work and tender review based on documented evidence. Official data from the UK government placed secured water-sector funding at £104 billion in December 2025. Utility contractors value products that reduce bulk aggregate movements near live streets. Approval speed depends on whether design notes answer filter and outlet questions before mobilization.
- Japan’s sewer rehabilitation agenda became more urgent after the Yashio road-collapse event sharpened attention on buried infrastructure condition. Utility owners and civil contractors work in dense corridors where excavation footprints are closely controlled. Drainage mats are expected to face careful material review before contractors replace conventional granular layers. According to Japan’s transport ministry, urgent-action sewer pipe length reached about 72 km in September 2025. Excavation drainage mat sales in Japan are forecast to expand at 4.5% CAGR by 2036 supported by rehabilitation work and space-constrained construction. MLIT guidance and municipal engineering standards shape material approval. Suppliers compete through precise installation drawings and Japanese-language technical support.
- Australia’s project geography puts unusual weight on regional stock and contractor support when worksites are far from major warehouses. Road and rail excavation packages often combine drainage needs with temporary access across wet or weak ground. Distributors and rental fleets influence how quickly mats reach civil contractors. Australia is estimated to post 5.9% CAGR over the forecast period because transport investment supports demand for reusable site systems. The Department of Infrastructure recorded road and rail project funding of $17.1 billion in March 2025. Civil contractors compare roll handling with aggregate haul distance before changing a site detail. Regional coverage remains a practical differentiator outside the east-coast warehouse network.
Who are the notable companies in the excavation drainage mats market?
NAUE, HUESKER, Maccaferri, ABG Geosynthetics, Freudenberg Performance Materials, and Solmax are the notable companies shaping this market.
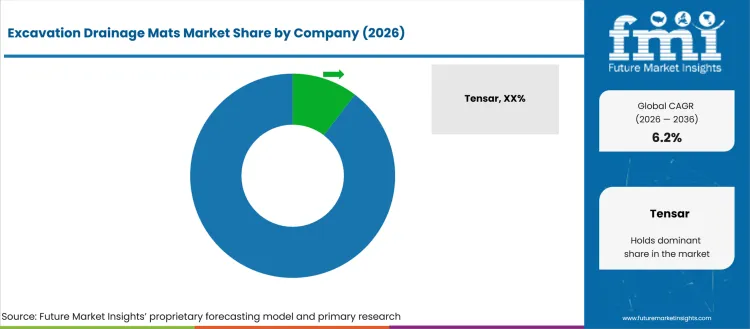
Competition centers on water flow through the mat under soil pressure and clear filtration evidence. Civil contractors compare roll handling and outlet details because drainage layers are buried quickly after inspection. The USA Department of Transportation reported in December 2025 that the fiscal 2026 BUILD program had at least $1.5 billion under the infrastructure law. Transport work funded by those grants is anticipated to keep drainage specifications visible during earthworks planning. Drainage proposals are forecast to win review when measured performance matches the installation sequence.
NAUE and ABG Geosynthetics compete in civil work where project specifications guide purchasing because both provide drainage composites with engineering guidance. Secudrain addresses soil-contact drainage whereas Fildrain materials serve earthworks and structural drainage. Technical proof and project design support are expected to separate proposals.
Project teams consider HUESKER where drainage is specified beside erosion control and reinforcement systems. Freudenberg Performance Materials competes through geocomposites and geotextiles used in civil engineering drainage. The companies use different channel routes and serve designers who need drainage and filtration functions in one project package.
Maccaferri draws attention from transport and retaining-structure accounts seeking drainage products within a broader geotechnical portfolio. Solmax competes on multiple drainage core options and current project examples. Engineering teams compare outlet details and soil-contact filtration before choosing between project packages. Both companies support accounts that specify several geosynthetic functions.
ABG Geosynthetics has a local service advantage in United Kingdom projects where technical support shortens design exchange. Solmax serves an international network where teams need cross-border product availability.
Competitive Benchmarking: Excavation Drainage Mats Market
| Company | Drainage Portfolio | Specification Support | Service Reach |
|---|---|---|---|
| NAUE | High | High | High |
| HUESKER | High | High | High |
| Maccaferri | High | High | High |
| ABG Geosynthetics | High | High | Medium |
| Freudenberg Performance Materials | High | High | High |
| Solmax | High | High | High |
Source: Future Market Insights competitive analysis, 2026. Ratings reflect relative portfolio relevance and workflow fit. Service capability and geographic reach shape the remaining comparison.
Key Developments in the Excavation Drainage Mats Market
- In April 2025, Sineco International announced that it became a subsidiary of the HUESKER Group after the transaction took effect on April 3. The company said its drainage and erosion-control products use three-dimensional plastic strands that create open paths for water.
- In April 2026, NAUE reported that Deutsche Bahn had renewed the product qualification for Secudrain WAS 7. The qualification covers backfill drainage use on the rail network and runs until January 2029.
- In May 2026, Solmax published a Texas site-development case using FABRINET TP instead of aggregate for subsurface drainage. The May 2026 case reported reduced excavation and a 54% cost reduction in the project comparison.
- In May 2025, ABG Geosynthetics exhibited tunnel drainage and lining systems at the World Tunnel Congress in Stockholm. The exhibition ran from May 12 to May 14 and placed the company’s drainage capability before tunnel designers and contractors. ABG is forecast to use such technical events to support specification discussions before tender release.
Key Players in the Excavation Drainage Mats Market
Drainage Mat and Geocomposite Specialists
- NAUE
- ABG Geosynthetics
- Freudenberg Performance Materials
Multi-Application Geosynthetic Providers
- HUESKER
- Maccaferri
- Solmax
Excavation Drainage Mats Market - Report Scope
| Coverage field | Report scope |
|---|---|
| Market breakdown | Mat type, flow capacity, application, end use, sales channel, and region |
| Quantitative Units | Revenue in USD Million, CAGR in % |
| Market Definition | Excavation drainage mats are roll or panel systems used to create drainage paths and maintain workable ground conditions around trenches, foundations, walls, and temporary site access areas. |
| Regions Covered | North America, Latin America, Europe, East Asia, South Asia, Oceania, and Middle East and Africa |
| Countries Covered | United States, China, India, Germany, United Kingdom, Japan, Australia, and additional covered countries |
| Key Companies Profiled | NAUE, HUESKER, Maccaferri, ABG Geosynthetics, Freudenberg Performance Materials, and Solmax |
| Forecast Period | 2026 to 2036 |
| Approach | Hybrid methodology combining bottom-up installation demand checks with top-down infrastructure spending analysis and company portfolio review. |
Source: Future Market Insights - analysis driven by proprietary forecasting models and primary research
Excavation Drainage Mats Market - Research Methodology
| Method | Approach |
|---|---|
| Primary Research | FMI interviews civil contractors and geotechnical consultants alongside utility project teams and rental operators. Discussions test how drainage mats are specified and why substitutions fail during site review. Interviewers examine approval steps and installation constraints before mapping channel behavior. Findings are compared across project roles so specification preferences and service expectations reflect actual excavation workflows instead of assumptions from a single respondent group. |
| Desk Research | Desk research reviews public infrastructure plans and regulator releases alongside official company product information. Analysts track road works and water-network renewal together with utility trench activity. Product literature is checked for mat construction and flow positioning before segment definitions are finalized. Source findings are then reconciled with application scope and sales-channel logic so country analysis stays tied to excavation drainage use rather than broad geosynthetics activity. |
| Market Sizing and Forecasting | FMI sizes the market through a hybrid process that combines supplier revenue checks with project activity and replacement behavior. Bottom-up estimates use mat demand by application and sales channel. Top-down checks compare modeled demand with relevant infrastructure activity and the operating scope of active drainage-product suppliers. Country conditions are reviewed separately before the base forecast is reconciled with segment shares and the expected pace of recurring project purchases. |
| Data Validation | Data validation compares interview findings with official statistics and current manufacturer evidence outside the report tables. Analysts test whether each evidence point directly explains excavation or drainage demand before using it in country or application analysis. Segment shares are checked against installation logic and channel behavior. |
Source: Future Market Insights (FMI) analysis, based on proprietary forecasting model and primary research
Excavation Drainage Mats Market by Segments
Excavation Drainage Mats Market segmented by Mat Type:
- Geocomposite Drainage Mats
- HDPE Drainage Mats
- Rubber Drainage Mats
- Temporary Track Drainage Mats
- Filter Fabric-backed Mats
Excavation Drainage Mats Market segmented by Flow Capacity:
- Low Flow
- Medium Flow
- High Flow
Excavation Drainage Mats Market segmented by Application:
- Trench Dewatering Support
- Slope / Wall Drainage
- Mud Control
- Temporary Site Access
- Foundation Excavations
Excavation Drainage Mats Market segmented by End Use:
- Civil Construction
- Utilities
- Mining / Quarrying
- Roadworks
- Industrial Sites
Excavation Drainage Mats Market segmented by Sales Channel:
- Geosynthetic Distributors
- Rental Providers
- Direct Manufacturer
- Contractor Supply
Excavation Drainage Mats Market by Region:
- North America
- United States
- Canada
- Latin America
- Brazil
- Mexico
- Argentina
- Europe
- Germany
- United Kingdom
- France
- Italy
- Spain
- East Asia
- China
- Japan
- South Korea
- South Asia
- India
- Bangladesh
- Sri Lanka
- Oceania
- Australia
- New Zealand
- Middle East and Africa
- Gulf Cooperation Council Countries
- South Africa
- Türkiye
- Egypt
Research Sources and Bibliography
- NAUE. (2025, February). Pipeline Construction Strategies for Enhanced Protection. NAUE.
- Environment Agency. (2025, March). Environment Agency storm overflow spill data for 2024. Environment Agency.
- Maccaferri. (2025, June). Maccaferri at GeoAsia8: USBRL Project Wins IGS Case Study Competition. Maccaferri.
- NAUE. (2025, September). Naue at EuroGeo8 in Lille. NAUE.
- USA Environmental Protection Agency. (2025, September). Water Funding from the 2025 American Relief Act. USA Environmental Protection Agency.
- USA Census Bureau. (2026, July). Monthly Construction Spending, May 2026. USA Census Bureau.
- USA Environmental Protection Agency. (2026, May). Drinking Water State Revolving Fund (DWSRF). USA Environmental Protection Agency.
- USA Environmental Protection Agency. (2025, November). EPA Announces $7 Billion in Newly Available WIFIA Funding and Five New WIFIA Loan Approvals. USA Environmental Protection Agency.
- State Council of the People’s Republic of China. (2026, June). China to build, upgrade 770,000 km of urban underground pipelines during 2026-2030. State Council of the People’s Republic of China.
- State Council Information Office of the People’s Republic of China. (2026, May). China’s massive infrastructure push targets domestic demand, urban renewal. State Council Information Office of the People’s Republic of China.
- State Council Information Office of the People’s Republic of China. (2025, October). Press conference on guiding principles of fourth plenary session of 20th CPC Central Committee. State Council Information Office of the People’s Republic of China.
- Turpan Municipal People’s Government. (2025, March). 高昌区投资1.2亿元改造城市地下管网. Turpan Municipal People’s Government.
- Press Information Bureau. (2026, June). Infrastructure at the Core of India’s Development. Press Information Bureau.
- Press Information Bureau. (2025, December). Year End Review 2025 - Ministry of Road Transport & Highways. Press Information Bureau.
- Federal Statistical Office. (2026, January). Gross domestic product up 0.2% in 2025. Federal Statistical Office.
- UK Government. (2025, December). Landmark Planning and Infrastructure Bill becomes law. UK Government.
- USA Department of Transportation. (2025, January). FHWA Announces Updates to Buy America Requirements to Promote Domestic Manufacturing. USA Department of Transportation.
- Department of Infrastructure, Transport, Regional Development, Communications, Sport and the Arts. (2025, March). 2025-26 Federal Budget released. Department of Infrastructure, Transport, Regional Development, Communications, Sport and the Arts.
- NAUE. (2025, November). Drainage of Structures for Long-Term Stability. NAUE.
- Maccaferri. (2025, June). Drainage Management using MacDrain at Surat Metro Line, India. Maccaferri.
- ABG Geosynthetics. (2025, June). Tech Note: Embankment Starter Layers. ABG Geosynthetics.
- Sineco International. (2025, April). HUESKER acquisisce Sineco International. Sineco International.
- Solmax. (2025, April). Catchment basin containment system for contaminated surface water at Gollan Recycling GmbH, Germany. Solmax.
- NAUE. (2025, November). Efficient Drainage Solutions for Backfilled Areas in Railway Construction. NAUE.
- USA Department of Transportation. (2025, December). FY 2026 Notice of Funding Opportunity. USA Department of Transportation.
- NAUE. (2026, April). Naue Meets Deutsche Bahn’s HPQ Requirements for Planar Drainage. NAUE.
- Solmax. (2026, May). Texas retailer chooses modern engineering solutions. Solmax.
- ABG Geosynthetics. (2025, May). World Tunnel Congress 2025. ABG Geosynthetics.
- ABG Geosynthetics. (2025, June). Fildrain starter layer installed to deliver carbon saving for new bypass. ABG Geosynthetics.
- Solmax. (2025, May). Resilient rural road construction in Thailand using MIRAFI H2Rx geotextile. Solmax.
- Solmax. (2025, May). Strengthening canal-adjacent road infrastructure in Thailand with MIRAFI H2Rx. Solmax.
- Solmax. (2026, June). Reinforced soil walls maximizing urban developable land. Solmax.
- Freudenberg Performance Materials. (2026, June). Geotextiles for safety, stability, and durability. Freudenberg Performance Materials.
This bibliography is provided for reader reference and uses primary government, standards-body, official trade body, and company sources.
This Report Answers
- What is the excavation drainage mats market value in 2026 and what value is projected by 2036?
- What CAGR is forecast for the excavation drainage mats market from 2026 to 2036?
- Which segments are expected to shape demand across each parent category in the excavation drainage mats market?
- Which wet-site and infrastructure pressures are projected to support purchase activity for excavation drainage mats?
- How do country CAGRs differ across the profiled excavation drainage mats economies?
- Which companies compete across drainage performance and specification support while maintaining suitable service reach?
- What evidence should buyers request when qualifying excavation drainage mats?
- What should civil contractors and engineering teams address before broader sourcing commitments for excavation drainage mats?
- How are claims review and technical documentation expected to affect vendor selection during public infrastructure approval?
Frequently Asked Questions
What is driving growth in the Excavation Drainage Mats Market?
Demand is projected to rise on wet-site access needs and infrastructure renewal. Reusable drainage layers are expected to reduce aggregate handling and keep excavation work fronts usable.
Who are the key players in the Excavation Drainage Mats Market?
Notable companies include NAUE, HUESKER, Maccaferri, ABG Geosynthetics, Freudenberg Performance Materials, and Solmax. Competition centers on drainage performance and field support.
What is a significant restraint in the Excavation Drainage Mats Market?
A significant restraint is uncertainty about flow performance after soil loading. Adoption is anticipated to slow where filter compatibility and installation evidence remain unclear.
Why should infrastructure executives track the Excavation Drainage Mats Market?
Executives should track the market because wet-ground delays affect excavation schedules and site access. Drainage mat selection influences material handling and recovery after heavy rainfall.
What business problem do excavation drainage mats address?
The products create controlled drainage paths around trenches and foundations without relying entirely on thick stone layers. They also help crews manage mud and temporary access conditions.
What should engineering teams evaluate before approving a drainage mat?
Engineering teams should examine flow performance under expected soil pressure and confirm filter compatibility with local fines. Outlet design and connection details should also be reviewed before backfill.
What limits return on investment for contractors and project owners?
Return on investment is expected to weaken when mats are poorly matched to soil conditions or outlet routes. Delayed approvals can also erase installation-time savings.
How do suppliers build long-term account confidence in this market?
Suppliers build confidence by providing clear installation guidance and responsive field support. Repeat orders are expected to depend on consistent drainage performance across changing site conditions.
Preview the report firsthand - request a free sample
Get SampleGet the brochure for pricing and purchase details.
Get PDFTable of Content
- Key Takeaways
- Market Size and CAGR
- Top Growth Driver
- Fastest Growing Segment
- Leading Region
- Key Companies
- Emerging Opportunities
- Executive Summary
- Global Market Outlook
- Demand-side Trends
- Supply-side Trends
- Technology Roadmap Analysis
- Analysis and Recommendations
- Analyst Perspective (What is happening? Why now? What should investors know?)
- Key Questions Answered
- How large is the market?
- What is the CAGR?
- What are key trends?
- Which region dominates?
- Who are the leaders?
- Market Overview
- Market Coverage / Taxonomy
- Market Definition / Scope / Limitations
- Research Methodology
- Chapter Orientation
- Analytical Lens and Working Hypotheses
- Market Structure, Signals, and Trend Drivers
- Benchmarking and Cross-market Comparability
- Market Sizing, Forecasting, and Opportunity Mapping
- Research Design and Evidence Framework
- Desk Research Programme (Secondary Evidence)
- Expert Input and Fieldwork (Primary Evidence)
- Tooling, Models, and Reference Databases
- Data Engineering and Model Build
- Quality Assurance and Audit Trail
- Market Background
- Market Dynamics (Drivers, Restraints, Opportunity, Trends)
- Scenario Forecast (Optimistic, Likely, Conservative)
- Impact Analysis
- AI Impact
- Sustainability Impact
- Regulatory Impact
- Technology Impact
- Consumer / Buyer Analysis
- Purchase Drivers
- Adoption Barriers
- Buyer Journey
- Opportunity Map Analysis
- Product Life Cycle Analysis
- Supply Chain Analysis
- Investment Feasibility Matrix
- Value Chain Analysis
- PESTLE and Porter's Analysis
- Regulatory Landscape
- Regional Parent Market Outlook
- Production and Consumption Statistics
- Import and Export Statistics
- Global Market Analysis and Forecast, 2021 to 2036
- Historical Market Size Value (USD Million) Analysis, 2021 to 2025
- Current and Future Market Size Value (USD Million) Projections, 2026 to 2036
- Y-o-Y Growth Trend Analysis
- Absolute $ Opportunity Analysis
- Global Market Pricing Analysis, 2021 to 2036
- Global Market Analysis and Forecast, By Mat Type, 2021 to 2036
- Introduction / Key Findings
- Historical Market Size Value (USD Million) Analysis By Mat Type, 2021 to 2025
- Current and Future Market Size Value (USD Million) Analysis and Forecast By Mat Type, 2026 to 2036
- Geocomposite Drainage Mats
- HDPE Drainage Mats
- Rubber Drainage Mats
- Temporary Track Drainage Mats
- Filter Fabric-backed Mats
- Geocomposite Drainage Mats
- Y-o-Y Growth Trend Analysis By Mat Type, 2021 to 2025
- Absolute $ Opportunity Analysis By Mat Type, 2026 to 2036
- Global Market Analysis and Forecast, By Flow Capacity, 2021 to 2036
- Introduction / Key Findings
- Historical Market Size Value (USD Million) Analysis By Flow Capacity, 2021 to 2025
- Current and Future Market Size Value (USD Million) Analysis and Forecast By Flow Capacity, 2026 to 2036
- Medium Flow
- Low Flow
- High Flow
- Medium Flow
- Y-o-Y Growth Trend Analysis By Flow Capacity, 2021 to 2025
- Absolute $ Opportunity Analysis By Flow Capacity, 2026 to 2036
- Global Market Analysis and Forecast, By Application, 2021 to 2036
- Introduction / Key Findings
- Historical Market Size Value (USD Million) Analysis By Application, 2021 to 2025
- Current and Future Market Size Value (USD Million) Analysis and Forecast By Application, 2026 to 2036
- Trench Dewatering Support
- Slope - Wall Drainage
- Mud Control
- Temporary Site Access
- Foundation Excavations
- Trench Dewatering Support
- Y-o-Y Growth Trend Analysis By Application, 2021 to 2025
- Absolute $ Opportunity Analysis By Application, 2026 to 2036
- Global Market Analysis and Forecast, By End Use, 2021 to 2036
- Introduction / Key Findings
- Historical Market Size Value (USD Million) Analysis By End Use, 2021 to 2025
- Current and Future Market Size Value (USD Million) Analysis and Forecast By End Use, 2026 to 2036
- Civil Construction
- Utilities
- Mining - Quarrying
- Roadworks
- Industrial Sites
- Civil Construction
- Y-o-Y Growth Trend Analysis By End Use, 2021 to 2025
- Absolute $ Opportunity Analysis By End Use, 2026 to 2036
- Global Market Analysis and Forecast, By Sales Channel, 2021 to 2036
- Introduction / Key Findings
- Historical Market Size Value (USD Million) Analysis By Sales Channel, 2021 to 2025
- Current and Future Market Size Value (USD Million) Analysis and Forecast By Sales Channel, 2026 to 2036
- Geosynthetic Distributors
- Rental Providers
- Direct Manufacturer
- Contractor Supply
- Geosynthetic Distributors
- Y-o-Y Growth Trend Analysis By Sales Channel, 2021 to 2025
- Absolute $ Opportunity Analysis By Sales Channel, 2026 to 2036
- Global Market Analysis and Forecast, By Region, 2021 to 2036
- Introduction
- Historical Market Size Value (USD Million) Analysis By Region, 2021 to 2025
- Current Market Size Value (USD Million) Analysis and Forecast By Region, 2026 to 2036
- North America
- Latin America
- Europe
- East Asia
- South Asia
- Oceania
- Middle East and Africa
- Market Attractiveness Analysis By Region
- North America Market Analysis and Forecast, By Country, 2021 to 2036
- Historical Market Size Value (USD Million) Trend Analysis By Market Taxonomy, 2021 to 2025
- Market Size Value (USD Million) Forecast By Market Taxonomy, 2026 to 2036
- By Country
- United States
- Canada
- By Mat Type
- By Flow Capacity
- By Application
- By End Use
- By Sales Channel
- By Country
- Market Attractiveness Analysis
- By Country
- By Mat Type
- By Flow Capacity
- By Application
- By End Use
- By Sales Channel
- Key Takeaways
- Latin America Market Analysis and Forecast, By Country
- Historical Market Size Value (USD Million) Trend Analysis By Market Taxonomy, 2021 to 2025
- Market Size Value (USD Million) Forecast By Market Taxonomy, 2026 to 2036
- By Country
- Brazil
- Mexico
- Argentina
- By Mat Type
- By Flow Capacity
- By Application
- By End Use
- By Sales Channel
- By Country
- Market Attractiveness Analysis
- By Country
- By Mat Type
- By Flow Capacity
- By Application
- By End Use
- By Sales Channel
- Key Takeaways
- Europe Market Analysis and Forecast, By Country
- Historical Market Size Value (USD Million) Trend Analysis By Market Taxonomy, 2021 to 2025
- Market Size Value (USD Million) Forecast By Market Taxonomy, 2026 to 2036
- By Country
- Germany
- United Kingdom
- France
- Italy
- Spain
- By Mat Type
- By Flow Capacity
- By Application
- By End Use
- By Sales Channel
- By Country
- Market Attractiveness Analysis
- By Country
- By Mat Type
- By Flow Capacity
- By Application
- By End Use
- By Sales Channel
- Key Takeaways
- East Asia Market Analysis and Forecast, By Country
- Historical Market Size Value (USD Million) Trend Analysis By Market Taxonomy, 2021 to 2025
- Market Size Value (USD Million) Forecast By Market Taxonomy, 2026 to 2036
- By Country
- China
- Japan
- South Korea
- By Mat Type
- By Flow Capacity
- By Application
- By End Use
- By Sales Channel
- By Country
- Market Attractiveness Analysis
- By Country
- By Mat Type
- By Flow Capacity
- By Application
- By End Use
- By Sales Channel
- Key Takeaways
- South Asia Market Analysis and Forecast, By Country
- Historical Market Size Value (USD Million) Trend Analysis By Market Taxonomy, 2021 to 2025
- Market Size Value (USD Million) Forecast By Market Taxonomy, 2026 to 2036
- By Country
- India
- Bangladesh
- Sri Lanka
- By Mat Type
- By Flow Capacity
- By Application
- By End Use
- By Sales Channel
- By Country
- Market Attractiveness Analysis
- By Country
- By Mat Type
- By Flow Capacity
- By Application
- By End Use
- By Sales Channel
- Key Takeaways
- Oceania Market Analysis and Forecast, By Country
- Historical Market Size Value (USD Million) Trend Analysis By Market Taxonomy, 2021 to 2025
- Market Size Value (USD Million) Forecast By Market Taxonomy, 2026 to 2036
- By Country
- Australia
- New Zealand
- By Mat Type
- By Flow Capacity
- By Application
- By End Use
- By Sales Channel
- By Country
- Market Attractiveness Analysis
- By Country
- By Mat Type
- By Flow Capacity
- By Application
- By End Use
- By Sales Channel
- Key Takeaways
- Middle East and Africa Market Analysis and Forecast, By Country
- Historical Market Size Value (USD Million) Trend Analysis By Market Taxonomy, 2021 to 2025
- Market Size Value (USD Million) Forecast By Market Taxonomy, 2026 to 2036
- By Country
- Gulf Cooperation Council Countries
- South Africa
- Türkiye
- Egypt
- By Mat Type
- By Flow Capacity
- By Application
- By End Use
- By Sales Channel
- By Country
- Market Attractiveness Analysis
- By Country
- By Mat Type
- By Flow Capacity
- By Application
- By End Use
- By Sales Channel
- Key Takeaways
- Key Countries Market Analysis
- United States
- Pricing Analysis
- Market Share Analysis, 2025
- By Mat Type
- By Flow Capacity
- By Application
- By End Use
- By Sales Channel
- China
- Pricing Analysis
- Market Share Analysis, 2025
- By Mat Type
- By Flow Capacity
- By Application
- By End Use
- By Sales Channel
- India
- Pricing Analysis
- Market Share Analysis, 2025
- By Mat Type
- By Flow Capacity
- By Application
- By End Use
- By Sales Channel
- Germany
- Pricing Analysis
- Market Share Analysis, 2025
- By Mat Type
- By Flow Capacity
- By Application
- By End Use
- By Sales Channel
- United Kingdom
- Pricing Analysis
- Market Share Analysis, 2025
- By Mat Type
- By Flow Capacity
- By Application
- By End Use
- By Sales Channel
- Japan
- Pricing Analysis
- Market Share Analysis, 2025
- By Mat Type
- By Flow Capacity
- By Application
- By End Use
- By Sales Channel
- Australia
- Pricing Analysis
- Market Share Analysis, 2025
- By Mat Type
- By Flow Capacity
- By Application
- By End Use
- By Sales Channel
- United States
- Market Structure Analysis
- Competition Dashboard
- Competition Benchmarking
- Market Share Analysis of Top Players
- By Regional
- By Mat Type
- By Flow Capacity
- By Application
- By End Use
- By Sales Channel
- Emerging Startups
- Innovation Benchmarking
- Competition Analysis
- Competition Deep Dive
- NAUE
- Overview
- Product Portfolio
- Profitability by Market Segments (Product/Region/Sales Channel)
- Sales Footprint
- Strategy Overview
- Marketing Strategy
- Product Strategy
- Channel Strategy
- HUESKER
- Maccaferri
- ABG Geosynthetics
- Freudenberg Performance Materials
- Solmax
- NAUE
- Case Studies
- Success Stories
- Recent Developments
- Competition Deep Dive
- Assumptions & Acronyms Used


