Reports

- Global Locations -

Headquarters

Future Market Insights, Inc.

Christiana Corporate, 200
Continental Drive, Suite 401,
Newark, Delaware - 19713,
United States

T: +1-845-579-5705

Americas

Future Market Insights, Inc.

616 Corporate Way, Suite 2-9018,
Valley Cottage, NY 10989, United States

T: +1-347-918-3531

MEA

Future Market Insights

1602-6 Jumeirah Bay X2 Tower, Plot No: JLT-PH2-X2A,
Jumeirah Lakes Towers, Dubai,
United Arab Emirates

Europe

Future Market Insights

3rd Floor, 207 Regent Street,
W1B 3HH London
United Kingdom

T: + 44 (0) 20 8123 9659
D: +44 (0) 20 3287 4268

Asia Pacific

Future Market Insights

IndiaLand Global Tech Park, Unit UG-1, Behind Grand HighStreet, Phase 1, Hinjawadi, MH, Pune – 411057, India

Exosomes Diagnostic and Therapeutic Market Snapshot

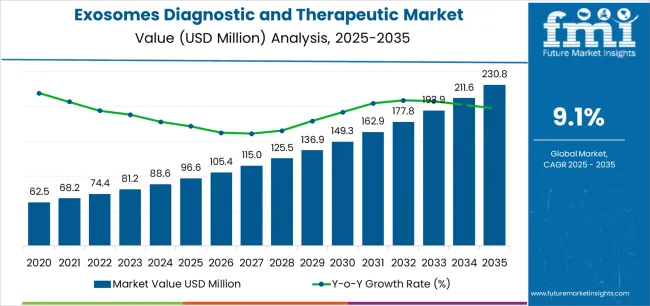
[229 Pages Report] The Exosomes Diagnostic and Therapeutic Market is estimated at USD 58.6 million in 2022 and is projected to reach USD 175.4 million by 2028, growing at a CAGR of 20.0% during the forecast period (2022-2028).

Market Outlook:

Data Points Market Insights
Market Value 2021 US$ 46.7 million
Market Value 2028 US$ 175.4 million
CAGR 2022-2028 20.0%
Market Share of Top 5 Countries 75.3%

Don't pay for what you don't need

Customize your report by selecting specific countries or regions and save 30%!

How The Market Progressed Till June 2022?

Particulars Details
H1, 2021 22.28%
H1, 2022 Projected 20.04%
H1, 2022 Outlook 19.94%
BPS Change - H1, 2022 (O) – H1, 2022 (P) (-) 10 ↓
BPS Change – H1, 2022 (O) – H1, 2021 (-) 234 ↓

The global exosome diagnostic and therapeutic market development is conditional, and influenced by regulatory approvals by the EMA, the U.S. FDA, CE and other regulatory authorities, in accordance with impact of macro and industry factors. Key developments in this market include the potential of exosomes as diagnostic biomarkers and in targeted drug delivery for oncology and neurodegenerative disorders.

FMI presents a comparative analysis about the market growth rates and development prospects in the global exosome diagnostic and therapeutic market. As per Future Market Insights’ analysis, the exosome diagnostic and therapeutic market is expected to dip by 234 Basis Point Share (BPS) in H1 2022 period in comparison to H1-2021.

Additionally, the variation between the BPS values observed within the market in H1, 2022 - Outlook over H1, 2022 Projected reflects a decline of 10 units Major reasons for this fall in BPS are attributed to inefficient exosome separation, characterization difficulties, and lack of high-resolution visualization techniques.

Lack of compiled data to diagnose diseases based on exosomes is another practical clinical limitation to the market.  Other market segments are set to perform fairly and attain promising growth prospects in the next half of projection period, however the growth is set to display a slow graduation.

Additionally, there are some beneficial points that impact the industry growth, including studies on exosome biogenesis pathways to inhibit disease derived exosomes and using exosomes as delivery vehicles for therapeutic treatments.

Sales Analysis of Exosomes diagnostic and therapeutic from 2012 to 2021 Vs Market Outlook for 2022 to 2028

The exosomes diagnostic and therapeutic market holds around 1.6% of the overall US$ 2.9 Bn Liquid Biosy market in 2021.

The global exosomes diagnostic and therapeutic market is primarily driven by the rising prevalence of chronic diseases, such as neurodegenerative disorders, cancer, autoimmune diseases, etc., and the subsequent growth of production of drugs and drug delivery technologies with diagnostic assays for such chronic ailments.

The advancements in development of genotype and phenotype-specific drug assays by pharmaceutical manufacturers have further increased focus on development of new drug delivery systems, thus propelling the growth of exosomes diagnostic and therapeutic market.

The potential applications of biomarkers in cancer diagnostics and their role in the development of translational precision medicine is set to invoke the novel uses of exosomes in advanced therapeutic and diagnostic research.

Rising demand for differential tests for diagnosis and screening of chronic diseases and the high therapeutic potential of exosomes in cancer diagnostics is perceived as a key factor in the growth enhancement of exosomes diagnostic and therapeutic market.

Moreover, there resides an urgent need for non-invasive diagnostic tests for certain types of cancers, and the potential applications of exosomes provides a lucrative opportunity of alternative diagnosis, as compared to the presently approved invasive diagnostic methods.

Exosome Diagnostic and Therapeutics Market

There are few blood tests for diagnosis of prion diseases, such as fatal neurodegenerative infectious disease, which poses a major public health concern, as the disease can spread through transmission of blood. The applications of exosome for diseases associated form of prion protein has vast implications in disease detection, and is thus a contributing factor to the growth of exosomes diagnostic and therapeutic market.

The global exosomes diagnostic and therapeutic market expanded at 18.7% CAGR over the past 9 years from 2012 to 2021. The market is expected to expand at a considerable growth rate over the next six years at a CAGR of close to 20.0%.

What are the Key Opportunities for Exosomes diagnostic and therapeutic Manufacturers?

Because of the cost containment factor in healthcare in majority of mature markets, many hospital-based laboratories are experiencing coercion to provide services with a reduced cost. Since the prevalence of chronic diseases is increasing globally in combination with the rising geriatric population, healthcare facilities are witnessing a rise in patient footfall.

To mitigate the increasing service rate at reduced costs, majority of laboratories have begun to adopt solutions integrated with informatics, thus availing increased productivity within current resource availability.

To further support this approach, manufacturers in the exosomes diagnostic and therapeutic market have managed to uptake an opportunistic approach of providing such healthcare facilities with complementary services and support in terms of diagnostic tests products, thus contributing to the growth of the market over the forecast period.

Additionally, the advent of non-invasive methods of cancer diagnosis through optical analysis and the introduction of biophotonics utilizing field carcinogenesis is set to promote the detection of early precancerous changes in the affected organ.

This provides the key manufacturers with an opportunity to develop non-invasive tests for diagnosis of cancer as well as maintain partnerships with academic institutes to work on development of novel non-invasive diagnostics, thus behaving as a contributing factor for market growth throughout the forecast period.

Sabyasachi Ghosh
Sabyasachi Ghosh

Principal Consultant

Talk to Analyst

Find your sweet spots for generating winning opportunities in this market.

What are the Factors Restraining Demand for Exosomes diagnostic and therapeutic?

The factors restraining the growth of exosomes diagnostic and therapeutic market include the lack of standardized purification protocols for a validated panel of exosome, given the list of biomarkers in the field of diagnostics is expanding persistently. Moreover, the lack of validation of revised panel of exosomes is also posing as a restrictive factor for development of exosomes diagnostic and therapeutic market.

Although the exosomes diagnostic and therapeutic market is at a nascent stage of development, the majority of existing products available in the market are based only for research purpose while some reagents and kits available have proprietary laboratory analysis tests applications.

The lack of approved products in exosomes diagnostic and therapeutic market over the globe, thus, stands as a restraint to the growth of the market, despite high-value propositions of molecular diagnostics for cancer. This is due to insufficient cost coverage and high cost associated test procedures of such diagnostic tests on patients with chronic ailments.

Moreover, the development of superior instruments (for instance, the exosome isolation columns and analytical instruments for the laboratory analysis of cancer specimens) requires large monetary investment, which is one of the key factors responsible for hindering the growth of the exosomes diagnostic and therapeutic market.

Exosomes Diagnostic and Therapeutic Market - Country-wise Insights

What Makes the U.S. the Largest Market for Exosomes diagnostic and therapeutic?

The U.S. dominates the North American region with a total market share of nearly 89.1% in 2021, and is projected to continue experiencing high growth throughout the forecast period. The growth of exosomes diagnostic and therapeutic market in this region is driven by advanced healthcare systems, along with increasing funding for research and development in the country.

Why is Germany Considered a Lucrative Segment for Exosomes diagnostic and therapeutic Market in Western Europe?

Germany exhibited a Y-O-Y growth of nearly 26.4% in the Western Europe exosomes diagnostic and therapeutic market in 2021 and is expected to hold a market value share of 48.4% by the end of 2028. The growth is associated with the rapid concentration of research activities in the applications of exosomes for accessing therapeutic effects of stem cells in the country. This growth was driven by the rising incidence of cancer in the country, and the demand for advanced diagnostic assays for the same.

What Makes China an Emerging Country for Exosomes diagnostic and therapeutic Market?

China holds 42.6% share in the APEJ market in 2021, and is projected to grow at a lucrative rate during the forecast period. The growth of the exosomes diagnostic and therapeutic market in the country is attributed to the rise of clinically studied and observed applications of exosomes as smart nano-platforms for diagnosis and therapy in the country.

Get the data you need at a Fraction of the cost

Personalize your report by choosing insights you need
and save 40%!

Exosomes Diagnostic and Therapeutic Market - Category-wise Insights

Which Exosomes diagnostic and therapeutic Product is Driving Market Growth?

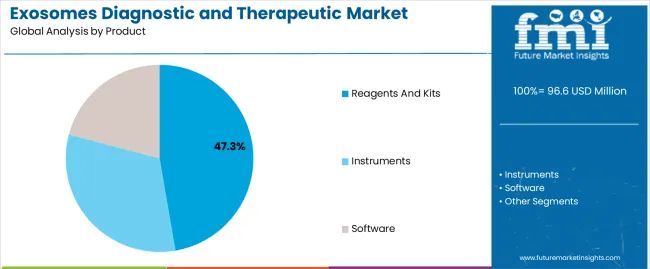
Reagents and kits project a lucrative growth at a CAGR of 23.8% till the end of the forecast period, with the current market share of around 56.0% in 2021. This dominant market value is associated with the rising research and development activities in non-invasive diagnostic assays due to increasing clinical studies, proving the efficiency of use of exosomes in detection and diagnosis of chronic diseases, primarily cancer.

Which Application of Exosomes diagnostic and therapeutic is considered to be Widely Adopted?

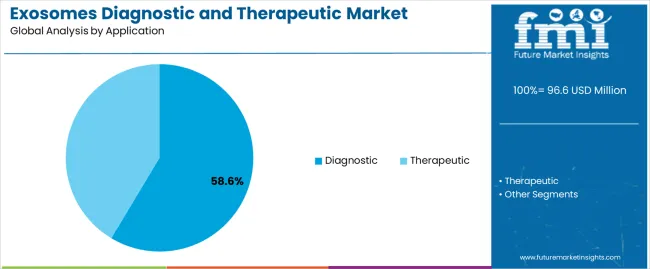
Diagnostic applications are largely adopted in the exosomes diagnostic and therapeutic market and hold a revenue share of 71.1% in 2021 and are projected to hold a share over the forecast period with the estimation being 69.4%. The reduced value trend is associated with the development of therapeutic agents through clinical evaluations assisted by using novel exosome biomarkers in disease detection.

Which End User Shows Higher Implementation in Exosomes diagnostic and therapeutic market?

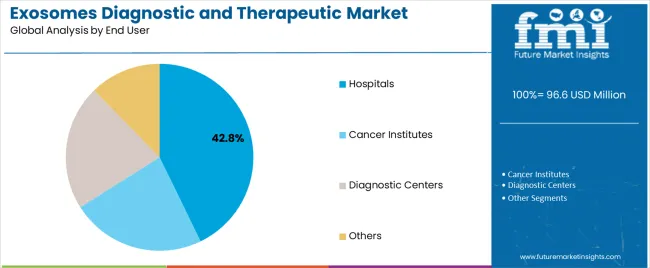
Diagnostic centers hold current global exosomes diagnostic and therapeutic market value share of 35.7% in 2021, and are projected to achieve an estimate market share value of 44.8% by the end of the forecast period. With new product launches by key manufacturers and the introduction of novel diagnostic assay kits, there have increased access to non-invasive and efficient methods for disease detection and diagnosis. Thus, giving a nudge to diagnostic centers for greater value in terms of global market share throughout the forecast period.

Exosomes Diagnostic and Therapeutic Market - Competitive Landscape

Key players in the exosomes diagnostic and therapeutic market utilize strategies involving management of their manufacturing operations through countries which offer lower manufacturing costs, development of novel diagnostic tests for diseases such as neurodegenerative disorders like Alzheimer’s, and acquisition, development and monetization of mature clinical-stage breakthrough technologies. 

  • In April 2021, Thermo Fisher Scientific launched the Thermo Scientific KingFisher Apex Purification System, a high-throughput sample purification instrument designed for scientists who need to automate the extraction of DNA, RNA, proteins and cells from an array of sample types. The system aids in simplifying and automating the sample preparation workflow to help improve research productivity and drive new discovery, especially for those working with high-value samples such as circulating tumor cells, T-cells and exosomes.
  • In March 2021, Bio-Techne Corporation announced that Exosome Diagnostics, a Bio-Techne brand, completed its clinical validation of an in vitro diagnostic (IVD) version of the ExoDx™ Prostate test (EPI) kit enabling self-certification as CE-IVD as of March 22, 2021.

Similarly, recent developments related to companies manufacturing exosomes diagnostic and therapeutic services and technologies have been tracked by the team at Future Market Insights, which are available in the full report.

Report Scope as per Exosomes diagnostic and therapeutic Industry Analysis

Attribute Details
Forecast Period 2022 to 2028
Historical Data Available for 2012 to 2021
Exosomes Diagnostic and Therapeutic Market Analysis US$ Mn for Value
Key Regions Covered North America, Latin America, Western Europe, Eastern Europe, APEJ, Japan and Middle East and Africa
Exosomes Diagnostic and Therapeutic Market Key Countries Covered USA, Canada,  Brazil,  Mexico, Germany, UK, France, Italy, Spain, Russia, Poland, China, Japan, India, ASEAN, Australia, New Zealand, South Africa and GCC Countries
Exosomes Diagnostic and Therapeutic Market Key Market Segments Covered Product Type, Application, End User and Region
Key Companies Profiled
  • Thermo Fisher Scientific
  • NanoSomix
  • NX Pharmagen
  • Malvern Instruments
  • Capricor Therapeutic
  • Exosome Diagnostics
  • Exiqon A/S
  • System Biosciences
  • Exosome Sciences
  • Aegle Therapeutic
  • AMS Biotechnology
  • Miltenyi Biotec
  • Codiak BioSciences Inc.
  • Lonza Group (HansaBioMed Life Sciences Ltd.)
Pricing Available upon Request

Key Market Segments Covered in Exosomes diagnostic and therapeutic Market Research

By Product :

  • Instruments
  • Software
  • Reagents & Kits

By Application :

  • Diagnostics
  • Therapeutic

By End User :

  • Hospitals
  • Cancer Institutes
  • Diagnostic Centers
  • Others

By Region :

  • North America
  • Latin America
  • Western Europe
  • Eastern Europe
  • APEJ
  • Japan
  • MEA

Frequently Asked Questions

What is the Projected Market Value of the Exosome Diagnostic and Therapeutics Market in 2028?

The market is projected to reach US$ 175.4 million in 2028.

What is the Expected CAGR for the Exosome Diagnostic and Therapeutics Market through 2028?

The market is expected to develop at a CAGR of 10% through 2028.

What Makes the United States the Prominent Market?

With a total market share of 90.1%, the United States leads North America’s market.

Which is an Investment-worthy Country in the Western Europe market?

Germany is to hold a market value share of 48.4% by the end of 2028.

What Makes China an Emerging Country in the Market?

China grabs 42.6% of Asia Pacific Excluding Japan Market.

Table of Content

1. Executive Summary

    1.1. Overview

    1.2. Market Analysis

    1.3. FMI Analysis and Recommendations

    1.4. Wheel of Fortune

2. Market Introduction

    2.1. Market Taxonomy

    2.2. Market Definition

    2.3. Global Economic Outlook

3. Exosome Diagnostic and Therapeutic Market View Point Analysis

    3.1. Macro-Economic Factors

    3.2. Drivers

    3.3. Restraints

    3.4. Opportunity Analysis

    3.5. Trends

4. North America Exosome Diagnostic and Therapeutic Market Analysis 2012–2021 and Forecast 2022–2028

    4.1. Introduction

    4.2. Historical Market Size (US$ Mn) Trend Analysis By Country, 2012–2021

        4.2.1. U.S.

        4.2.2. Canada

    4.3. Market Size (US$ Mn) Forecast By Country, 2022–2028

        4.3.1. U.S.

        4.3.2. Canada

    4.4. Historical Market Size (US$ Mn) Analysis By Product, 2012–2021

        4.4.1. Instrument

        4.4.2. Software

        4.4.3. Reagent

    4.5. Market Size (US$ Mn) Forecast By Product, 2022–2028

        4.5.1. Instrument

        4.5.2. Software

        4.5.3. Reagent

    4.6. Historical Market Size (US$ Mn) Trend Analysis By Application, 2012–2021

        4.6.1. Diagnostic

        4.6.2. Therapeutic

    4.7. Market Size (US$ Mn) Forecast By Application, 2022–2028

        4.7.1. Diagnostic

        4.7.2. Therapeutic

    4.8. Historical Market Size (US$ Mn) Trend Analysis By End User, 2012–2021

        4.8.1. Hospitals

        4.8.2. Cancer Institutes

        4.8.3. Diagnostic Centers

        4.8.4. Others

    4.9. Market Size (US$ Mn) Forecast By End User, 2022–2028

        4.9.1. Hospitals

        4.9.2. Cancer Institutes

        4.9.3. Diagnostic Centers

        4.9.4. Others

    4.10. Drivers and Restraints: Impact Analysis

    4.11. Market Attractiveness Analysis

        4.11.1. By Country

        4.11.2. By Product

        4.11.3. By Application

        4.11.4. By End User

5. Latin America Exosome Diagnostic and Therapeutic Market Analysis 2012–2021 and Forecast 2022–2028

    5.1. Introduction

    5.2. Historical Market Size (US$ Mn) Trend Analysis By Country, 2012–2021

        5.2.1. Brazil

        5.2.2. Mexico

        5.2.3. Rest of Latin America

    5.3. Market Size (US$ Mn) Forecast By Country, 2022–2028

        5.3.1. Brazil

        5.3.2. Mexico

        5.3.3. Rest of Latin America

    5.4. Historical Market Size (US$ Mn) Analysis By Product, 2012–2021

        5.4.1. Instrument

        5.4.2. Software

        5.4.3. Reagent

    5.5. Market Size (US$ Mn) and Volume Forecast By Product , 2022–2028

        5.5.1. Instrument

        5.5.2. Software

        5.5.3. Reagent

    5.6. Historical Market Size (US$ Mn) Trend Analysis By Application, 2012–2021

        5.6.1. Diagnostic

        5.6.2. Therapeutic

    5.7. Market Size (US$ Mn) Forecast By Application, 2022–2028

        5.7.1. Diagnostic

        5.7.2. Therapeutic

    5.8. Historical Market Size (US$ Mn) Trend Analysis By End User, 2012–2021

        5.8.1. Hospitals

        5.8.2. Cancer Institutes

        5.8.3. Diagnostic Centers

        5.8.4. Others

    5.9. Market Size (US$ Mn) Forecast By End User, 2022–2028

        5.9.1. Hospitals

        5.9.2. Cancer Institutes

        5.9.3. Diagnostic Centers

        5.9.4. Others

    5.10. Drivers and Restraints: Impact Analysis

    5.11. Market Attractiveness Analysis

        5.11.1. By Country

        5.11.2. By Product

        5.11.3. By Application

        5.11.4. By End User

6. Western Europe Exosome Diagnostic and Therapeutic Market Analysis 2012–2021 and Forecast 2022–2028

    6.1. Introduction

    6.2. Historical Market Size (US$ Mn) Trend Analysis By Country, 2012–2021

        6.2.1. Germany

        6.2.2. Italy

        6.2.3. France

        6.2.4. Spain

        6.2.5. U.K.

        6.2.6. Rest of Western Europe

    6.3. Market Size (US$ Mn) Forecast By Country, 2022–2028

        6.3.1. Germany

        6.3.2. Italy

        6.3.3. France

        6.3.4. Spain

        6.3.5. U.K.

        6.3.6. Rest of Western Europe

    6.4. Historical Market Size (US$ Mn) Analysis By Product, 2012–2021

        6.4.1. Instrument

        6.4.2. Software

        6.4.3. Reagent

    6.5. Market Size (US$ Mn) Forecast By Product, 2022–2028

        6.5.1. Instrument

        6.5.2. Software

        6.5.3. Reagent

    6.6. Historical Market Size (US$ Mn) Trend Analysis By Application, 2012–2021

        6.6.1. Diagnostic

        6.6.2. Therapeutic

    6.7. Market Size (US$ Mn) Forecast By Application, 2022–2028

        6.7.1. Diagnostic

        6.7.2. Therapeutic

    6.8. Historical Market Size (US$ Mn) Trend Analysis By End User, 2012–2021

        6.8.1. Hospitals

        6.8.2. Cancer Institutes

        6.8.3. Diagnostic Centers

        6.8.4. Others

    6.9. Market Size (US$ Mn) Forecast By End User, 2022–2028

        6.9.1. Hospitals

        6.9.2. Cancer Institutes

        6.9.3. Diagnostic Centers

        6.9.4. Others

    6.10. Drivers and Restraints: Impact Analysis

    6.11. Market Attractiveness Analysis

        6.11.1. By Country

        6.11.2. By Product

        6.11.3. By Application

        6.11.4. By End User

7. Eastern Europe Exosome Diagnostic and Therapeutic Market Analysis 2012–2021 and Forecast 2022–2028

    7.1. Introduction

    7.2. Historical Market Size (US$ Mn) Trend Analysis By Country, 2012–2021

        7.2.1. Russia

        7.2.2. Poland

        7.2.3. Rest of Eastern Europe

    7.3. Market Size (US$ Mn) Forecast By Country, 2022–2028

        7.3.1. Russia

        7.3.2. Poland

        7.3.3. Rest of Eastern Europe

    7.4. Historical Market Size (US$ Mn) Analysis By Product, 2012–2021

        7.4.1. Instrument

        7.4.2. Software

        7.4.3. Reagent

    7.5. Market Size (US$ Mn) Forecast By Product, 2022–2028

        7.5.1. Instrument

        7.5.2. Software

        7.5.3. Reagent

    7.6. Historical Market Size (US$ Mn) Trend Analysis By Application, 2012–2021

        7.6.1. Diagnostic

        7.6.2. Therapeutic

    7.7. Market Size (US$ Mn) Forecast By Application, 2022–2028

        7.7.1. Diagnostic

        7.7.2. Therapeutic

    7.8. Historical Market Size (US$ Mn) Trend Analysis By End User, 2012–2021

        7.8.1. Hospitals

        7.8.2. Cancer Institutes

        7.8.3. Diagnostic Centers

        7.8.4. Others

    7.9. Market Size (US$ Mn) Forecast By End User, 2022–2028

        7.9.1. Hospitals

        7.9.2. Cancer Institutes

        7.9.3. Diagnostic Centers

        7.9.4. Others

    7.10. Drivers and Restraints: Impact Analysis

    7.11. Market Attractiveness Analysis

        7.11.1. By Country

        7.11.2. By Product

        7.11.3. By Application

        7.11.4. By End User

8. Asia Pacific excluding Japan Exosome Diagnostic and Therapeutic Market Analysis 2012–2021 and Forecast 2022–2028

    8.1. Introduction

    8.2. Historical Market Size (US$ Mn) Trend Analysis By Country, 2012–2021

        8.2.1. China

        8.2.2. India

        8.2.3. Australia and New Zealand

        8.2.4. Rest of APEJ

    8.3. Market Size (US$ Mn) Forecast By Country, 2022–2028

        8.3.1. China

        8.3.2. India

        8.3.3. Australia and New Zealand

        8.3.4. Rest of APEJ

    8.4. Historical Market Size (US$ Mn) Analysis By Product, 2012–2021

        8.4.1. Instrument

        8.4.2. Software

        8.4.3. Reagent

    8.5. Market Size (US$ Mn) Forecast By Product, 2022–2028

        8.5.1. Instrument

        8.5.2. Software

        8.5.3. Reagent

    8.6. Historical Market Size (US$ Mn) Trend Analysis By Application, 2012–2021

        8.6.1. Diagnostic

        8.6.2. Therapeutic

    8.7. Market Size (US$ Mn) Forecast By Application, 2022–2028

        8.7.1. Diagnostic

        8.7.2. Therapeutic

    8.8. Historical Market Size (US$ Mn) Trend Analysis By End User, 2012–2021

        8.8.1. Hospitals

        8.8.2. Cancer Institutes

        8.8.3. Diagnostic Centers

        8.8.4. Others

    8.9. Market Size (US$ Mn) Forecast By End User, 2022–2028

        8.9.1. Hospitals

        8.9.2. Cancer Institutes

        8.9.3. Diagnostic Centers

        8.9.4. Others

    8.10. Drivers and Restraints: Impact Analysis

    8.11. Market Attractiveness Analysis

        8.11.1. By Country

        8.11.2. By Product

        8.11.3. By Application

        8.11.4. By End User

9. Japan Exosome Diagnostic and Therapeutic Market Analysis 2012–2021 and Forecast 2022–2028

    9.1. Introduction

    9.2. Historical Market Size (US$ Mn) Analysis By Product, 2012–2021

        9.2.1. Instrument

        9.2.2. Software

        9.2.3. Reagent

    9.3. Market Size (US$ Mn) Forecast By Product, 2022–2028

        9.3.1. Instrument

        9.3.2. Software

        9.3.3. Reagent

    9.4. Historical Market Size (US$ Mn) Trend Analysis By Application, 2012–2021

        9.4.1. Diagnostic

        9.4.2. Therapeutic

    9.5. Market Size (US$ Mn) Forecast By Application, 2022–2028

        9.5.1. Diagnostic

        9.5.2. Therapeutic

    9.6. Historical Market Size (US$ Mn) Trend Analysis By End User, 2012–2021

        9.6.1. Hospitals

        9.6.2. Cancer Institutes

        9.6.3. Diagnostic Centers

        9.6.4. Others

    9.7. Market Size (US$ Mn) Forecast By End User, 2022–2028

        9.7.1. Hospitals

        9.7.2. Cancer Institutes

        9.7.3. Diagnostic Centers

        9.7.4. Others

    9.8. Drivers and Restraints: Impact Analysis

    9.9. Market Attractiveness Analysis

        9.9.1. By Product

        9.9.2. By Application

        9.9.3. By End User

10. Middle East & Africa Exosome Diagnostic and Therapeutic Market Analysis 2012–2021 and Forecast 2022–2028

    10.1. Introduction

    10.2. Historical Market Size (US$ Mn) Trend Analysis By Country, 2012–2021

        10.2.1. GCC Countries

        10.2.2. South Africa

        10.2.3. Rest of MEA

    10.3. Market Size (US$ Mn) Forecast By Country, 2022–2028

        10.3.1. GCC Countries

        10.3.2. South Africa

        10.3.3. Rest of MEA

    10.4. Historical Market Size (US$ Mn) Analysis By Product, 2012–2021

        10.4.1. Instrument

        10.4.2. Software

        10.4.3. Reagent

    10.5. Market Size (US$ Mn) Forecast By Product, 2022–2028

        10.5.1. Instrument

        10.5.2. Software

        10.5.3. Reagent

    10.6. Historical Market Size (US$ Mn) Trend Analysis By Application, 2012–2021

        10.6.1. Diagnostic

        10.6.2. Therapeutic

    10.7. Market Size (US$ Mn) Forecast By Application, 2022–2028

        10.7.1. Diagnostic

        10.7.2. Therapeutic

    10.8. Historical Market Size (US$ Mn) Trend Analysis By End User, 2012–2021

        10.8.1. Hospitals

        10.8.2. Cancer Institutes

        10.8.3. Diagnostic Centers

        10.8.4. Others

    10.9. Market Size (US$ Mn) Forecast By End User, 2022–2028

        10.9.1. Hospitals

        10.9.2. Cancer Institutes

        10.9.3. Diagnostic Centers

        10.9.4. Others

    10.10. Drivers and Restraints: Impact Analysis

    10.11. Market Attractiveness Analysis

        10.11.1. By Country

        10.11.2. By Product

        10.11.3. By Application

        10.11.4. By End User

11. Forecast Factors: Relevance and Impact

12. Forecast Assumptions

13. Competition Landscape

    13.1. Competition Dashboard

    13.2. Company Profiles (Details – Overview, Financials, Strategy, SWOT, Recent Developments)

        13.2.1. Thermo Fisher Scientific, Inc.

        13.2.2. NanoSomix, Inc.

        13.2.3. NX PHARMAGEN

        13.2.4. Malvern Instruments Ltd

        13.2.5. Capricor Therapeutic, Inc.

        13.2.6. Exosome Diagnostics, Inc.

        13.2.7. Exiqon A/S (Aethlon Medical, Inc.)

        13.2.8. System Biosciences, Inc.

        13.2.9. Aegle Therapeutic

        13.2.10. AMS Biotechnology (Europe) Limited

        13.2.11. Miltenyi Biotec

        13.2.12. Codiak BioSciences Inc.

        13.2.13. Lonza Group (HansaBioMed Life Sciences Ltd.)

        13.2.14. Exosome Sciences

14. Global Exosome Diagnostic and Therapeutic Market Analysis 2012–2021 and Forecast 2022–2028, By Region

    14.1. Introduction/Key Findings

    14.2. Historical Market Size (US$ Mn) Trend Analysis By Region, 2012–2021

        14.2.1. North America

        14.2.2. Latin America

        14.2.3. Western Europe

        14.2.4. Eastern Europe

        14.2.5. Asia Pacific excluding Japan

        14.2.6. Japan

        14.2.7. Middle East & Africa

    14.3. Market Size (US$ Mn) Forecast By Region, 2022–2028

        14.3.1. North America

        14.3.2. Latin America

        14.3.3. Western Europe

        14.3.4. Eastern Europe

        14.3.5. Asia Pacific excluding Japan

        14.3.6. Japan

        14.3.7. Middle East & Africa

    14.4. Market Attractiveness Analysis By Region

15. Global Exosome Diagnostic and Therapeutic Market Analysis 2012–2021 and Forecast 2022–2028, By Product

    15.1. Introduction/Key Findings

    15.2. Historical Market Size (US$ Mn) and Volume Analysis By Product , 2012–2021

        15.2.1. Instrument

        15.2.2. Software

        15.2.3. Reagent

    15.3. Market Size (US$ Mn) Forecast By Product, 2022–2028

        15.3.1. Instrument

        15.3.2. Software

        15.3.3. Reagent

    15.4. Market Attractiveness Analysis By Product

16. Global Exosome Diagnostic and Therapeutic Market Analysis 2012–2021 and Forecast 2022–2028, By Application

    16.1. Introduction/Key Findings

    16.2. Historical Market Size (US$ Mn) Trend Analysis By Application, 2012–2021

        16.2.1. Diagnostic

        16.2.2. Therapeutic

    16.3. Market Size (US$ Mn) Forecast By Application, 2022–2028

        16.3.1. Diagnostic

        16.3.2. Therapeutic

    16.4. Market Attractiveness Analysis By Application

17. Global Exosome Diagnostic and Therapeutic Market Analysis 2012–2021 and Forecast 2022–2028, By End User

    17.1. Introduction/Key Findings

    17.2. Historical Market Size (US$ Mn) Trend Analysis By End User, 2012–2021

        17.2.1. Hospitals

        17.2.2. Cancer Institutes

        17.2.3. Diagnostic Centers

        17.2.4. Others

    17.3. Market Size (US$ Mn) Forecast By End User, 2022–2028

        17.3.1. Hospitals

        17.3.2. Cancer Institutes

        17.3.3. Diagnostic Centers

        17.3.4. Others

    17.4. Market Attractiveness Analysis By End User

18. Global Exosome Diagnostic and Therapeutic Market Analysis 2012–2021 and Forecast 2022–2028

    18.1. Market Size and Y-o-Y Growth

    18.2. Absolute $ Opportunity

19. Research Methodology

Don't pay for what you don't need

Customize your report by selecting specific countries or regions and save 30%!

List of Tables

Table 01: North Exosome Diagnostic and Therapeutic Market Size (US$ Mn) Analysis 2012-2021 and Forecast 2022-2028, By Country

Table 02: North America Exosome Diagnostic and Therapeutic Market Size (US$ Mn) Analysis 2012-2021 and Forecast 2022-2028, By Product

Table 03: North America Exosome Diagnostic and Therapeutic Market Size (US$ Mn) Analysis 2012-2021 and Forecast 2022-2028, By Application

Table 04: North America Exosome Diagnostic and Therapeutic Market Size (US$ Mn) Analysis 2012-2021 and Forecast 2022-2028, By End User

Table 05: Latin America Exosome Diagnostic and Therapeutic Market Size (US$ Mn) Analysis 2012-2021 and Forecast 2022-2028, By Country

Table 06: Latin America Exosome Diagnostic and Therapeutic Market Size (US$ Mn) Analysis 2012-2021 and Forecast 2022-2028, By Product

Table 07: Latin America Exosome Diagnostic and Therapeutic Market Size (US$ Mn) Analysis 2012-2021 and Forecast 2022-2028, By Application

Table 08: Latin America Exosome Diagnostic and Therapeutic Market Size (US$ Mn) Analysis 2012-2021 and Forecast 2022-2028, By End User

Table 09: Western Europe Exosome Diagnostic And Therapeutic Market Size (US$ Mn) Analysis 2012-2021 and Forecast 2022-2028, By Country

Table 10: Western Europe Exosome Diagnostic and Therapeutic Market Size (US$ Mn) Analysis 2012-2021 and Forecast 2022-2028, By Product

Table 11: Western Europe Exosome Diagnostic and Therapeutic Market Size (US$ Mn) Analysis 2012-2021 and Forecast 2022-2028, By Application

Table 12: Western Europe Exosome Diagnostic and Therapeutic Market Size (US$ Mn) Analysis 2012-2021 and Forecast 2022-2028, By End User

Table 13: Eastern Europe Exosome Diagnostic and Therapeutic Market Size (US$ Mn) Analysis 2012-2021 and Forecast 2022-2028, By Country

Table 14: Eastern Europe Exosome Diagnostic and Therapeutic Market Size (US$ Mn) Analysis 2012-2021 and Forecast 2022-2028, By Product

Table 15: Eastern Europe Exosome Diagnostic and Therapeutic Market Size (US$ Mn) Analysis 2012-2021 and Forecast 2022-2028, By Application

Table 16: Eastern Europe Exosome Diagnostic and Therapeutic Market Size (US$ Mn) Analysis 2012-2021 and Forecast 2022-2028, By End User

Table 17: APEJ Exosome Diagnostic and Therapeutic Market Size (US$ Mn) Analysis 2012-2021 and Forecast 2022-2028, By Country

Table 18: APEJ Exosome Diagnostic and Therapeutic Market Size (US$ Mn) Analysis 2012-2021 and Forecast 2022-2028, By Product

Table 19: APEJ Exosome Diagnostic and Therapeutic Market Size (US$ Mn) Analysis 2012-2021 and Forecast 2022-2028, By Application

Table 20: APEJ Exosome Diagnostic and Therapeutic Market Size (US$ Mn) Analysis 2012-2021 and Forecast 2022-2028, By End User

Table 21: Japan Exosome Diagnostic and Therapeutic Market Size (US$ Mn) Analysis 2012-2021 and Forecast 2022-2028, By Product

Table 22: Japan Exosome Diagnostic and Therapeutic Market Size (US$ Mn) Analysis 2012-2021 and Forecast 2022-2028, By Application

Table 23: Japan Exosome Diagnostic and Therapeutic Market Size (US$ Mn) Analysis 2012-2021 and Forecast 2022-2028, By End User

Table 24: MEA Exosome Diagnostic and Therapeutic Market Size (US$ Mn) Analysis 2012-2021 and Forecast 2022-2028, By Country

Table 25: MEA Exosome Diagnostic and Therapeutic Market Size (US$ Mn) Analysis 2012-2021 and Forecast 2022-2028, By Product

Table 26: MEA Exosome Diagnostic and Therapeutic Market Size (US$ Mn) Analysis 2012-2021 and Forecast 2022-2028, By Application

Table 27: MEA Exosome Diagnostic and Therapeutic Market Size (US$ Mn) Analysis 2012-2021 and Forecast 2022-2028, By End User

Table 28: Global Exosome Diagnostic and Therapeutic Market Size (US$ Mn) Analysis 2012-2021 and Forecast 2022-2028, By Region

Table 29: Global Exosome Diagnostic and Therapeutic Market Size (US$ Mn) Analysis 2012-2021 and Forecast 2022-2028, By Product

Table 30: Global Exosome Diagnostic and Therapeutic Market Size (US$ Mn) Analysis 2012-2021 and Forecast 2022-2028, By Application

Table 31: Global Exosome Diagnostic and Therapeutic Market Size (US$ Mn) Analysis 2012-2021 and Forecast 2022-2028, By End User
Sabyasachi Ghosh
Sabyasachi Ghosh

Principal Consultant

Talk to Analyst

Find your sweet spots for generating winning opportunities in this market.

List of Charts

Figure 01: Global Exosome Diagnostic and Therapeutic Market Value Share By Product (2021)

Figure 02: Global Exosome Diagnostic and Therapeutic Market Value Share By Application (2021)

Figure 03: Global Exosome Diagnostic and Therapeutic Market Value Share By End User (2021)

Figure 04: Global Exosome Diagnostic and Therapeutic Market Value Share By Region (2021)

Figure 05: Wheel of Fortune

Figure 06: Role of Exosome in Cell-to-Cell Communication

Figure 07: Global Healthcare Expenditure in US$ Tn (2012–2020)

Figure 08: Applications of Exosome

Figure 09: North America Exosome Diagnostics and Therapeutic Market Share, By Product (2021)

Figure 10: North America Exosome Diagnostics and Therapeutic Market Share, By Application (2021)

Figure 11: North America Exosome Diagnostics and Therapeutic Market Share, By End User (2021)

Figure 12: North America Exosome Diagnostics and Therapeutic Market Share, By Country (2021)

Figure 13: North America Exosome Diagnostics and Therapeutic Market size (US$ Mn) 2021 & 2028

Figure 14: North Exosome Diagnostic and Therapeutic Market Size (US$ Mn) Analysis, 2012–2021,

Figure 15: North Exosome Diagnostic and Therapeutic Market Size (US$ Mn) & Y-o-Y Growth (%), 2022–2028

Figure 16: U.S. Exosome Diagnostic and Therapeutic Market Size (US$ Mn) Analysis, 2012–2021

Figure 17: U.S. Exosome Diagnostic and Therapeutic Market Size (US$ Mn) & Y-o-Y Growth (%), 2022–2028

Figure 18: Canada Exosome Diagnostic and Therapeutic Market Size (US$ Mn) Analysis, 2012–2021

Figure 19: Canada Exosome Diagnostic and Therapeutic Market Size (US$ Mn) & Y-o-Y Growth (%), 2022–2028

Figure 20: North America Exosome Diagnostic and Therapeutic Market Size (US$ Mn) Analysis, 2012–2021, By Instruments

Figure 21: North America Exosome Diagnostic and Therapeutic Market Size (US$ Mn) & Y-o-Y Growth (%), 2022–2028, By Instruments

Figure 22: North America Exosome Diagnostic and Therapeutic Market Size (US$ Mn) Analysis, 2012–2021, By Software

Figure 23: North America Exosome Diagnostic and Therapeutic Market Size (US$ Mn) & Y-o-Y Growth (%), 2022–2028, By Software

Figure 24: North America Exosome Diagnostic and Therapeutic Market Size (US$ Mn) Analysis, 2012–2021, By Reagents & Kits

Figure 25: North America Exosome Diagnostic and Therapeutic Market Size (US$ Mn) & Y-o-Y Growth (%), 2022–2028, By Reagents & Kits

Figure 26: North America Exosome Diagnostic and Therapeutic Market Attractiveness Analysis, , By Country

Figure 27: North America Exosome Diagnostic and Therapeutic Market Attractiveness Analysis, By Product

Figure 28: North America Exosome Diagnostic and Therapeutic Market Attractiveness Analysis, By Application

Figure 29: North America Exosome Diagnostic and Therapeutic Market Attractiveness Analysis, By End User

Figure 30: Latin America Exosome Diagnostics and Therapeutic Market Share, By Product (2021)

Figure 31: Latin America Exosome Diagnostics and Therapeutic Market Share, By Application (2021)

Figure 32: Latin America Exosome Diagnostics and Therapeutic Market Share, By End User (2021)

Figure 33: Latin America Exosome Diagnostics and Therapeutic Market Share, By Country (2021)

Figure 34: Latin America Exosome Diagnostics and Therapeutic Market size (US$ Mn) 2021 & 2028

Figure 35: Latin America Exosome Diagnostic and Therapeutic Market Size (US$ Mn) Analysis, 2012–2021,

Figure 36: Latin America Exosome Diagnostic and Therapeutic Market Size (US$ Mn) & Y-o-Y Growth (%), 2022–2028

Figure 37: Brazil Exosome Diagnostic And Therapeutic Market Size (US$ Mn) Analysis, 2012–2021

Figure 38: Brazil Exosome Diagnostic And Therapeutic Market Size (US$ Mn) & Y-o-Y Growth (%), 2022–2028

Figure 39: Mexico Exosome Diagnostic And Therapeutic Market Size (US$ Mn) Analysis, 2012–2021

Figure 40: Mexico Exosome Diagnostic And Therapeutic Market Size (US$ Mn) & Y-o-Y Growth (%), 2022–2028

Figure 41: Rest of Latin America Exosome Diagnostic and Therapeutic Market Size (US$ Mn) Analysis, 2012–2021

Figure 42: Rest of Latin America Exosome Diagnostic and Therapeutic Market Size (US$ Mn) & Y-o-Y Growth (%), 2022–2028

Figure 43: Latin America Exosome Diagnostic and Therapeutic Market Size (US$ Mn) Analysis, 2012–2021, By Instruments

Figure 44: Latin America Exosome Diagnostic and Therapeutic Market Size (US$ Mn) & Y-o-Y Growth (%), 2022–2028, By Instruments

Figure 45: Latin America Exosome Diagnostic and Therapeutic Market Size (US$ Mn) Analysis, 2012–2021, By Software

Figure 46: Latin America Exosome Diagnostic and Therapeutic Market Size (US$ Mn) & Y-o-Y Growth (%), 2022–2028, By Software

Figure 47: Latin America Exosome Diagnostic and Therapeutic Market Size (US$ Mn) Analysis, 2012–2021, By Reagents & Kits

Figure 48: Latin America Exosome Diagnostic and Therapeutic Market Size (US$ Mn) & Y-o-Y Growth (%), 2022–2028, By Reagents & Kits

Figure 49: Latin America Exosome Diagnostic and Therapeutic Market Attractiveness Analysis, , By Country

Figure 50: Latin America Exosome Diagnostic and Therapeutic Market Attractiveness Analysis, By Product

Figure 51: Latin America Exosome Diagnostic and Therapeutic Market Attractiveness Analysis, By Application

Figure 52: Latin America Exosome Diagnostic and Therapeutic Market Attractiveness Analysis, By End User

Figure 53: Western Europe Exosome Diagnostics and Therapeutic Market Share, By Product (2021)

Figure 54: Western Europe Exosome Diagnostics and Therapeutic Market Share, By Application (2021)

Figure 55: Western Europe Exosome Diagnostics and Therapeutic Market Share, By End User (2021)

Figure 56: Western Europe Exosome Diagnostics and Therapeutic Market Share, By Country (2021)

Figure 57: Western Europe Exosome Diagnostics and Therapeutic Market size (US$ Mn) 2021 & 2028

Figure 58: Western Europe Exosome Diagnostic and Therapeutic Market Size (US$ Mn) Analysis, 2012–2021,

Figure 59: Western Europe Exosome Diagnostic and Therapeutic Market Size (US$ Mn) & Y-o-Y Growth (%), 2022–2028

Figure 60: U.K Exosome Diagnostic and Therapeutic Market Size (US$ Mn) Analysis, 2012–2021

Figure 61: U.K Exosome Diagnostic and Therapeutic Market Size (US$ Mn) & Y-o-Y Growth (%), 2022–2028

Figure 62: France Exosome Diagnostic and Therapeutic Market Size (US$ Mn) Analysis, 2012–2021

Figure 63: France Exosome Diagnostic and Therapeutic Market Size (US$ Mn) & Y-o-Y Growth (%), 2022–2028

Figure 64: Germany Exosome Diagnostic and Therapeutic Market Size (US$ Mn) Analysis, 2012–2021, By Country

Figure 65: Germany Exosome Diagnostic and Therapeutic Market Size (US$ Mn) & Y-o-Y Growth (%), 2022–2028

Figure 66: Italy Exosome Diagnostic and Therapeutic Market Size (US$ Mn) Analysis, 2012–2021, By Country

Figure 67: Italy Exosome Diagnostic and Therapeutic Market Size (US$ Mn) & Y-o-Y Growth (%), 2022–2028

Figure 68: Spain Exosome Diagnostic and Therapeutic Market Size (US$ Mn) Analysis, 2012–2021, By Country

Figure 69: Spain Exosome Diagnostic and Therapeutic Market Size (US$ Mn) & Y-o-Y Growth (%), 2022–2028

Figure 70: Rest of Western Europe Exosome Diagnostic and Therapeutic Market Size (US$ Mn) Analysis, 2012–2021, By Country

Figure 71: Rest of Western Europe Exosome Diagnostic and Therapeutic Market Size (US$ Mn) & Y-o-Y Growth (%), 2022–2028

Figure 72: Western Europe Exosome Diagnostic and Therapeutic Market Size (US$ Mn) Analysis, 2012–2021, By Instruments

Figure 73: Western Europe Exosome Diagnostic and Therapeutic Market Size (US$ Mn) & Y-o-Y Growth (%), 2022–2028, By Instruments

Figure 74: Western Europe Exosome Diagnostic and Therapeutic Market Size (US$ Mn) Analysis, 2012–2021, By Software

Figure 75: Western Europe Exosome Diagnostic and Therapeutic Market Size (US$ Mn) & Y-o-Y Growth (%), 2022–2028, By Software

Figure 76: Western Europe Exosome Diagnostic and Therapeutic Market Size (US$ Mn) Analysis, 2012–2021, By Reagents & Kits

Figure 77: Western Europe Exosome Diagnostic and Therapeutic Market Size (US$ Mn) & Y-o-Y Growth (%), 2022–2028, By Reagents & Kits

Figure 78: Western Europe Exosome Diagnostic and Therapeutic Market Attractiveness Analysis, , By Country

Figure 79: Western Europe Exosome Diagnostic and Therapeutic Market Attractiveness Analysis, By Product

Figure 80: Western Europe Exosome Diagnostic and Therapeutic Market Attractiveness Analysis, By Application

Figure 81: Western Europe Exosome Diagnostic and Therapeutic Market Attractiveness Analysis, By End User

Figure 82: Eastern Europe Exosome Diagnostics and Therapeutic Market Share, By Product (2021)

Figure 83: Eastern Europe Exosome Diagnostics and Therapeutic Market Share, By Application (2021)

Figure 84: Eastern Europe Exosome Diagnostics and Therapeutic Market Share, By End User (2021)

Figure 85: Eastern Europe Exosome Diagnostics and Therapeutic Market Share, By Country (2021)

Figure 86: Eastern Europe Exosome Diagnostics and Therapeutic Market size (US$ Mn) 2021 & 2028

Figure 87 Eastern Europe Exosome Diagnostic and Therapeutic Market Size (US$ Mn) Analysis, 2012–2021,

Figure 88: Eastern Europe Exosome Diagnostic and Therapeutic Market Size (US$ Mn) & Y-o-Y Growth (%), 2022–2028

Figure 89: Russia Exosome Diagnostic and Therapeutic Market Size (US$ Mn) Analysis, 2012–2021, By Country

Figure 90: Russia Exosome Diagnostic and Therapeutic Market Size (US$ Mn) & Y-o-Y Growth (%), 2022–2028

Figure 91: Poland Exosome Diagnostic and Therapeutic Market Size (US$ Mn) Analysis, 2012–2021, By Country

Figure 92: Poland Exosome Diagnostic and Therapeutic Market Size (US$ Mn) & Y-o-Y Growth (%), 2022–2028

Figure 93: Rest of Eastern Europe Exosome Diagnostic and Therapeutic Market Size (US$ Mn) Analysis, 2012–2021, By Country

Figure 94: Rest of Eastern Europe Exosome Diagnostic and Therapeutic Market Size (US$ Mn) & Y-o-Y Growth (%), 2022–2028

Figure 95: Eastern Europe Exosome Diagnostic and Therapeutic Market Size (US$ Mn) Analysis, 2012–2021, By Instruments

Figure 96: Eastern Europe Exosome Diagnostic and Therapeutic Market Size (US$ Mn) & Y-o-Y Growth (%), 2022–2028, By Instruments

Figure 97: Eastern Europe Exosome Diagnostic and Therapeutic Market Size (US$ Mn) Analysis, 2012–2021, By Software

Figure 98: Eastern Europe Exosome Diagnostic and Therapeutic Market Size (US$ Mn) & Y-o-Y Growth (%), 2022–2028, By Software

Figure 99: Eastern Europe Exosome Diagnostic and Therapeutic Market Size (US$ Mn) Analysis, 2012–2021, By Reagents & Kits

Figure 100: Eastern Europe Exosome Diagnostic and Therapeutic Market Size (US$ Mn) & Y-o-Y Growth (%), 2022–2028, By Reagents & Kits

Figure 101: Eastern Europe Exosome Diagnostic and Therapeutic Market Attractiveness Analysis, , By Country

Figure 102: Eastern Europe Exosome Diagnostic and Therapeutic Market Attractiveness Analysis, By Product

Figure 103: Eastern Europe Exosome Diagnostic and Therapeutic Market Attractiveness Analysis, By Application

Figure 104: Eastern Europe Exosome Diagnostic and Therapeutic Market Attractiveness Analysis, By End User

Figure 105: APEJ Exosome Diagnostics and Therapeutic Market Share, By Product (2021)

Figure 106: APEJ Exosome Diagnostics and Therapeutic Market Share, By Application (2021)

Figure 107: APEJ Exosome Diagnostics and Therapeutic Market Share, By End User (2021)

Figure 108: APEJ Exosome Diagnostics and Therapeutic Market Share, By Country (2021)

Figure 109: APEJ Exosome Diagnostics and Therapeutic Market size (US$ Mn) 2021 & 2028

Figure 110: APEJ Exosome Diagnostic and Therapeutic Market Size (US$ Mn) Analysis, 2012–2021,

Figure 111: APEJ Exosome Diagnostic and Therapeutic Market Size (US$ Mn) & Y-o-Y Growth (%), 2022–2028

Figure 112: China Exosome Diagnostic and Therapeutic Market Size (US$ Mn) Analysis, 2012–2021

Figure 113: China Exosome Diagnostic and Therapeutic Market Size (US$ Mn) & Y-o-Y Growth (%), 2022–2028

Figure 114: India Exosome Diagnostic and Therapeutic Market Size (US$ Mn) Analysis, 2012–2021, By Country

Figure 115: India Exosome Diagnostic and Therapeutic Market Size (US$ Mn) & Y-o-Y Growth (%), 2022–2028

Figure 116: ASEAN Exosome Diagnostic and Therapeutic Market Size (US$ Mn) Analysis, 2012–2021, By Country

Figure 117: ASEAN Exosome Diagnostic and Therapeutic Market Size (US$ Mn) & Y-o-Y Growth (%), 2022–2028

Figure 118: Australia and New Zealand Exosome Diagnostic and Therapeutic Market Size (US$ Mn) Analysis, 2012–2021, By Country

Figure 119: Australia and New Zealand Exosome Diagnostic and Therapeutic Market Size (US$ Mn) & Y-o-Y Growth (%), 2022–2028

Figure 120: Rest of APEJ Exosome Diagnostic and Therapeutic Market Size (US$ Mn) Analysis, 2012–2021, By Country

Figure 121: Rest of APEJ Exosome Diagnostic and Therapeutic Market Size (US$ Mn) & Y-o-Y Growth (%), 2022–2028

Figure 122: APEJ Exosome Diagnostic and Therapeutic Market Size (US$ Mn) Analysis, 2012–2021, By Instruments

Figure 123: APEJ Exosome Diagnostic and Therapeutic Market Size (US$ Mn) & Y-o-Y Growth (%), 2022–2028, By Instruments

Figure 124: APEJ Exosome Diagnostic and Therapeutic Market Size (US$ Mn) Analysis, 2012–2021, By Software

Figure 125: APEJ Exosome Diagnostic and Therapeutic Market Size (US$ Mn) & Y-o-Y Growth (%), 2022–2028, By Software

Figure 126: APEJ Exosome Diagnostic and Therapeutic Market Size (US$ Mn) Analysis, 2012–2021, By Reagents & Kits

Figure 127: APEJ Exosome Diagnostic and Therapeutic Market Size (US$ Mn) & Y-o-Y Growth (%), 2022–2028, By Reagents & Kits

Figure 128: APEJ Exosome Diagnostic and Therapeutic Market Attractiveness Analysis, , By Country

Figure 129: APEJ Exosome Diagnostic and Therapeutic Market Attractiveness Analysis, By Product

Figure 130: APEJ Exosome Diagnostic and Therapeutic Market Attractiveness Analysis, By Application

Figure 131: APEJ Exosome Diagnostic and Therapeutic Market Attractiveness Analysis, By End User

Figure 132: Japan Exosome Diagnostics and Therapeutic Market Share, By Product (2021)

Figure 133: Japan Exosome Diagnostics and Therapeutic Market Share, By Application (2021)

Figure 134: Japan Exosome Diagnostics and Therapeutic Market Share, By End User (2021)

Figure 135: Japan Exosome Diagnostics and Therapeutic Market size (US$ Mn) 2021 & 2028

Figure 136: Japan Exosome Diagnostic and Therapeutic Market Size (US$ Mn) Analysis, 2012–2021, By Instruments

Figure 137: Japan Exosome Diagnostic and Therapeutic Market Size (US$ Mn) & Y-o-Y Growth (%), 2022–2028, By Instruments

Figure 138: Japan Exosome Diagnostic and Therapeutic Market Size (US$ Mn) Analysis, 2012–2021, By Software

Figure 139: Japan Exosome Diagnostic and Therapeutic Market Size (US$ Mn) & Y-o-Y Growth (%), 2022–2028, By Software

Figure 140: Japan Exosome Diagnostic and Therapeutic Market Size (US$ Mn) Analysis, 2012–2021, By Reagents & Kits

Figure 141: Japan Exosome Diagnostic and Therapeutic Market Size (US$ Mn) & Y-o-Y Growth (%), 2022–2028, By Reagents & Kits

Figure 142: Japan Exosome Diagnostic and Therapeutic Market Attractiveness Analysis, By Product

Figure 143: Japan Exosome Diagnostic and Therapeutic Market Attractiveness Analysis, By Application

Figure 144: Japan Exosome Diagnostic and Therapeutic Market Attractiveness Analysis, By End User

Figure 145: MEA Exosome Diagnostics and Therapeutic Market Share, By Product (2021)

Figure 146: MEA Exosome Diagnostics and Therapeutic Market Share, By Application (2021)

Figure 147: MEA Exosome Diagnostics and Therapeutic Market Share, By End User (2021)

Figure 148: MEA Exosome Diagnostics and Therapeutic Market Share, By Country (2021)

Figure 149: MEA Exosome Diagnostic and Therapeutic Market Size (US$ Mn) Analysis, 2012–2021,

Figure 150: MEA Exosome Diagnostic and Therapeutic Market Size (US$ Mn) & Y-o-Y Growth (%), 2022–2028

Figure 151: GCC Countries Exosome Diagnostic and Therapeutic Market Size (US$ Mn) Analysis, 2012–2021

Figure 152: GCC Countries Exosome Diagnostic and Therapeutic Market Size (US$ Mn) & Y-o-Y Growth (%), 2022–2028

Figure 153: South Africa Exosome Diagnostic and Therapeutic Market Size (US$ Mn) Analysis, 2012–2021

Figure 154: South Africa Exosome Diagnostic and Therapeutic Market Size (US$ Mn) & Y-o-Y Growth (%), 2022–2028

Figure 155: Rest of MEA Exosome Diagnostic and Therapeutic Market Size (US$ Mn) Analysis, 2012–2021, By Country

Figure 156: Rest of MEA Exosome Diagnostic and Therapeutic Market Size (US$ Mn) & Y-o-Y Growth (%), 2022–2028

Figure 157: MEA Exosome Diagnostic and Therapeutic Market Size (US$ Mn) Analysis, 2012–2021, By Instruments

Figure 158: MEA Exosome Diagnostic and Therapeutic Market Size (US$ Mn) & Y-o-Y Growth (%), 2022–2028, By Instruments

Figure 159: MEA Exosome Diagnostic and Therapeutic Market Size (US$ Mn) Analysis, 2012–2021, By Software

Figure 160: MEA Exosome Diagnostic and Therapeutic Market Size (US$ Mn) & Y-o-Y Growth (%), 2022–2028, By Software

Figure 161: MEA Exosome Diagnostic and Therapeutic Market Size (US$ Mn) Analysis, 2012–2021, By Reagents & Kits

Figure 162: MEA Exosome Diagnostic and Therapeutic Market Size (US$ Mn) & Y-o-Y Growth (%), 2022–2028, By Reagents & Kits

Figure 163: MEA Exosome Diagnostic and Therapeutic Market Attractiveness Analysis, , By Country

Figure 164: MEA Exosome Diagnostic and Therapeutic Market Attractiveness Analysis, By Product

Figure 165: MEA Exosome Diagnostic and Therapeutic Market Attractiveness Analysis, By Application

Figure 166: MEA Exosome Diagnostic and Therapeutic Market Attractiveness Analysis, By End User

Figure 167: Exosome Diagnostics Inc. Number of Pipeline Products by Category (2021)

Figure 168: Exosome Diagnostic Inc. Pipeline Analysis By Geography (2021)

Figure 169: Exosome Diagnostics Inc. Number of Pipeline Products by Development Stage (2021)

Figure 170: Exosome Diagnostics Inc. Number of Pipeline Products by Indication (2021

Figure 171: Exiqon AS Pipeline Analysis By Development Status (2021)

Figure 172: Exiqon AS Pipeline Analysis By Indication

Figure 173: Miltenyi Biotec GmbH Pipeline Analysis By Development Status (2021)

Figure 174: Miltenyi Biotec GmbH Pipeline Analysis By Indication

Figure 175: Global Exosome Diagnostic and Therapeutic Market Attractiveness Analysis, By Region

Figure 176: Global Exosome Diagnostic and Therapeutic Market Attractiveness Analysis, By Product

Figure 177: Global Exosome Diagnostic and Therapeutic Market Attractiveness Analysis, By Application

Figure 178: Global Exosome Diagnostic and Therapeutic Market Attractiveness Analysis, By End User

Figure 179: Global Single-Photon Emission Computed Tomography Historical Market Size and Y-o-Y, 2012 - 2021

Figure 180: Global Exosome Diagnostic and Therapeutic Market Size (US$ Mn) & Y-o-Y Growth (%), 2022–2028

Figure 181: Global Exosome Diagnostic and Therapeutic Market Absolute $ Opportunity, 2012–2028

Recommendations

Healthcare

Liquid Biopsy Market

Published : October 2023

Healthcare

Radiotherapy Device Market

Published : October 2023

Healthcare

Cancer Diagnostics Market

Published : August 2023

Healthcare

Exosome Diagnostic and Therapeutics Market

Published : June 2022

Explore Healthcare Insights

View Reports

Exosome Diagnostic and Therapeutics Market