
- Market Size (2026)
- USD 411.0 Mn
- Forecast (2036)
- USD 955.3 Mn
- CAGR (2026 to 2036)
- 8.8%
How Big is the Feuilletine & Crispy Inclusions Market in 2026?
The feuilletine & crispy inclusions market is estimated at USD 411.0 million in 2026.
The global feuilletine & crispy inclusions market was valued at USD 377.8 million in 2025 and is estimated to reach USD 411.0 million in 2026. The market is projected to reach USD 955.3 million by 2036, expanding at a compound annual growth rate (CAGR) of 8.8% between 2026 and 2036. Chocolate pieces accounted for the largest share of the Product Type breakdown, contributing 27.0% of total revenue in 2026. Demand is supported by bakeries and pastry makers that use crisp wafer, biscuit and cereal pieces to add texture to fillings, layers and toppings. Chocolate costs remain high. Barry Callebaut reported that its Global Chocolate volumes fell by 5.3% in its 2024/25 financial year, while group revenue rose by 49.0% to CHF 14.8 billion because of higher cocoa-related pricing. Wheat-based inputs are also more expensive, as the Food and Agriculture Organization of the United Nations (FAO) Cereal Price Index stood 17.2% above its year-earlier level in September 2026. Suppliers continue to launch new formats. For instance, CSM Ingredients launched its Creami range in May 2026, including Crunchy Pistachio and Crunchy Hazelnut variants containing caramelised kataifi.
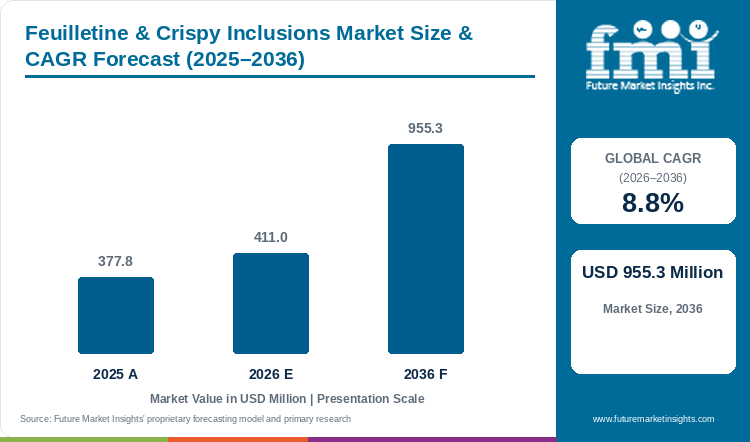
Table 1: Feuilletine & Crispy Inclusions Market Size and Forecast (USD million), 2025 to 2036
| Market size and forecast | Value |
|---|---|
| 2025 market size | USD 377.8 million |
| Estimated market size in 2026 | USD 411.0 million |
| Projected market size by 2036 | USD 955.3 million |
| CAGR (2026-2036) | 8.8% |
| Added revenue, 2026 to 2036 | USD 544.3 million |
Key Market Trends & Insights
- By Product Type: The Chocolate pieces segment accounted for the largest share of the Product Type breakdown in 2026, representing 27.0% of total market revenue.
- By Form: Powder / dry products held the leading market position with a share of 42.0% in 2026, with moisture protection influencing the condition of the material at application.
- By Application: Bread & rolls remained the largest application segment, accounting for 28.0% of the market in 2026.
Regional Highlights
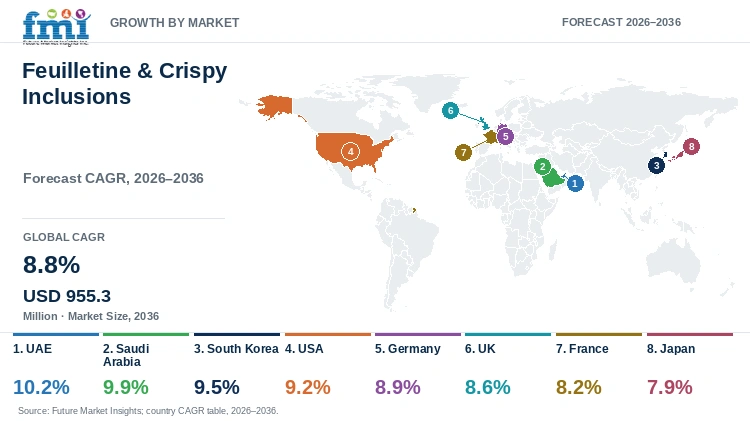
- Fastest-growing country: The UAE is expected to record the highest growth rate among the eight profiled countries, with a projected CAGR of 10.2% between 2026 and 2036.
- Growth across other countries: Saudi Arabia is projected to expand at a CAGR of 9.9%, followed by South Korea at 9.5% and the USA at 9.2%. Japan is expected to register comparatively slower growth, with a CAGR of 7.9% during the forecast period.
Raw material costs remain an important factor influencing crispy inclusion prices. Feuilletine is made from thin baked wafer, so wheat, sugar and butter are its main inputs. The FAO reported that world wheat prices reached their highest level since August 2023 in September 2026, while its Sugar Price Index was 14.7% higher than a year earlier. Butter prices were little changed during the month, although the overall Dairy Price Index stood 19.1% below its year-earlier level. Cocoa supply has improved. The International Cocoa Organization (ICCO) estimated a 2024/25 surplus of 37,000 tonnes, with production up 8.5%. Barry Callebaut's pailleté feuilletine, which consists of crushed biscuit pieces for confectionery, pastry and desserts, is often combined with cocoa ingredients in layers and centres, so both cost trends matter to buyers.
Consumer response to chocolate prices affects the role of crisp inclusions. Mondelēz reported that its chocolate volume/mix fell by 7.5% in 2025, as significant cocoa-led pricing reduced demand, even though organic revenue rose by 11.4%. Bakeries facing higher chocolate costs can use crisp components to deliver an indulgent texture with less chocolate per portion. Prepared crunchy fillings also change how assembly is organised. CSM Ingredients' May 2026 Creami launch combined a crisp component with its carrier, which transfers one blending stage to the supplier. Loose material retains a role where the customer wants control over particle concentration or the surrounding recipe.
Flavour differentiation extends the choices available within professional crunchy ingredients. Fabbri's Amarena Crumblé appeared in its 2026 range as a component for dessert layers and other professional uses, showing how a flavoured crumble can support a new pastry combination while keeping texture central. Composition remains relevant throughout this development. UK ingredient-list guidance addresses the information required on applicable food labels, including allergens. When a bakery changes a biscuit, coating or nut-based carrier, the declaration and the physical performance both need to reflect the preparation actually supplied.
Table 2: Supporting Industry Indicators for the Feuilletine & Crispy Inclusions Market, 2024/25 to 2026
| Indicator | Data point | Why it matters | Source |
|---|---|---|---|
| Chocolate volumes | Barry Callebaut's Global Chocolate volumes fell by 5.3% in 2024/25, while revenue rose by 49.0%. | High chocolate costs encourage texture-led alternatives. | |
| Consumer response | Mondelēz chocolate volume/mix fell by 7.5% in 2025 despite 11.4% organic revenue growth. | Consumers are buying less chocolate at higher prices. | |
| Cocoa supply | The ICCO estimated a 2024/25 cocoa surplus of 37,000 tonnes, with production up 8.5%. | Recovering cocoa supply may ease chocolate inclusion costs. | |
| Wheat prices | World wheat prices reached their highest level since August 2023 in September 2026. | Wheat flour is the base of feuilletine wafer. | |
| Sugar prices | The FAO Sugar Price Index stood 14.7% above its year-earlier level in September 2026. | Sugar is a major input in crisp wafer and caramelised pieces. | |
| Dairy prices | The FAO Dairy Price Index stood 19.1% below its year-earlier level, with butter little changed. | Butter contributes to feuilletine flavour. | |
| Prepared crunchy fillings | CSM Ingredients launched Creami in May 2026, including two variants containing caramelised kataifi. | Combining filling and inclusion removes a blending stage. | |
| Flavoured crumble | Fabbri's 2026 range included Amarena Fabbri Crumblé for professional desserts. | Flavour and texture can be developed together. | |
| Biscuit texture ingredient | Barry Callebaut lists pailleté feuilletine as crushed biscuit pieces for confectionery, pastry and desserts. | Loose inclusions allow texture and dosage to be chosen in the recipe. | |
| Ingredient information | UK guidance addresses ingredient lists and allergen information for applicable labels. | Changes to the crisp component can affect the declaration. | |
Demand Intensity Analysis
A comparison of FMI's market estimate with world cocoa grindings provides a reference for the scale of inclusion use in bakery and confectionery. The ICCO estimated world grindings at 4.649 million tonnes in 2024/25. FMI estimated the feuilletine & crispy inclusions market at USD 377.8 million in 2025, which is equivalent to approximately USD 81.0 for every tonne of cocoa ground worldwide. Since the market includes biscuit, cereal, fruit and caramel pieces as well as chocolate pieces, this figure is a reference point rather than a measure of cocoa use.
Chocolate pricing provides another perspective. Barry Callebaut's revenue per tonne rose by approximately 60.0% in 2024/25, based on 49.0% revenue growth and a 6.8% fall in group volume. In comparison, the main inputs to feuilletine have risen less sharply, with the FAO Cereal Price Index up 17.2% and the Sugar Price Index up 14.7% year on year. Crisp wafer and biscuit inclusions have therefore become relatively cheaper than chocolate as a way to add indulgence to bakery products.
A similar comparison can be made between projected market growth and chocolate demand. FMI expects the market to grow at a CAGR of 8.8% between 2026 and 2036, while world cocoa grindings fell by 3.3% in 2024/25. The difference implies that growth will rely on wider use of non-chocolate crisp pieces and prepared crunchy fillings, which can deliver texture without depending on cocoa volumes.
Segment values show where demand is concentrated. Direct to industrial bakeries accounted for USD 238.4 million in 2026, or 58.0% of the market, while Powder / dry contributed USD 172.6 million within the separate Form dimension. Chocolate pieces accounted for USD 111.0 million in Product Type, and Bread & rolls represented USD 115.1 million within Application. Projected market revenue reaches 2.3 times its 2026 level by 2036.
Table 3: Demand Intensity Metrics for the Feuilletine & Crispy Inclusions Market, 2024/25 Commodity Data Against 2025 and 2026 Market Values
| Demand intensity metric | Value | Basis |
|---|---|---|
| FMI market value, 2025 | USD 377.8 million | FMI estimate of crispy inclusion revenue. |
| World cocoa grindings, 2024/25 | 4.649 million tonnes | ICCO. |
| FMI value per tonne of cocoa ground | Approximately USD 81.0 | The calculation divides USD 377.8 million by 4.649 million tonnes. |
| Barry Callebaut implied revenue per tonne change | Approximately +60.0% | Revenue +49.0% and volume -6.8%. |
| FAO Cereal Price Index, year-on-year change | +17.2% | September 2026. |
| FAO Sugar Price Index, year-on-year change | +14.7% | September 2026. |
| Mondelēz chocolate volume/mix change, 2025 | -7.5% | Mondelēz full-year 2025 results. |
| FMI value CAGR, 2026 to 2036 | 8.8% | FMI market forecast. |
| Chocolate pieces revenue, 2026 | USD 111.0 million | 27.0% of the market. |
| Direct industrial bakery revenue, 2026 | USD 238.4 million | 58.0% of the market. |
| Market expansion multiple | 2.3 times | Projected 2036 market value relative to 2026. |
Analyst Perspective
"With chocolate costing far more than two years ago, a crisp layer of feuilletine lets a bakery keep the indulgent bite while using less cocoa, as long as that crunch survives until the product is eaten."
- Nandini Roy Choudhury, Principal Analyst at Future Market Insights
How is the feuilletine & crispy inclusions market segmented?
The feuilletine & crispy inclusions market is segmented by product type, form, application, claim and sales channel. Product Type comprises Chocolate pieces, Fruit pieces, Caramel & toffee and Crunchy cereal & cookie. Form comprises Powder / dry, Liquid, Paste / semi-solid and Granules / pieces. Application comprises Bread & rolls, Cakes & muffins, Biscuits & cookies, Viennoiserie & pastry and Other bakery & snacks. Claim comprises Conventional, Clean label, Organic and Non-GMO / identity preserved. Sales Channel comprises Direct to industrial bakeries, Ingredient distributors, Foodservice & artisan supply and Online B2B.
Why do Chocolate pieces anchor Product Type demand?
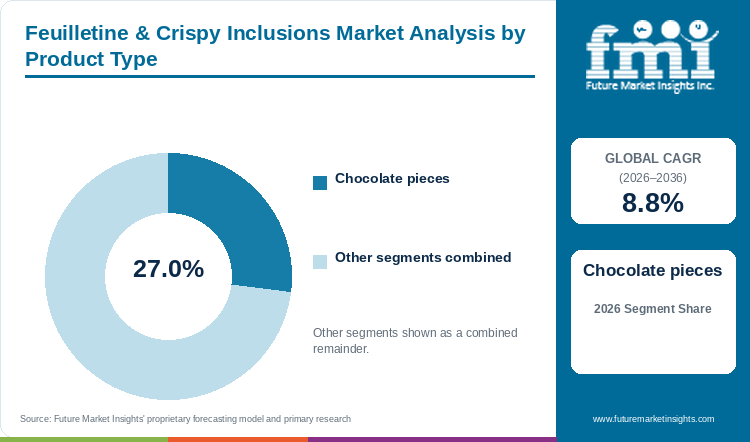
Chocolate pieces hold 27.0% of Product Type revenue in 2026.
Chocolate-coated crisp pieces are the largest product type, generating approximately USD 111.0 million in 2026. Chocolate used around a crisp centre contributes flavour, and its coating also reduces direct contact between the biscuit and a moist filling, while changing melting behaviour and mouthfeel. The bakery needs dimensions suited to its mixer or depositor, followed by a trial at the intended inclusion level. With cocoa costs elevated, suppliers may adjust the ratio of coating to centre, so the complete portion must be checked to confirm that chocolate intensity and crispness remain in balance.
- Chocolate pieces hold 27.0% of Product Type revenue in 2026.
- Coating, particle dimensions and the surrounding fat phase shape the bite of the complete portion.
What gives Powder / dry an operational advantage within Form?
Powder / dry accounts for 42.0% of Form revenue in 2026.
Dry formats generated approximately USD 172.6 million in 2026, but feuilletine flakes and dense coated cereal pieces tolerate handling very differently. The delicate material may need gentler mixing or a later point of addition to preserve its size, so free flow and weighing convenience are only the start of the comparison. Opened packs need protection from moisture, and transport can change the proportion of fragments before a batch begins. A controlled particle profile makes it easier to repeat the intended distribution across runs.
- Powder / dry accounts for 42.0% of Form revenue in 2026.
- Late addition or gentler mixing may be needed to preserve delicate flakes through preparation.
Why are Bread & rolls the principal Application?
Bread & rolls represent 28.0% of Application revenue in 2026.
Bread & rolls accounted for approximately USD 115.1 million of revenue in 2026, despite being demanding applications, as dough moisture and mechanical work can quickly soften a crisp component. The intended entry point needs to be clear, as a piece in a finished bun filling retains a different texture from one mixed into wet dough before baking. The two routes require separate assessment. What matters is the bite left in the bread or assembled roll, along with practical dosing and handling.
- Bread & rolls represent 28.0% of Application revenue in 2026.
- An inclusion in wet dough and one in a finished filling need separate texture trials.
What sustains the Conventional lead within Claim?
Conventional represents 53.0% of Claim revenue in 2026.
Conventional formulations represented 53.0% of Claim revenue in 2026, as the coating and the material inside a crisp piece give them several ways to achieve the desired bite. A specialty claim can narrow those options, especially for a biscuit component containing wheat or milk, and nut-containing fillings add another reason to keep the full ingredient statement clear. UK guidance sets out ingredient-list and allergen requirements for applicable products, and a revised declaration must still accompany acceptable texture and handling.
- Conventional represents 53.0% of Claim revenue in 2026.
- The requested claim must fit the full ingredient declaration and the physical performance of the recipe.
Why does Direct to industrial bakeries dominate Sales Channel?
Direct to industrial bakeries contributes 58.0% of Sales Channel revenue in 2026.
Industrial qualification depends on mixing intensity, the surrounding filling and the holding period, and direct supply to industrial bakeries generated approximately USD 238.4 million in 2026. These details can change the recommendation from a loose particle to a prepared crunchy cream. Direct relationships allow samples and technical work to be coordinated around the plant's actual conditions, while smaller professional kitchens may prefer a distributor offering convenient quantities alongside other decorating ingredients.
- Direct to industrial bakeries contributes 58.0% of Sales Channel revenue in 2026.
- Mixing intensity, filling moisture and holding time make sample selection more specific.
What are the drivers, restraints and opportunities in the feuilletine & crispy inclusions market?
Texture can renew familiar bakery products at lower cost than chocolate, although contact with moist components and rising wheat costs restrain the market, while prepared crunchy systems can reduce assembly work.
Texture can renew familiar bakery products at lower cost than chocolate
Crispness gives a developer a physical contrast to work with, adding a distinct bite beside a soft cake or filling while much of the existing recipe remains unchanged. Feuilletine, coated biscuit and cereal pieces are alternative confectionery ingredients for this purpose. Their appeal has grown as chocolate became more expensive, with Barry Callebaut's revenue per tonne rising by approximately 60.0% in 2024/25 and Mondelēz recording a 7.5% fall in chocolate volume/mix in 2025. A crisp inclusion can deliver indulgence with less cocoa, provided it can be added consistently at the required line speed.
Contact with moist components and rising wheat costs restrain the market
Contact with a moist cream can soften a crisp piece long after assembly, and heavy mixing can damage it much earlier. A development sample with an attractive first bite therefore gives only part of the information needed for approval, and the trial must include normal handling and storage. A different coating may reduce moisture contact but can create a fatty mouthfeel. Input costs add a further restraint, as world wheat prices reached their highest level since August 2023 in September 2026, which raises the cost of wafer-based inclusions.
Prepared crunchy systems can reduce assembly work
Supplying crisp pieces already dispersed in a compatible cream removes one blending operation and makes particle distribution easier to reproduce. CSM Ingredients' Creami launch included two nut-flavoured variants containing caramelised kataifi, showing how the filling itself can carry the crunch. Germany was among the first European markets for the range. A prepared system still has to suit the customer's equipment, and smaller pastry kitchens may value the reduced batching work, whereas a large manufacturer may prefer loose inclusions and direct control of dosage.
Which country CAGRs are profiled in the feuilletine & crispy inclusions market?
Table 4: Country growth outlook for the feuilletine & crispy inclusions market
| Country | CAGR |
|---|---|
| UAE | 10.2% |
| Saudi Arabia | 9.9% |
| South Korea | 9.5% |
| USA | 9.2% |
| Germany | 8.9% |
| UK | 8.6% |
| France | 8.2% |
| Japan | 7.9% |
UAE
- The UAE is the fastest-growing market among the profiled countries, with a forecast CAGR of 10.2% from 2026 to 2036. For UAE pastry operators, the holding period from preparation to display is a useful starting point when comparing crispy ingredients, as a loose inclusion and a prepared crunchy filling retain bite differently. Professional kitchens need usable trial quantities, while industrial accounts may need a more detailed particle specification. Opened-pack moisture protection also belongs in the preparation method.
Saudi Arabia
- In Saudi bakery production, texture development often depends on how a crisp component works with a chocolate or nut-flavoured filling. Saudi Arabia is projected to grow at a CAGR of 9.9% for 2026 to 2036. Smaller users may prefer the components supplied together, while a central bakery may want loose pieces for controlled dosing. Particle consistency matters between deliveries, as a change in fragment size alters both visible distribution and perceived texture.
South Korea
- With a projected CAGR of 9.5% from 2026 to 2036, South Korea ranks third among the profiled countries. A compact South Korean bakery item can achieve clear textural contrast with relatively few inclusions, provided they are evenly distributed, and a stable size range helps make the intended bite present in each portion. A new pastry concept also needs assessment after holding, when the initial crunch may have changed.
USA
- US filled-snack distribution requires crisp texture to remain perceptible through the selling period, so moisture exchange between inclusion and filling is central to selection. The USA market is forecast to grow at a CAGR of 9.2% from 2026 to 2036. US consumers have reduced chocolate purchases in response to higher prices, with Mondelēz reporting a 7.5% fall in chocolate volume/mix in 2025, which supports texture-led alternatives. Consistent grading keeps individual portions from varying too widely.
Germany
- Germany was included in the initial European roll-out of CSM Ingredients' Creami range in May 2026, which added another prepared format for buyers to assess. Germany is projected to grow at a CAGR of 8.9% from 2026 to 2036. An industrial bakery may need particles that tolerate automated mixing and depositing, while a specialist kitchen may value a crunchy layer that reduces assembly work. The surrounding recipe and holding period remain decisive for both.
UK
- In UK products, changing a crunchy filling can mean changing several declared ingredients at once, and government guidance addresses ingredient and allergen information on applicable labels. The UK is forecast to grow at a CAGR of 8.6% for 2026 to 2036. Physical performance needs a separate trial through assembly and holding. A stable formulation helps a bakery retain both its recipe and packaging information across repeated purchases.
France
- France is forecast to grow at a CAGR of 8.2% from 2026 to 2036. In French pastry, feuilletine places a thin crisp layer beside a smooth filling, and the layer must keep that contrast without becoming difficult to cut. Loose flakes leave the kitchen control over the recipe, while a prepared system offers a predetermined distribution of particles. A clean slice and retained bite make the ingredient practical in a professional range.
Japan
- Japan is expected to register the slowest growth among the profiled countries, with a projected CAGR of 7.9% from 2026 to 2036. In a small Japanese dessert, large fragments can interrupt assembly, while excessive fines make the promised crunch hard to detect, so a controlled size range connects precise portioning with a perceptible texture. The trial needs to extend through packaging and storage.
Who are the notable companies in the feuilletine & crispy inclusions market?
Barry Callebaut; IRCA Group; CSM Ingredients; Fabbri 1905; Puratos
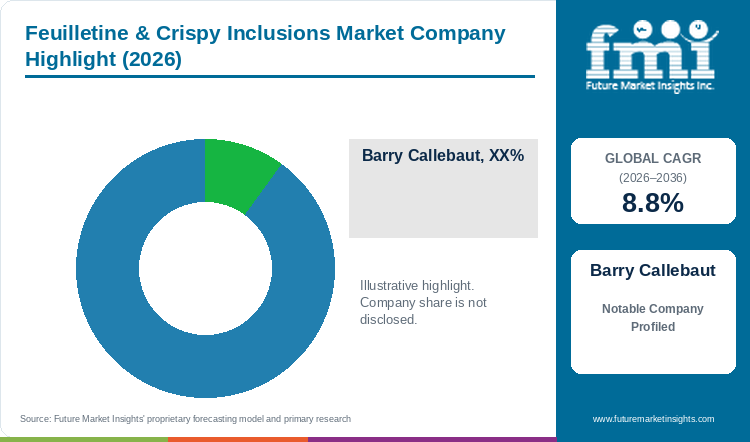
Loose texture ingredients and prepared crunchy systems serve different parts of this market. Barry Callebaut supplies biscuit crunch and chocolate inclusions, with 2024/25 revenue of CHF 14.8 billion. IRCA Group and CSM Ingredients combine crisp components with carriers, with CSM launching its Creami crunchy fillings in May 2026. Fabbri offers flavoured crumble formats, and Puratos participates through chocolate filling and patisserie systems.
Loose material gives the bakery control over dosage and the surrounding formulation, while a prepared cream reduces blending work. Comparing the two in the intended application shows which delivers the required bite with a sustainable assembly method.
Competitive Benchmarking: Feuilletine & Crispy Inclusions Market
Table 5: Company capabilities in the feuilletine & crispy inclusions market
| Company | Product capability | Application emphasis |
|---|---|---|
| Barry Callebaut | Pailleté feuilletine and chocolate inclusions | Loose texture ingredients |
| IRCA Group | Pralin Delicrisp preparations | Crunchy pastry layers and fillings |
| CSM Ingredients | Creami crunchy fillings | Prepared inclusion-bearing systems |
| Fabbri 1905 | Crumblé professional ingredients | Crunchy dessert components |
| Puratos | Chocolate fillings and patisserie inclusion systems | Texture and carrier formulation |
Key Developments in the Feuilletine & Crispy Inclusions Market
- In November 2025, Barry Callebaut reported a 5.3% decline in Global Chocolate volumes and a 49.0% rise in group revenue for 2024/25.
- In February 2026, Mondelēz reported a 7.5% decline in chocolate volume/mix for 2025.
- In May 2026, CSM Ingredients launched Creami with Crunchy Pistachio and Crunchy Hazelnut variants containing caramelised kataifi.
- In 2026, Fabbri's new product range included Amarena Fabbri Crumblé, a crunchy ingredient for dessert layers and other professional applications.
- In August 2026, the ICCO estimated a 2024/25 global cocoa surplus of 37,000 tonnes.
Key Players in the Feuilletine & Crispy Inclusions Market
- Barry Callebaut
- IRCA Group
- CSM Ingredients
- Fabbri 1905
- Puratos
Feuilletine & Crispy Inclusions Market - Report Scope
Table 6: Report scope for the feuilletine & crispy inclusions market
| Coverage field | Report scope |
|---|---|
| Market breakdown | Product Type; Form; Application; Claim; Sales Channel; Region |
| Quantitative Units | USD Million |
| Market Definition | Revenue from feuilletine, crispy inclusions and in-scope textured pieces or inclusion-bearing ingredients sold for the stated applications. Only the inclusion-relevant component of mixed preparations is counted. Finished bread, pastry and confectionery sales are excluded, as are standalone non-inclusion sauces, adjacent crust decorations and substitute ingredient revenue. |
| Regions Covered | North America, Latin America, Western Europe, Eastern Europe, East Asia, South Asia and Pacific, Middle East and Africa |
| Countries Covered | UAE; Saudi Arabia; South Korea; USA; Germany; UK; France; Japan |
| Key Companies Profiled | Barry Callebaut; IRCA Group; CSM Ingredients; Fabbri 1905; Puratos |
| Forecast Period | 2026 to 2036 |
| Approach | Market assessment supported by official technical and regulatory publications, company product information and country operating conditions. |
Feuilletine & Crispy Inclusions Market - Research Methodology
Table 7: Research approach for the feuilletine & crispy inclusions market
| Method | Approach |
|---|---|
| Market definition | The market comprises feuilletine and crispy ingredients sold to create a distinct textural component within bakery and confectionery applications. |
| Desk research | Government and regulatory publications, technical literature and official product information establish the application and supply context. |
| Commercial assessment | Evaluation concentrates on particle integrity, the surrounding carrier and retention of the intended bite through production and holding. |
| Comparability | Market values, segment allocations and country growth rates use consistent units and the stated 2026 to 2036 forecast period. Company comparisons describe product roles and purchasing relevance. |
Feuilletine & Crispy Inclusions Market by Segments
Product Type
- Chocolate pieces
- Fruit pieces
- Caramel & toffee
- Crunchy cereal & cookie
Form
- Powder / dry
- Liquid
- Paste / semi-solid
- Granules / pieces
Application
- Bread & rolls
- Cakes & muffins
- Biscuits & cookies
- Viennoiserie & pastry
- Other bakery & snacks
Claim
- Conventional
- Clean label
- Organic
- Non-GMO / identity preserved
Sales Channel
- Direct to industrial bakeries
- Ingredient distributors
- Foodservice & artisan supply
- Online B2B
Feuilletine & Crispy Inclusions Market by Region
- North America
- United States
- Canada
- Latin America
- Brazil
- Mexico
- Argentina
- Chile
- Western Europe
- Germany
- France
- United Kingdom
- Italy
- Spain
- Benelux
- Nordics
- Eastern Europe
- Poland
- Czech Republic
- Romania
- Hungary
- East Asia
- China
- Japan
- South Korea
- South Asia and Pacific
- India
- ASEAN
- Australia and New Zealand
- Middle East and Africa
- GCC Countries
- South Africa
- Türkiye
- Israel
Research Sources and Bibliography
- [1] Barry Callebaut. (n.d.). Biscuit crunch (pailleté feuilletine): product information.
- [2] UK Government. (n.d.). Food labelling and packaging: ingredients list.
- [3] CSM Ingredients. (2026, May 12). CSM Ingredients launches Creami, a comprehensive range of indulgent fillings.
- [4] Fabbri 1905. (2026). Amarena Fabbri Crumblé.
- [5] Eastlake, D. (2025, November 5). ConfectioneryNews. Barry Callebaut revenue up 49% but sales down, as cocoa price hikes hit industry leader.
- [6] International Cocoa Organization. (2026, August 31). August 2026 Quarterly Bulletin of Cocoa Statistics.
- [7] Food and Agriculture Organization of the United Nations. (2026, October 2). FAO Food Price Index.
- [8] Redman, R. (2026, February 5). Food Business News. Mondelez offers cautious guidance for 2026.
Future Market Insights. (2026). Feuilletine & Crispy Inclusions Market: Global Industry Analysis and Opportunity Assessment 2036.
This Report Answers
- What are the forecast values of the feuilletine & crispy inclusions market in 2026 and 2036?
- Which texture preferences and industrial production pressures support demand?
- Why do Chocolate pieces lead the Product Type category?
- Why does Powder / dry lead the Form category?
- How do the profiled country CAGRs differ from 2026 to 2036?
- Which companies offer crispy ingredients and prepared inclusion systems?
Table of Content
- Key Takeaways
- Market Size and CAGR
- Top Growth Driver
- Fastest Growing Segment
- Leading Region
- Key Companies
- Emerging Opportunities
- Executive Summary
- Global Market Outlook
- Demand-side Trends
- Supply-side Trends
- Technology Roadmap Analysis
- Analysis and Recommendations
- Analyst Perspective (What is happening? Why now? What should investors know?)
- Key Questions Answered
- How large is the market?
- What is the CAGR?
- What are key trends?
- Which region dominates?
- Who are the leaders?
Read More...
- Market Overview
- Market Coverage / Taxonomy
- Market Definition / Scope / Limitations
- Research Methodology
- Chapter Orientation
- Analytical Lens and Working Hypotheses
- Market Structure, Signals, and Trend Drivers
- Benchmarking and Cross-market Comparability
- Market Sizing, Forecasting, and Opportunity Mapping
- Research Design and Evidence Framework
- Desk Research Programme (Secondary Evidence)
- Expert Input and Fieldwork (Primary Evidence)
- Tooling, Models, and Reference Databases
- Data Engineering and Model Build
- Quality Assurance and Audit Trail
- Market Background
- Market Dynamics (Drivers, Restraints, Opportunity, Trends)
- Scenario Forecast (Optimistic, Likely, Conservative)
- Impact Analysis
- AI Impact
- Sustainability Impact
- Regulatory Impact
- Technology Impact
- Consumer / Buyer Analysis
- Purchase Drivers
- Adoption Barriers
- Buyer Journey
- Opportunity Map Analysis
- Product Life Cycle Analysis
- Supply Chain Analysis
- Investment Feasibility Matrix
- Value Chain Analysis
- PESTLE and Porter's Analysis
- Regulatory Landscape
- Regional Parent Market Outlook
- Production and Consumption Statistics
- Import and Export Statistics
- Global Market Analysis and Forecast, 2021 to 2036
- Historical Market Size Value (USD Million) Analysis, 2021 to 2025
- Current and Future Market Size Value (USD Million) Projections, 2026 to 2036
- Y-o-Y Growth Trend Analysis
- Absolute $ Opportunity Analysis
- Global Market Pricing Analysis, 2021 to 2036
- Global Market Analysis and Forecast, By Product Type, 2021 to 2036
- Introduction / Key Findings
- Historical Market Size Value (USD Million) Analysis By Product Type, 2021 to 2025
- Current and Future Market Size Value (USD Million) Analysis and Forecast By Product Type, 2026 to 2036
- Chocolate pieces
- Fruit pieces
- Caramel & toffee
- Crunchy cereal & cookie
- Y-o-Y Growth Trend Analysis By Product Type, 2021 to 2025
- Absolute $ Opportunity Analysis By Product Type, 2026 to 2036
- Global Market Analysis and Forecast, By Form, 2021 to 2036
- Introduction / Key Findings
- Historical Market Size Value (USD Million) Analysis By Form, 2021 to 2025
- Current and Future Market Size Value (USD Million) Analysis and Forecast By Form, 2026 to 2036
- Powder / dry
- Liquid
- Paste / semi-solid
- Granules / pieces
- Y-o-Y Growth Trend Analysis By Form, 2021 to 2025
- Absolute $ Opportunity Analysis By Form, 2026 to 2036
- Global Market Analysis and Forecast, By Application, 2021 to 2036
- Introduction / Key Findings
- Historical Market Size Value (USD Million) Analysis By Application, 2021 to 2025
- Current and Future Market Size Value (USD Million) Analysis and Forecast By Application, 2026 to 2036
- Bread & rolls
- Cakes & muffins
- Biscuits & cookies
- Viennoiserie & pastry
- Other bakery & snacks
- Y-o-Y Growth Trend Analysis By Application, 2021 to 2025
- Absolute $ Opportunity Analysis By Application, 2026 to 2036
- Global Market Analysis and Forecast, By Claim, 2021 to 2036
- Introduction / Key Findings
- Historical Market Size Value (USD Million) Analysis By Claim, 2021 to 2025
- Current and Future Market Size Value (USD Million) Analysis and Forecast By Claim, 2026 to 2036
- Conventional
- Clean label
- Organic
- Non-GMO / identity preserved
- Y-o-Y Growth Trend Analysis By Claim, 2021 to 2025
- Absolute $ Opportunity Analysis By Claim, 2026 to 2036
- Global Market Analysis and Forecast, By Sales Channel, 2021 to 2036
- Introduction / Key Findings
- Historical Market Size Value (USD Million) Analysis By Sales Channel, 2021 to 2025
- Current and Future Market Size Value (USD Million) Analysis and Forecast By Sales Channel, 2026 to 2036
- Direct to industrial bakeries
- Ingredient distributors
- Foodservice & artisan supply
- Online B2B
- Y-o-Y Growth Trend Analysis By Sales Channel, 2021 to 2025
- Absolute $ Opportunity Analysis By Sales Channel, 2026 to 2036
- Global Market Analysis and Forecast, By Region, 2021 to 2036
- Introduction
- Historical Market Size Value (USD Million) Analysis By Region, 2021 to 2025
- Current Market Size Value (USD Million) Analysis and Forecast By Region, 2026 to 2036
- North America
- Latin America
- Western Europe
- Eastern Europe
- East Asia
- South Asia and Pacific
- Middle East and Africa
- Market Attractiveness Analysis By Region
- North America Market Analysis and Forecast, By Country, 2021 to 2036
- Historical Market Size Value (USD Million) Trend Analysis By Market Taxonomy, 2021 to 2025
- Market Size Value (USD Million) Forecast By Market Taxonomy, 2026 to 2036
- By Country
- United States
- Canada
- By Product Type
- By Form
- By Application
- By Claim
- By Sales Channel
- By Country
- Market Attractiveness Analysis
- By Country
- By Product Type
- By Form
- By Application
- By Claim
- By Sales Channel
- Key Takeaways
- Latin America Market Analysis and Forecast, By Country
- Historical Market Size Value (USD Million) Trend Analysis By Market Taxonomy, 2021 to 2025
- Market Size Value (USD Million) Forecast By Market Taxonomy, 2026 to 2036
- By Country
- Brazil
- Mexico
- Argentina
- Chile
- By Product Type
- By Form
- By Application
- By Claim
- By Sales Channel
- By Country
- Market Attractiveness Analysis
- By Country
- By Product Type
- By Form
- By Application
- By Claim
- By Sales Channel
- Key Takeaways
- Western Europe Market Analysis and Forecast, By Country
- Historical Market Size Value (USD Million) Trend Analysis By Market Taxonomy, 2021 to 2025
- Market Size Value (USD Million) Forecast By Market Taxonomy, 2026 to 2036
- By Country
- Germany
- France
- United Kingdom
- Italy
- Spain
- Benelux
- Nordics
- By Product Type
- By Form
- By Application
- By Claim
- By Sales Channel
- By Country
- Market Attractiveness Analysis
- By Country
- By Product Type
- By Form
- By Application
- By Claim
- By Sales Channel
- Key Takeaways
- Eastern Europe Market Analysis and Forecast, By Country
- Historical Market Size Value (USD Million) Trend Analysis By Market Taxonomy, 2021 to 2025
- Market Size Value (USD Million) Forecast By Market Taxonomy, 2026 to 2036
- By Country
- Poland
- Czech Republic
- Romania
- Hungary
- By Product Type
- By Form
- By Application
- By Claim
- By Sales Channel
- By Country
- Market Attractiveness Analysis
- By Country
- By Product Type
- By Form
- By Application
- By Claim
- By Sales Channel
- Key Takeaways
- East Asia Market Analysis and Forecast, By Country
- Historical Market Size Value (USD Million) Trend Analysis By Market Taxonomy, 2021 to 2025
- Market Size Value (USD Million) Forecast By Market Taxonomy, 2026 to 2036
- By Country
- China
- Japan
- South Korea
- By Product Type
- By Form
- By Application
- By Claim
- By Sales Channel
- By Country
- Market Attractiveness Analysis
- By Country
- By Product Type
- By Form
- By Application
- By Claim
- By Sales Channel
- Key Takeaways
- South Asia and Pacific Market Analysis and Forecast, By Country
- Historical Market Size Value (USD Million) Trend Analysis By Market Taxonomy, 2021 to 2025
- Market Size Value (USD Million) Forecast By Market Taxonomy, 2026 to 2036
- By Country
- India
- ASEAN
- Australia and New Zealand
- By Product Type
- By Form
- By Application
- By Claim
- By Sales Channel
- By Country
- Market Attractiveness Analysis
- By Country
- By Product Type
- By Form
- By Application
- By Claim
- By Sales Channel
- Key Takeaways
- Middle East and Africa Market Analysis and Forecast, By Country
- Historical Market Size Value (USD Million) Trend Analysis By Market Taxonomy, 2021 to 2025
- Market Size Value (USD Million) Forecast By Market Taxonomy, 2026 to 2036
- By Country
- GCC Countries
- South Africa
- Türkiye
- Israel
- By Product Type
- By Form
- By Application
- By Claim
- By Sales Channel
- By Country
- Market Attractiveness Analysis
- By Country
- By Product Type
- By Form
- By Application
- By Claim
- By Sales Channel
- Key Takeaways
- Key Countries Market Analysis
- United States
- Pricing Analysis
- Market Share Analysis, 2025
- By Product Type
- By Form
- By Application
- By Claim
- By Sales Channel
- Canada
- Pricing Analysis
- Market Share Analysis, 2025
- By Product Type
- By Form
- By Application
- By Claim
- By Sales Channel
- Mexico
- Pricing Analysis
- Market Share Analysis, 2025
- By Product Type
- By Form
- By Application
- By Claim
- By Sales Channel
- Brazil
- Pricing Analysis
- Market Share Analysis, 2025
- By Product Type
- By Form
- By Application
- By Claim
- By Sales Channel
- Chile
- Pricing Analysis
- Market Share Analysis, 2025
- By Product Type
- By Form
- By Application
- By Claim
- By Sales Channel
- Germany
- Pricing Analysis
- Market Share Analysis, 2025
- By Product Type
- By Form
- By Application
- By Claim
- By Sales Channel
- United Kingdom
- Pricing Analysis
- Market Share Analysis, 2025
- By Product Type
- By Form
- By Application
- By Claim
- By Sales Channel
- Italy
- Pricing Analysis
- Market Share Analysis, 2025
- By Product Type
- By Form
- By Application
- By Claim
- By Sales Channel
- Spain
- Pricing Analysis
- Market Share Analysis, 2025
- By Product Type
- By Form
- By Application
- By Claim
- By Sales Channel
- France
- Pricing Analysis
- Market Share Analysis, 2025
- By Product Type
- By Form
- By Application
- By Claim
- By Sales Channel
- India
- Pricing Analysis
- Market Share Analysis, 2025
- By Product Type
- By Form
- By Application
- By Claim
- By Sales Channel
- ASEAN
- Pricing Analysis
- Market Share Analysis, 2025
- By Product Type
- By Form
- By Application
- By Claim
- By Sales Channel
- Australia and New Zealand
- Pricing Analysis
- Market Share Analysis, 2025
- By Product Type
- By Form
- By Application
- By Claim
- By Sales Channel
- China
- Pricing Analysis
- Market Share Analysis, 2025
- By Product Type
- By Form
- By Application
- By Claim
- By Sales Channel
- Japan
- Pricing Analysis
- Market Share Analysis, 2025
- By Product Type
- By Form
- By Application
- By Claim
- By Sales Channel
- South Korea
- Pricing Analysis
- Market Share Analysis, 2025
- By Product Type
- By Form
- By Application
- By Claim
- By Sales Channel
- Poland
- Pricing Analysis
- Market Share Analysis, 2025
- By Product Type
- By Form
- By Application
- By Claim
- By Sales Channel
- Hungary
- Pricing Analysis
- Market Share Analysis, 2025
- By Product Type
- By Form
- By Application
- By Claim
- By Sales Channel
- Türkiye
- Pricing Analysis
- Market Share Analysis, 2025
- By Product Type
- By Form
- By Application
- By Claim
- By Sales Channel
- South Africa
- Pricing Analysis
- Market Share Analysis, 2025
- By Product Type
- By Form
- By Application
- By Claim
- By Sales Channel
- UAE
- Pricing Analysis
- Market Share Analysis, 2025
- By Product Type
- By Form
- By Application
- By Claim
- By Sales Channel
- Saudi Arabia
- Pricing Analysis
- Market Share Analysis, 2025
- By Product Type
- By Form
- By Application
- By Claim
- By Sales Channel
- United States
- Market Structure Analysis
- Competition Dashboard
- Competition Benchmarking
- Market Share Analysis of Top Players
- By Regional
- By Product Type
- By Form
- By Application
- By Claim
- By Sales Channel
- Emerging Startups
- Innovation Benchmarking
- Competition Analysis
- Competition Deep Dive
- Barry Callebaut
- Overview
- Product Portfolio
- Profitability by Market Segments
- Sales Footprint
- Strategy Overview
- Marketing Strategy
- Product Strategy
- Channel Strategy
- IRCA Group
- CSM Ingredients
- Fabbri 1905
- Puratos
- Barry Callebaut
- Case Studies
- Success Stories
- Recent Developments
- Competition Deep Dive
- Assumptions & Acronyms Used
List of Tables
- Table 1: Global Market Value (USD Million) Forecast by Region, 2021 to 2036
- Table 2: Global Market Value (USD Million) Forecast by Product Type, 2021 to 2036
- Table 3: Global Market Value (USD Million) Forecast by Form, 2021 to 2036
- Table 4: Global Market Value (USD Million) Forecast by Application, 2021 to 2036
- Table 5: Global Market Value (USD Million) Forecast by Claim, 2021 to 2036
- Table 6: Global Market Value (USD Million) Forecast by Sales Channel, 2021 to 2036
- Table 7: North America Market Value (USD Million) Forecast by Country, 2021 to 2036
- Table 8: North America Market Value (USD Million) Forecast by Product Type, 2021 to 2036
- Table 9: North America Market Value (USD Million) Forecast by Form, 2021 to 2036
- Table 10: North America Market Value (USD Million) Forecast by Application, 2021 to 2036
- Table 11: North America Market Value (USD Million) Forecast by Claim, 2021 to 2036
- Table 12: North America Market Value (USD Million) Forecast by Sales Channel, 2021 to 2036
- Table 13: Latin America Market Value (USD Million) Forecast by Country, 2021 to 2036
- Table 14: Latin America Market Value (USD Million) Forecast by Product Type, 2021 to 2036
- Table 15: Latin America Market Value (USD Million) Forecast by Form, 2021 to 2036
- Table 16: Latin America Market Value (USD Million) Forecast by Application, 2021 to 2036
- Table 17: Latin America Market Value (USD Million) Forecast by Claim, 2021 to 2036
- Table 18: Latin America Market Value (USD Million) Forecast by Sales Channel, 2021 to 2036
- Table 19: Western Europe Market Value (USD Million) Forecast by Country, 2021 to 2036
- Table 20: Western Europe Market Value (USD Million) Forecast by Product Type, 2021 to 2036
- Table 21: Western Europe Market Value (USD Million) Forecast by Form, 2021 to 2036
- Table 22: Western Europe Market Value (USD Million) Forecast by Application, 2021 to 2036
- Table 23: Western Europe Market Value (USD Million) Forecast by Claim, 2021 to 2036
- Table 24: Western Europe Market Value (USD Million) Forecast by Sales Channel, 2021 to 2036
- Table 25: Eastern Europe Market Value (USD Million) Forecast by Country, 2021 to 2036
- Table 26: Eastern Europe Market Value (USD Million) Forecast by Product Type, 2021 to 2036
- Table 27: Eastern Europe Market Value (USD Million) Forecast by Form, 2021 to 2036
- Table 28: Eastern Europe Market Value (USD Million) Forecast by Application, 2021 to 2036
- Table 29: Eastern Europe Market Value (USD Million) Forecast by Claim, 2021 to 2036
- Table 30: Eastern Europe Market Value (USD Million) Forecast by Sales Channel, 2021 to 2036
- Table 31: East Asia Market Value (USD Million) Forecast by Country, 2021 to 2036
- Table 32: East Asia Market Value (USD Million) Forecast by Product Type, 2021 to 2036
- Table 33: East Asia Market Value (USD Million) Forecast by Form, 2021 to 2036
- Table 34: East Asia Market Value (USD Million) Forecast by Application, 2021 to 2036
- Table 35: East Asia Market Value (USD Million) Forecast by Claim, 2021 to 2036
- Table 36: East Asia Market Value (USD Million) Forecast by Sales Channel, 2021 to 2036
- Table 37: South Asia and Pacific Market Value (USD Million) Forecast by Country, 2021 to 2036
- Table 38: South Asia and Pacific Market Value (USD Million) Forecast by Product Type, 2021 to 2036
- Table 39: South Asia and Pacific Market Value (USD Million) Forecast by Form, 2021 to 2036
- Table 40: South Asia and Pacific Market Value (USD Million) Forecast by Application, 2021 to 2036
- Table 41: South Asia and Pacific Market Value (USD Million) Forecast by Claim, 2021 to 2036
- Table 42: South Asia and Pacific Market Value (USD Million) Forecast by Sales Channel, 2021 to 2036
- Table 43: Middle East and Africa Market Value (USD Million) Forecast by Country, 2021 to 2036
- Table 44: Middle East and Africa Market Value (USD Million) Forecast by Product Type, 2021 to 2036
- Table 45: Middle East and Africa Market Value (USD Million) Forecast by Form, 2021 to 2036
- Table 46: Middle East and Africa Market Value (USD Million) Forecast by Application, 2021 to 2036
- Table 47: Middle East and Africa Market Value (USD Million) Forecast by Claim, 2021 to 2036
- Table 48: Middle East and Africa Market Value (USD Million) Forecast by Sales Channel, 2021 to 2036
List of Figures
- Figure 1: Global Market Pricing Analysis
- Figure 2: Global Market Value (USD Million) Forecast 2021-2036
- Figure 3: Global Market Value Share and BPS Analysis by Product Type, 2026 and 2036
- Figure 4: Global Market Y-o-Y Growth Comparison by Product Type, 2026-2036
- Figure 5: Global Market Attractiveness Analysis by Product Type
- Figure 6: Global Market Value Share and BPS Analysis by Form, 2026 and 2036
- Figure 7: Global Market Y-o-Y Growth Comparison by Form, 2026-2036
- Figure 8: Global Market Attractiveness Analysis by Form
- Figure 9: Global Market Value Share and BPS Analysis by Application, 2026 and 2036
- Figure 10: Global Market Y-o-Y Growth Comparison by Application, 2026-2036
- Figure 11: Global Market Attractiveness Analysis by Application
- Figure 12: Global Market Value Share and BPS Analysis by Claim, 2026 and 2036
- Figure 13: Global Market Y-o-Y Growth Comparison by Claim, 2026-2036
- Figure 14: Global Market Attractiveness Analysis by Claim
- Figure 15: Global Market Value Share and BPS Analysis by Sales Channel, 2026 and 2036
- Figure 16: Global Market Y-o-Y Growth Comparison by Sales Channel, 2026-2036
- Figure 17: Global Market Attractiveness Analysis by Sales Channel
- Figure 18: Global Market Value (USD Million) Share and BPS Analysis by Region, 2026 and 2036
- Figure 19: Global Market Y-o-Y Growth Comparison by Region, 2026-2036
- Figure 20: Global Market Attractiveness Analysis by Region
- Figure 21: North America Market Incremental Dollar Opportunity, 2026-2036
- Figure 22: Latin America Market Incremental Dollar Opportunity, 2026-2036
- Figure 23: Western Europe Market Incremental Dollar Opportunity, 2026-2036
- Figure 24: Eastern Europe Market Incremental Dollar Opportunity, 2026-2036
- Figure 25: East Asia Market Incremental Dollar Opportunity, 2026-2036
- Figure 26: South Asia and Pacific Market Incremental Dollar Opportunity, 2026-2036
- Figure 27: Middle East and Africa Market Incremental Dollar Opportunity, 2026-2036
- Figure 28: North America Market Value Share and BPS Analysis by Country, 2026 and 2036
- Figure 29: North America Market Value Share and BPS Analysis by Product Type, 2026 and 2036
- Figure 30: North America Market Y-o-Y Growth Comparison by Product Type, 2026-2036
- Figure 31: North America Market Attractiveness Analysis by Product Type
- Figure 32: North America Market Value Share and BPS Analysis by Form, 2026 and 2036
- Figure 33: North America Market Y-o-Y Growth Comparison by Form, 2026-2036
- Figure 34: North America Market Attractiveness Analysis by Form
- Figure 35: North America Market Value Share and BPS Analysis by Application, 2026 and 2036
- Figure 36: North America Market Y-o-Y Growth Comparison by Application, 2026-2036
- Figure 37: North America Market Attractiveness Analysis by Application
- Figure 38: North America Market Value Share and BPS Analysis by Claim, 2026 and 2036
- Figure 39: North America Market Y-o-Y Growth Comparison by Claim, 2026-2036
- Figure 40: North America Market Attractiveness Analysis by Claim
- Figure 41: North America Market Value Share and BPS Analysis by Sales Channel, 2026 and 2036
- Figure 42: North America Market Y-o-Y Growth Comparison by Sales Channel, 2026-2036
- Figure 43: North America Market Attractiveness Analysis by Sales Channel
- Figure 44: Latin America Market Value Share and BPS Analysis by Country, 2026 and 2036
- Figure 45: Latin America Market Value Share and BPS Analysis by Product Type, 2026 and 2036
- Figure 46: Latin America Market Y-o-Y Growth Comparison by Product Type, 2026-2036
- Figure 47: Latin America Market Attractiveness Analysis by Product Type
- Figure 48: Latin America Market Value Share and BPS Analysis by Form, 2026 and 2036
- Figure 49: Latin America Market Y-o-Y Growth Comparison by Form, 2026-2036
- Figure 50: Latin America Market Attractiveness Analysis by Form
- Figure 51: Latin America Market Value Share and BPS Analysis by Application, 2026 and 2036
- Figure 52: Latin America Market Y-o-Y Growth Comparison by Application, 2026-2036
- Figure 53: Latin America Market Attractiveness Analysis by Application
- Figure 54: Latin America Market Value Share and BPS Analysis by Claim, 2026 and 2036
- Figure 55: Latin America Market Y-o-Y Growth Comparison by Claim, 2026-2036
- Figure 56: Latin America Market Attractiveness Analysis by Claim
- Figure 57: Latin America Market Value Share and BPS Analysis by Sales Channel, 2026 and 2036
- Figure 58: Latin America Market Y-o-Y Growth Comparison by Sales Channel, 2026-2036
- Figure 59: Latin America Market Attractiveness Analysis by Sales Channel
- Figure 60: Western Europe Market Value Share and BPS Analysis by Country, 2026 and 2036
- Figure 61: Western Europe Market Value Share and BPS Analysis by Product Type, 2026 and 2036
- Figure 62: Western Europe Market Y-o-Y Growth Comparison by Product Type, 2026-2036
- Figure 63: Western Europe Market Attractiveness Analysis by Product Type
- Figure 64: Western Europe Market Value Share and BPS Analysis by Form, 2026 and 2036
- Figure 65: Western Europe Market Y-o-Y Growth Comparison by Form, 2026-2036
- Figure 66: Western Europe Market Attractiveness Analysis by Form
- Figure 67: Western Europe Market Value Share and BPS Analysis by Application, 2026 and 2036
- Figure 68: Western Europe Market Y-o-Y Growth Comparison by Application, 2026-2036
- Figure 69: Western Europe Market Attractiveness Analysis by Application
- Figure 70: Western Europe Market Value Share and BPS Analysis by Claim, 2026 and 2036
- Figure 71: Western Europe Market Y-o-Y Growth Comparison by Claim, 2026-2036
- Figure 72: Western Europe Market Attractiveness Analysis by Claim
- Figure 73: Western Europe Market Value Share and BPS Analysis by Sales Channel, 2026 and 2036
- Figure 74: Western Europe Market Y-o-Y Growth Comparison by Sales Channel, 2026-2036
- Figure 75: Western Europe Market Attractiveness Analysis by Sales Channel
- Figure 76: Eastern Europe Market Value Share and BPS Analysis by Country, 2026 and 2036
- Figure 77: Eastern Europe Market Value Share and BPS Analysis by Product Type, 2026 and 2036
- Figure 78: Eastern Europe Market Y-o-Y Growth Comparison by Product Type, 2026-2036
- Figure 79: Eastern Europe Market Attractiveness Analysis by Product Type
- Figure 80: Eastern Europe Market Value Share and BPS Analysis by Form, 2026 and 2036
- Figure 81: Eastern Europe Market Y-o-Y Growth Comparison by Form, 2026-2036
- Figure 82: Eastern Europe Market Attractiveness Analysis by Form
- Figure 83: Eastern Europe Market Value Share and BPS Analysis by Application, 2026 and 2036
- Figure 84: Eastern Europe Market Y-o-Y Growth Comparison by Application, 2026-2036
- Figure 85: Eastern Europe Market Attractiveness Analysis by Application
- Figure 86: Eastern Europe Market Value Share and BPS Analysis by Claim, 2026 and 2036
- Figure 87: Eastern Europe Market Y-o-Y Growth Comparison by Claim, 2026-2036
- Figure 88: Eastern Europe Market Attractiveness Analysis by Claim
- Figure 89: Eastern Europe Market Value Share and BPS Analysis by Sales Channel, 2026 and 2036
- Figure 90: Eastern Europe Market Y-o-Y Growth Comparison by Sales Channel, 2026-2036
- Figure 91: Eastern Europe Market Attractiveness Analysis by Sales Channel
- Figure 92: East Asia Market Value Share and BPS Analysis by Country, 2026 and 2036
- Figure 93: East Asia Market Value Share and BPS Analysis by Product Type, 2026 and 2036
- Figure 94: East Asia Market Y-o-Y Growth Comparison by Product Type, 2026-2036
- Figure 95: East Asia Market Attractiveness Analysis by Product Type
- Figure 96: East Asia Market Value Share and BPS Analysis by Form, 2026 and 2036
- Figure 97: East Asia Market Y-o-Y Growth Comparison by Form, 2026-2036
- Figure 98: East Asia Market Attractiveness Analysis by Form
- Figure 99: East Asia Market Value Share and BPS Analysis by Application, 2026 and 2036
- Figure 100: East Asia Market Y-o-Y Growth Comparison by Application, 2026-2036
- Figure 101: East Asia Market Attractiveness Analysis by Application
- Figure 102: East Asia Market Value Share and BPS Analysis by Claim, 2026 and 2036
- Figure 103: East Asia Market Y-o-Y Growth Comparison by Claim, 2026-2036
- Figure 104: East Asia Market Attractiveness Analysis by Claim
- Figure 105: East Asia Market Value Share and BPS Analysis by Sales Channel, 2026 and 2036
- Figure 106: East Asia Market Y-o-Y Growth Comparison by Sales Channel, 2026-2036
- Figure 107: East Asia Market Attractiveness Analysis by Sales Channel
- Figure 108: South Asia and Pacific Market Value Share and BPS Analysis by Country, 2026 and 2036
- Figure 109: South Asia and Pacific Market Value Share and BPS Analysis by Product Type, 2026 and 2036
- Figure 110: South Asia and Pacific Market Y-o-Y Growth Comparison by Product Type, 2026-2036
- Figure 111: South Asia and Pacific Market Attractiveness Analysis by Product Type
- Figure 112: South Asia and Pacific Market Value Share and BPS Analysis by Form, 2026 and 2036
- Figure 113: South Asia and Pacific Market Y-o-Y Growth Comparison by Form, 2026-2036
- Figure 114: South Asia and Pacific Market Attractiveness Analysis by Form
- Figure 115: South Asia and Pacific Market Value Share and BPS Analysis by Application, 2026 and 2036
- Figure 116: South Asia and Pacific Market Y-o-Y Growth Comparison by Application, 2026-2036
- Figure 117: South Asia and Pacific Market Attractiveness Analysis by Application
- Figure 118: South Asia and Pacific Market Value Share and BPS Analysis by Claim, 2026 and 2036
- Figure 119: South Asia and Pacific Market Y-o-Y Growth Comparison by Claim, 2026-2036
- Figure 120: South Asia and Pacific Market Attractiveness Analysis by Claim
- Figure 121: South Asia and Pacific Market Value Share and BPS Analysis by Sales Channel, 2026 and 2036
- Figure 122: South Asia and Pacific Market Y-o-Y Growth Comparison by Sales Channel, 2026-2036
- Figure 123: South Asia and Pacific Market Attractiveness Analysis by Sales Channel
- Figure 124: Middle East and Africa Market Value Share and BPS Analysis by Country, 2026 and 2036
- Figure 125: Middle East and Africa Market Value Share and BPS Analysis by Product Type, 2026 and 2036
- Figure 126: Middle East and Africa Market Y-o-Y Growth Comparison by Product Type, 2026-2036
- Figure 127: Middle East and Africa Market Attractiveness Analysis by Product Type
- Figure 128: Middle East and Africa Market Value Share and BPS Analysis by Form, 2026 and 2036
- Figure 129: Middle East and Africa Market Y-o-Y Growth Comparison by Form, 2026-2036
- Figure 130: Middle East and Africa Market Attractiveness Analysis by Form
- Figure 131: Middle East and Africa Market Value Share and BPS Analysis by Application, 2026 and 2036
- Figure 132: Middle East and Africa Market Y-o-Y Growth Comparison by Application, 2026-2036
- Figure 133: Middle East and Africa Market Attractiveness Analysis by Application
- Figure 134: Middle East and Africa Market Value Share and BPS Analysis by Claim, 2026 and 2036
- Figure 135: Middle East and Africa Market Y-o-Y Growth Comparison by Claim, 2026-2036
- Figure 136: Middle East and Africa Market Attractiveness Analysis by Claim
- Figure 137: Middle East and Africa Market Value Share and BPS Analysis by Sales Channel, 2026 and 2036
- Figure 138: Middle East and Africa Market Y-o-Y Growth Comparison by Sales Channel, 2026-2036
- Figure 139: Middle East and Africa Market Attractiveness Analysis by Sales Channel
- Figure 140: Global Market - Tier Structure Analysis
- Figure 141: Global Market - Company Share Analysis
Frequently Asked Questions
How big is the feuilletine & crispy inclusions market in 2026, and what is forecast for 2036?
The market is valued at USD 411.0 million in 2026 and is forecast to reach USD 955.3 million by 2036.
What is the CAGR of the feuilletine & crispy inclusions market from 2026 to 2036?
The market is projected to grow at a CAGR of 8.8% from 2026 to 2036.
Which Product Type segment leads the feuilletine & crispy inclusions market?
Chocolate pieces lead with 27.0% of Product Type revenue in 2026.
Which Form segment leads the feuilletine & crispy inclusions market?
Powder / dry accounts for 42.0% of Form revenue in 2026.
Which profiled countries have the highest forecast CAGRs?
The UAE leads at 10.2%, followed by Saudi Arabia at 9.9% and South Korea at 9.5% from 2026 to 2036.
Which companies participate in the feuilletine & crispy inclusions market?
The report profiles Barry Callebaut, IRCA Group, CSM Ingredients, Fabbri 1905 and Puratos, whose offers span loose inclusions, crunchy creams and compatible filling systems.
Preview the report firsthand - request a free sample
Get SampleGet the brochure for pricing and purchase details.
Get PDF
