Flexographic Ink Market Size and Share Forecast Outlook 2025 to 2035

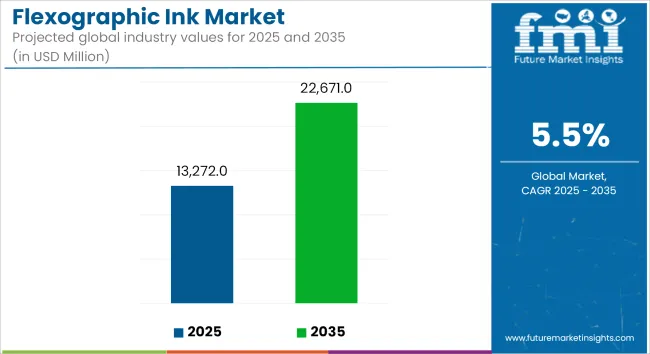
The global flexographic ink market is estimated to reach USD 13,272 million in 2025 and grow to USD 22,671 million by 2035, advancing at a CAGR of 5.5% during the forecast period. Market expansion is being driven by rising demand for flexible packaging across the food and beverage industry and increased preference for environmentally sustainable print solutions.
Quick Stats for Flexographic Ink Market

  • Industry Value (2025): USD 13,272 Million
  • Forecast Value (2035): USD 22,671 Million
  • Forecast CAGR (2025 to 2035): 5.5%
  • Leading Technology in 2025: Water-based Inks (~39% share)
  • Top Key Players: Sun Chemical, Siegwerk Druckfarben, Flint Group, DIC Corporation, Toyo Ink SC Holdings, INX International

Flexographic Ink Market   Industry Value Analysis

Metric Value
Industry Size (2025E) USD 13,272 million
Industry Value (2035F) USD 22,671 million
CAGR (2025 to 2035) 5.5%

Flexographic inks are being utilized in high-speed printing applications for packaging substrates such as paper, plastic films, metallic foils, and labels. With packaging design playing a critical role in brand differentiation and consumer appeal, the need for high-performance and visually consistent inks has been increasing. In particular, the food and beverage sector is promoting the use of safe, low-migration, and compliant ink technologies for flexible packaging formats such as pouches, wrappers, and cartons.

The shift toward water-based flexographic inks is accelerating, supported by regulatory pressure to reduce volatile organic compound (VOC) emissions and enhance sustainability. Water-based inks are being preferred for food-contact packaging applications due to their low toxicity, ease of cleanup, and minimal environmental impact. These inks are also being adopted to meet compliance with environmental directives such as the European REACH regulation and the USA Clean Air Act.

Solvent-based inks continue to be used in applications requiring fast drying and high abrasion resistance, particularly for outdoor or industrial labels. However, adoption is gradually declining due to stricter emissions standards, worker safety concerns, and waste disposal issues. As a result, water-based systems are capturing a larger share of the flexographic ink market.

In response to the demand for greener print technologies, ink manufacturers are investing in the development of bio-based ink formulations, low-energy curing solutions, and pigment dispersion technologies that enhance color performance while reducing environmental impact. The growing emphasis on compostable and recyclable packaging has further supported the adoption of water-based flexographic inks.

With continued growth in packaged food consumption, e-commerce, and private label goods, the flexographic ink market is expected to sustain steady momentum through 2035, supported by innovation in sustainable printing and compliance-driven product development.

Analyzing Flexographic Ink Market by Top Investing Segments

Water-based Ink Technology Leads as Regulatory Pressures Mount

Water-based flexographic inks are anticipated to command approximately 39% of global market share in 2025, advancing at a CAGR of 6.8% through 2035. This dominance stems from increasing environmental legislation restricting VOC emissions and growing demand for eco-labeled packaging. These inks are widely used for printing on corrugated board, tissue, and paper sacks in applications like foodservice packaging, grocery bags, and industrial shipping containers.

Western Europe and North America are seeing a marked transition from solvent-based to water-based ink formulations as national air quality norms tighten. Ink manufacturers are investing in polymer emulsions and stabilizers to enhance drying speed, rub resistance, and print definition on porous surfaces. In emerging economies, modernization of converting equipment and better availability of water-based formulations are further catalyzing adoption.

Consumer brands are also leaning toward water-based inks to meet their Scope 3 emission reduction targets, pushing converters to adopt more sustainable printing practices. The segment’s continued growth is underpinned by product innovation, regulatory harmonization (e.g., REACH, EPA, and FDA), and cost competitiveness in large-volume print runs.
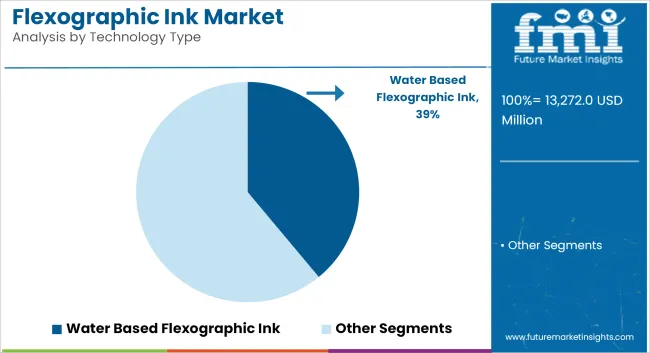
Flexographic Ink Market   Analysis By Technology Type

Flexographic Ink for Flexible Packaging Gains Ground with Sustainable and High-Performance Solutions

Flexible packaging stands as the largest and fastest-growing application segment in the global flexographic ink market, accounting for an estimated 42% of total ink consumption in 2025, with growth projected at a CAGR of 6.9% through 2035. The segment’s momentum is being driven by the widespread adoption of flexible packaging formats across food, beverage, personal care, pet food, and home care industries, where packaging must balance shelf appeal, durability, regulatory compliance, and environmental impact.

Flexographic inks are particularly well-suited for printing on plastic films (e.g., polyethylene, polypropylene, BOPP), aluminum foils, and biodegradable substrates used in flexible packaging due to their high print speed compatibility, fast drying characteristics, and formulation versatility. With converters shifting toward high-definition printing, brands are increasingly relying on advanced flexographic inks to achieve vivid color reproduction, smudge resistance, and brand consistency on flexible surfaces that require durability and aesthetic appeal.

The demand for low-VOC, non-toxic, and food-safe inks has accelerated the transition to water-based and UV-curable flexographic inks in this segment. In North America and the EU, brands and retailers are mandating the use of inks that are compliant with regulations like FDA 21 CFR, Swiss Ordinance, REACH, and EuPIA guidelines, prompting a surge in adoption of low-migration flexo ink systems for primary food packaging.
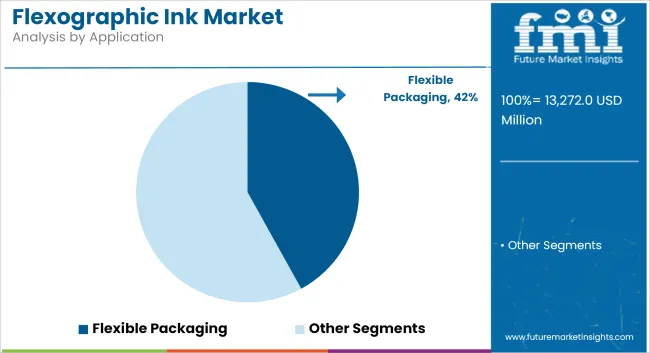
Flexographic Ink Market   Analysis By Application

Challenges and Opportunities

Challenges

VOC Emissions and Environmental Controls

Environmental control is challenging the flexographic ink industry with VOC emission regulation. High-VOC, old-history inks and solvent chemistry are so out of style now, so demand is reducing. Clean technology investment on capital, at least more cost of manufacturing and technology-altering, is being demanded by firms.

Opportunities

Sustainable Ink Technologies Innovation

An increased focus on sustainability can result in innovation as well, particularly regarding ink technologies. Bio-based, water-based and UV-curable inks demonstrate promise in meeting environmental demands and the high level of need for sustainable packaging. And, with improvements to performance, adhesion and drying rates, the potential for their innovations have been realized: the creation of inks that, in an advisory role, would provide competitive value.
Country Wise Outlook

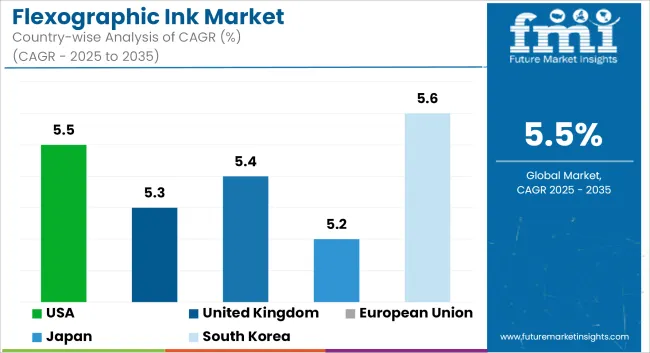
Flexographic Ink Market   CAGR Analysis By Country

United States

USA flexographic ink market is growing at a slower pace as flexible type Food and Beverage Packaging Solution is required to meet growing demand. This, combined with the growing demand for water-based low VOC emitting flexographic ink owing to increased environmental concerns and the transition to green friendly packaging solutions, have further built the momentum of demand. Also, the evolution of technology and the print quality, and the effectiveness of the flexographic printing has contributed to bring improvement in the market.

Country CAGR (2025 to 2035)
USA 5.5%

United Kingdom

In the United Kingdom, the market for flexographic ink is expanding at a sluggish rate. Greater application of green inks, particularly water-based inks, is because of compliance with strict environmental laws and customers' need for sustainable packaging. Greater activity in the e-commerce market is also fuelling greater demand for quality packaging, thereby driving the market.

Country CAGR (2025 to 2035)
UK 5.3%

European Union

European Union flexographic ink market is characterized by steady growth with the world's attention focused on circular economy and sustainability in the region. Germany, France, and Italy are at the forefront of implementing water-based and UV-curable flexographic inks. Reduction of carbon footprint and recyclability trends in packaging are pushing the market.

Region CAGR (2025 to 2035)
European Union 5.4%

Japan

Japanese flexographic ink market is growing at a slow rate owing to the innovative nature of print solutions and higher-quality packaging demand in Japan. Because of the environmental friendliness and fast-drying nature, uses of UV-curable flexographic inks are increasing. The naturally beautiful packaging demand of the cosmetics and personal care industry also drives the market.

Country CAGR (2025 to 2035)
Japan 5.2%

South Korea

South Korean flexographic ink market is expanding on the strength of increasing packaging business and expansion in export of packaged goods. Consumer durables and consumer electronics industry demand for high-quality, durable packing has spurred expansion in advanced flexographic printing. Expansion in demand towards green packing solution also favours increasing market size.

Country CAGR (2025 to 2035)
South Korea 5.6%

Competitive Outlook

The flexographic ink market is moderately consolidated, with leading players actively pursuing technology upgrades, acquisitions, and sustainability-driven innovations to gain market share. Competitive differentiation is being shaped by formulation expertise, compliance with environmental and food safety standards, and the ability to deliver customized inks for varied substrates and press configurations.

Global players such as Sun Chemical, Flint Group, and DIC Corporation are expanding their manufacturing and R&D capabilities across Asia-Pacific and Latin America to serve fast-growing packaging hubs. Strategic partnerships with packaging converters and OEMs (Original Equipment Manufacturers) are enabling ink producers to co-develop high-performance, low-emission ink solutions that align with evolving customer demands.
  • Nov 2025, Siegwerk unveiled the industry’s first NC-free flexographic ink systems for polyethylene (PE) and polypropylene (PP) packaging. These inks eliminate nitrocellulose, a component that hinders recyclability, thereby enhancing the quality of recycled materials. Fully compliant with RecyClass and CEFLEX guidelines, the new inks maintain high performance standards, including print fidelity and drying speed. This development supports brand owners and converters in achieving sustainable packaging goals without compromising on quality, marking a significant step toward circular packaging solutions in flexographic printing.
  • April 1, 2025, Flint Group introduced a new range of sustainable flexographic inks at INFOFLEX 2025. The ZenCode CPT inks are certified compostable, ideal for eco-friendly packaging. FlexiPrint MV and FlexiStar MV are solvent-based inks optimized for mono-material substrates, supporting recyclability. Additionally, OctaCode water-based inks were launched for food-safe fiber packaging, offering excellent print quality and durability. These innovations align with Flint Group’s commitment to circular economy principles and help converters meet evolving environmental and regulatory demands.

Flexographic Ink Market   Analysis By Company

Key Players

  • Flint Group
  • Dic Corporation
  • Toyo Ink Sc Holdings Co., Ltd.
  • Sakata Inx Corporation
  • Siegwerk Druckfarben Ag & Co. Kgaa
  • Hubergroup
  • Colorcon
  • T&K Toka Corporation
  • Tokyo Printing Ink Mfg. Co., Ltd.
  • Sicpa Holding Sa

Key segmentation

By Technology Type:

  • Water Based Flexographic Ink
  • Solvent Based Flexographic Ink
  • UV Based Flexographic Ink
  • Resin Type (Nitrocellulose, Polyamides, Polyurethane, Acrylic)

By Application:

  • Flexographic Ink for Corrugated Cardboards
  • Flexographic Ink for Flexible Packaging
  • Flexographic Ink for Tags & Labels
  • Flexographic Ink for Folding Cartons

By Region:

  • North America
  • Latin America
  • Western Europe
  • Eastern Europe
  • APEJ
  • Middle East & Africa

Table of Content

  1. Executive Summary
  2. Industry Introduction, including Taxonomy and Market Definition
  3. Market Trends and Success Factors, including Macro-economic Factors, Market Dynamics, and Recent Industry Developments
  4. Global Market Demand Analysis 2020 to 2024 and Forecast 2025 to 2035, including Historical Analysis and Future Projections
  5. Pricing Analysis
  6. Global Market Analysis 2020 to 2024 and Forecast 2025 to 2035
    • Technology Type
    • Application
  7. Global Market Analysis 2020 to 2024 and Forecast 2025 to 2035, By Technology Type
    • Water Based Flexographic Ink
    • Solvent Based Flexographic Ink
    • UV Based Flexographic Ink
    • Resin Type (Nitrocellulose, Polyamides, Polyurethane, Acrylic)
  8. Global Market Analysis 2020 to 2024 and Forecast 2025 to 2035, By Application
    • for Corrugated Cardboards
    • for Flexible Packaging
    • for Tags & Labels
    • for Folding Cartons
  9. Global Market Analysis 2020 to 2024 and Forecast 2025 to 2035, By Region
    • North America
    • Latin America
    • Western Europe
    • Eastern Europe
    • East Asia
    • South Asia Pacific
    • Middle East and Africa
  10. North America Sales Analysis 2020 to 2024 and Forecast 2025 to 2035, by Key Segments and Countries
  11. Latin America Sales Analysis 2020 to 2024 and Forecast 2025 to 2035, by Key Segments and Countries
  12. Western Europe Sales Analysis 2020 to 2024 and Forecast 2025 to 2035, by Key Segments and Countries
  13. Eastern Europe Sales Analysis 2020 to 2024 and Forecast 2025 to 2035, by Key Segments and Countries
  14. East Asia Sales Analysis 2020 to 2024 and Forecast 2025 to 2035, by Key Segments and Countries
  15. South Asia Pacific Sales Analysis 2020 to 2024 and Forecast 2025 to 2035, by Key Segments and Countries
  16. Middle East and Africa Sales Analysis 2020 to 2024 and Forecast 2025 to 2035, by Key Segments and Countries
  17. Sales Forecast 2025 to 2035 by Technology Type and Application for 30 Countries
  18. Competition Outlook, including Market Structure Analysis, Company Share Analysis by Key Players, and Competition Dashboard
  19. Company Profile
    • Flint Group
    • DIC CORPORATION
    • TOYO INK SC HOLDINGS CO., LTD.
    • SAKATA INX CORPORATION
    • Siegwerk Druckfarben AG & Co. KGaA
    • Hubergroup
    • Colorcon
    • T&K TOKA Corporation
    • TOKYO Printing Ink Mfg. Co., Ltd.
    • SICPA HOLDING SA

List of Tables

  • Table 1: Global Market Value (USD Million) Forecast by Region, 2020 to 2035
  • Table 2: Global Market Volume (Tons) Forecast by Region, 2020 to 2035
  • Table 3: Global Market Value (USD Million) Forecast by Product Type, 2020 to 2035
  • Table 4: Global Market Volume (Tons) Forecast by Product Type, 2020 to 2035
  • Table 5: Global Market Value (USD Million) Forecast by Application, 2020 to 2035
  • Table 6: Global Market Volume (Tons) Forecast by Application, 2020 to 2035
  • Table 7: North America Market Value (USD Million) Forecast by Country, 2020 to 2035
  • Table 8: North America Market Volume (Tons) Forecast by Country, 2020 to 2035
  • Table 9: North America Market Value (USD Million) Forecast by Product Type, 2020 to 2035
  • Table 10: North America Market Volume (Tons) Forecast by Product Type, 2020 to 2035
  • Table 11: North America Market Value (USD Million) Forecast by Application, 2020 to 2035
  • Table 12: North America Market Volume (Tons) Forecast by Application, 2020 to 2035
  • Table 13: Latin America Market Value (USD Million) Forecast by Country, 2020 to 2035
  • Table 14: Latin America Market Volume (Tons) Forecast by Country, 2020 to 2035
  • Table 15: Latin America Market Value (USD Million) Forecast by Product Type, 2020 to 2035
  • Table 16: Latin America Market Volume (Tons) Forecast by Product Type, 2020 to 2035
  • Table 17: Latin America Market Value (USD Million) Forecast by Application, 2020 to 2035
  • Table 18: Latin America Market Volume (Tons) Forecast by Application, 2020 to 2035
  • Table 19: Europe Market Value (USD Million) Forecast by Country, 2020 to 2035
  • Table 20: Europe Market Volume (Tons) Forecast by Country, 2020 to 2035
  • Table 21: Europe Market Value (USD Million) Forecast by Product Type, 2020 to 2035
  • Table 22: Europe Market Volume (Tons) Forecast by Product Type, 2020 to 2035
  • Table 23: Europe Market Value (USD Million) Forecast by Application, 2020 to 2035
  • Table 24: Europe Market Volume (Tons) Forecast by Application, 2020 to 2035
  • Table 25: East Asia Market Value (USD Million) Forecast by Country, 2020 to 2035
  • Table 26: East Asia Market Volume (Tons) Forecast by Country, 2020 to 2035
  • Table 27: East Asia Market Value (USD Million) Forecast by Product Type, 2020 to 2035
  • Table 28: East Asia Market Volume (Tons) Forecast by Product Type, 2020 to 2035
  • Table 29: East Asia Market Value (USD Million) Forecast by Application, 2020 to 2035
  • Table 30: East Asia Market Volume (Tons) Forecast by Application, 2020 to 2035
  • Table 31: South Asia & Pacific Market Value (USD Million) Forecast by Country, 2020 to 2035
  • Table 32: South Asia & Pacific Market Volume (Tons) Forecast by Country, 2020 to 2035
  • Table 33: South Asia & Pacific Market Value (USD Million) Forecast by Product Type, 2020 to 2035
  • Table 34: South Asia & Pacific Market Volume (Tons) Forecast by Product Type, 2020 to 2035
  • Table 35: South Asia & Pacific Market Value (USD Million) Forecast by Application, 2020 to 2035
  • Table 36: South Asia & Pacific Market Volume (Tons) Forecast by Application, 2020 to 2035
  • Table 37: MEA Market Value (USD Million) Forecast by Country, 2020 to 2035
  • Table 38: MEA Market Volume (Tons) Forecast by Country, 2020 to 2035
  • Table 39: MEA Market Value (USD Million) Forecast by Product Type, 2020 to 2035
  • Table 40: MEA Market Volume (Tons) Forecast by Product Type, 2020 to 2035
  • Table 41: MEA Market Value (USD Million) Forecast by Application, 2020 to 2035
  • Table 42: MEA Market Volume (Tons) Forecast by Application, 2020 to 2035

List of Figures

  • Figure 1: Global Market Value (USD Million) by Product Type, 2025 to 2035
  • Figure 2: Global Market Value (USD Million) by Application, 2025 to 2035
  • Figure 3: Global Market Value (USD Million) by Region, 2025 to 2035
  • Figure 4: Global Market Value (USD Million) Analysis by Region, 2020 to 2035
  • Figure 5: Global Market Volume (Tons) Analysis by Region, 2020 to 2035
  • Figure 6: Global Market Value Share (%) and BPS Analysis by Region, 2025 to 2035
  • Figure 7: Global Market Y-o-Y Growth (%) Projections by Region, 2025 to 2035
  • Figure 8: Global Market Value (USD Million) Analysis by Product Type, 2020 to 2035
  • Figure 9: Global Market Volume (Tons) Analysis by Product Type, 2020 to 2035
  • Figure 10: Global Market Value Share (%) and BPS Analysis by Product Type, 2025 to 2035
  • Figure 11: Global Market Y-o-Y Growth (%) Projections by Product Type, 2025 to 2035
  • Figure 12: Global Market Value (USD Million) Analysis by Application, 2020 to 2035
  • Figure 13: Global Market Volume (Tons) Analysis by Application, 2020 to 2035
  • Figure 14: Global Market Value Share (%) and BPS Analysis by Application, 2025 to 2035
  • Figure 15: Global Market Y-o-Y Growth (%) Projections by Application, 2025 to 2035
  • Figure 16: Global Market Attractiveness by Product Type, 2025 to 2035
  • Figure 17: Global Market Attractiveness by Application, 2025 to 2035
  • Figure 18: Global Market Attractiveness by Region, 2025 to 2035
  • Figure 19: North America Market Value (USD Million) by Product Type, 2025 to 2035
  • Figure 20: North America Market Value (USD Million) by Application, 2025 to 2035
  • Figure 21: North America Market Value (USD Million) by Country, 2025 to 2035
  • Figure 22: North America Market Value (USD Million) Analysis by Country, 2020 to 2035
  • Figure 23: North America Market Volume (Tons) Analysis by Country, 2020 to 2035
  • Figure 24: North America Market Value Share (%) and BPS Analysis by Country, 2025 to 2035
  • Figure 25: North America Market Y-o-Y Growth (%) Projections by Country, 2025 to 2035
  • Figure 26: North America Market Value (USD Million) Analysis by Product Type, 2020 to 2035
  • Figure 27: North America Market Volume (Tons) Analysis by Product Type, 2020 to 2035
  • Figure 28: North America Market Value Share (%) and BPS Analysis by Product Type, 2025 to 2035
  • Figure 29: North America Market Y-o-Y Growth (%) Projections by Product Type, 2025 to 2035
  • Figure 30: North America Market Value (USD Million) Analysis by Application, 2020 to 2035
  • Figure 31: North America Market Volume (Tons) Analysis by Application, 2020 to 2035
  • Figure 32: North America Market Value Share (%) and BPS Analysis by Application, 2025 to 2035
  • Figure 33: North America Market Y-o-Y Growth (%) Projections by Application, 2025 to 2035
  • Figure 34: North America Market Attractiveness by Product Type, 2025 to 2035
  • Figure 35: North America Market Attractiveness by Application, 2025 to 2035
  • Figure 36: North America Market Attractiveness by Country, 2025 to 2035
  • Figure 37: Latin America Market Value (USD Million) by Product Type, 2025 to 2035
  • Figure 38: Latin America Market Value (USD Million) by Application, 2025 to 2035
  • Figure 39: Latin America Market Value (USD Million) by Country, 2025 to 2035
  • Figure 40: Latin America Market Value (USD Million) Analysis by Country, 2020 to 2035
  • Figure 41: Latin America Market Volume (Tons) Analysis by Country, 2020 to 2035
  • Figure 42: Latin America Market Value Share (%) and BPS Analysis by Country, 2025 to 2035
  • Figure 43: Latin America Market Y-o-Y Growth (%) Projections by Country, 2025 to 2035
  • Figure 44: Latin America Market Value (USD Million) Analysis by Product Type, 2020 to 2035
  • Figure 45: Latin America Market Volume (Tons) Analysis by Product Type, 2020 to 2035
  • Figure 46: Latin America Market Value Share (%) and BPS Analysis by Product Type, 2025 to 2035
  • Figure 47: Latin America Market Y-o-Y Growth (%) Projections by Product Type, 2025 to 2035
  • Figure 48: Latin America Market Value (USD Million) Analysis by Application, 2020 to 2035
  • Figure 49: Latin America Market Volume (Tons) Analysis by Application, 2020 to 2035
  • Figure 50: Latin America Market Value Share (%) and BPS Analysis by Application, 2025 to 2035
  • Figure 51: Latin America Market Y-o-Y Growth (%) Projections by Application, 2025 to 2035
  • Figure 52: Latin America Market Attractiveness by Product Type, 2025 to 2035
  • Figure 53: Latin America Market Attractiveness by Application, 2025 to 2035
  • Figure 54: Latin America Market Attractiveness by Country, 2025 to 2035
  • Figure 55: Europe Market Value (USD Million) by Product Type, 2025 to 2035
  • Figure 56: Europe Market Value (USD Million) by Application, 2025 to 2035
  • Figure 57: Europe Market Value (USD Million) by Country, 2025 to 2035
  • Figure 58: Europe Market Value (USD Million) Analysis by Country, 2020 to 2035
  • Figure 59: Europe Market Volume (Tons) Analysis by Country, 2020 to 2035
  • Figure 60: Europe Market Value Share (%) and BPS Analysis by Country, 2025 to 2035
  • Figure 61: Europe Market Y-o-Y Growth (%) Projections by Country, 2025 to 2035
  • Figure 62: Europe Market Value (USD Million) Analysis by Product Type, 2020 to 2035
  • Figure 63: Europe Market Volume (Tons) Analysis by Product Type, 2020 to 2035
  • Figure 64: Europe Market Value Share (%) and BPS Analysis by Product Type, 2025 to 2035
  • Figure 65: Europe Market Y-o-Y Growth (%) Projections by Product Type, 2025 to 2035
  • Figure 66: Europe Market Value (USD Million) Analysis by Application, 2020 to 2035
  • Figure 67: Europe Market Volume (Tons) Analysis by Application, 2020 to 2035
  • Figure 68: Europe Market Value Share (%) and BPS Analysis by Application, 2025 to 2035
  • Figure 69: Europe Market Y-o-Y Growth (%) Projections by Application, 2025 to 2035
  • Figure 70: Europe Market Attractiveness by Product Type, 2025 to 2035
  • Figure 71: Europe Market Attractiveness by Application, 2025 to 2035
  • Figure 72: Europe Market Attractiveness by Country, 2025 to 2035
  • Figure 73: East Asia Market Value (USD Million) by Product Type, 2025 to 2035
  • Figure 74: East Asia Market Value (USD Million) by Application, 2025 to 2035
  • Figure 75: East Asia Market Value (USD Million) by Country, 2025 to 2035
  • Figure 76: East Asia Market Value (USD Million) Analysis by Country, 2020 to 2035
  • Figure 77: East Asia Market Volume (Tons) Analysis by Country, 2020 to 2035
  • Figure 78: East Asia Market Value Share (%) and BPS Analysis by Country, 2025 to 2035
  • Figure 79: East Asia Market Y-o-Y Growth (%) Projections by Country, 2025 to 2035
  • Figure 80: East Asia Market Value (USD Million) Analysis by Product Type, 2020 to 2035
  • Figure 81: East Asia Market Volume (Tons) Analysis by Product Type, 2020 to 2035
  • Figure 82: East Asia Market Value Share (%) and BPS Analysis by Product Type, 2025 to 2035
  • Figure 83: East Asia Market Y-o-Y Growth (%) Projections by Product Type, 2025 to 2035
  • Figure 84: East Asia Market Value (USD Million) Analysis by Application, 2020 to 2035
  • Figure 85: East Asia Market Volume (Tons) Analysis by Application, 2020 to 2035
  • Figure 86: East Asia Market Value Share (%) and BPS Analysis by Application, 2025 to 2035
  • Figure 87: East Asia Market Y-o-Y Growth (%) Projections by Application, 2025 to 2035
  • Figure 88: East Asia Market Attractiveness by Product Type, 2025 to 2035
  • Figure 89: East Asia Market Attractiveness by Application, 2025 to 2035
  • Figure 90: East Asia Market Attractiveness by Country, 2025 to 2035
  • Figure 91: South Asia & Pacific Market Value (USD Million) by Product Type, 2025 to 2035
  • Figure 92: South Asia & Pacific Market Value (USD Million) by Application, 2025 to 2035
  • Figure 93: South Asia & Pacific Market Value (USD Million) by Country, 2025 to 2035
  • Figure 94: South Asia & Pacific Market Value (USD Million) Analysis by Country, 2020 to 2035
  • Figure 95: South Asia & Pacific Market Volume (Tons) Analysis by Country, 2020 to 2035
  • Figure 96: South Asia & Pacific Market Value Share (%) and BPS Analysis by Country, 2025 to 2035
  • Figure 97: South Asia & Pacific Market Y-o-Y Growth (%) Projections by Country, 2025 to 2035
  • Figure 98: South Asia & Pacific Market Value (USD Million) Analysis by Product Type, 2020 to 2035
  • Figure 99: South Asia & Pacific Market Volume (Tons) Analysis by Product Type, 2020 to 2035
  • Figure 100: South Asia & Pacific Market Value Share (%) and BPS Analysis by Product Type, 2025 to 2035
  • Figure 101: South Asia & Pacific Market Y-o-Y Growth (%) Projections by Product Type, 2025 to 2035
  • Figure 102: South Asia & Pacific Market Value (USD Million) Analysis by Application, 2020 to 2035
  • Figure 103: South Asia & Pacific Market Volume (Tons) Analysis by Application, 2020 to 2035
  • Figure 104: South Asia & Pacific Market Value Share (%) and BPS Analysis by Application, 2025 to 2035
  • Figure 105: South Asia & Pacific Market Y-o-Y Growth (%) Projections by Application, 2025 to 2035
  • Figure 106: South Asia & Pacific Market Attractiveness by Product Type, 2025 to 2035
  • Figure 107: South Asia & Pacific Market Attractiveness by Application, 2025 to 2035
  • Figure 108: South Asia & Pacific Market Attractiveness by Country, 2025 to 2035
  • Figure 109: MEA Market Value (USD Million) by Product Type, 2025 to 2035
  • Figure 110: MEA Market Value (USD Million) by Application, 2025 to 2035
  • Figure 111: MEA Market Value (USD Million) by Country, 2025 to 2035
  • Figure 112: MEA Market Value (USD Million) Analysis by Country, 2020 to 2035
  • Figure 113: MEA Market Volume (Tons) Analysis by Country, 2020 to 2035
  • Figure 114: MEA Market Value Share (%) and BPS Analysis by Country, 2025 to 2035
  • Figure 115: MEA Market Y-o-Y Growth (%) Projections by Country, 2025 to 2035
  • Figure 116: MEA Market Value (USD Million) Analysis by Product Type, 2020 to 2035
  • Figure 117: MEA Market Volume (Tons) Analysis by Product Type, 2020 to 2035
  • Figure 118: MEA Market Value Share (%) and BPS Analysis by Product Type, 2025 to 2035
  • Figure 119: MEA Market Y-o-Y Growth (%) Projections by Product Type, 2025 to 2035
  • Figure 120: MEA Market Value (USD Million) Analysis by Application, 2020 to 2035
  • Figure 121: MEA Market Volume (Tons) Analysis by Application, 2020 to 2035
  • Figure 122: MEA Market Value Share (%) and BPS Analysis by Application, 2025 to 2035
  • Figure 123: MEA Market Y-o-Y Growth (%) Projections by Application, 2025 to 2035
  • Figure 124: MEA Market Attractiveness by Product Type, 2025 to 2035
  • Figure 125: MEA Market Attractiveness by Application, 2025 to 2035
  • Figure 126: MEA Market Attractiveness by Country, 2025 to 2035

Frequently Asked Questions

What was the overall size of the flexographic ink market in 2025?

The flexographic ink market was valued at approximately USD 13,272 million in 2025.

How big is the flexographic ink market expected to be in 2035?

The market is projected to reach around USD 22,671 million by 2035.

What will drive the demand for the flexographic ink market during the forecast period?

The increasing demand for packaging materials across various industries is a significant driver.

List the top 5 countries contributing to the flexographic ink market.

The leading countries in the flexographic ink market include the United States, China, Germany, Japan, and India.

Which is the leading segment in the flexographic ink market?

The water-based inks segment is expected to grow in forecast period driven by their safety and environmental benefits.

Explore Similar Insights

Future Market Insights

Flexographic Ink Market