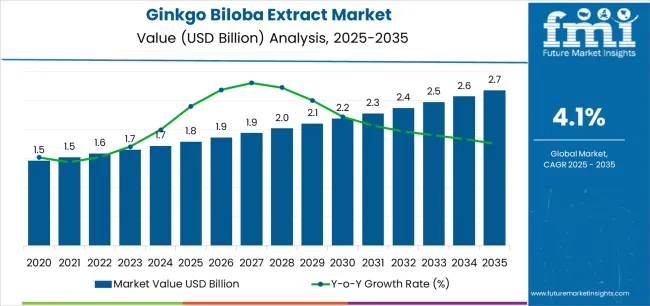
The ginkgo biloba extract market is projected to grow from USD 1.8 billion in 2025 to USD 2.7 billion by 2035, adding USD 0.9 billion in new value and advancing at a 4.1% CAGR amid rising global interest in cognitive wellness, natural nutraceuticals, and standardized botanical ingredients. Growth is anchored by powder-based extracts, which hold 38.6% share due to their stability, standardized flavonoid/terpenoid profiles, and versatility across supplements, beverages, and nutraceutical blends. Dietary supplements, expanding at 4.8% CAGR, remain the dominant application as capsules, tablets, and soft gels support memory enhancement, stress reduction, and circulatory health. Diversified use in cosmetics, functional beverages, and clinical formulations accelerates as manufacturers shift toward organic-certified, clean-label, and traceable extracts with validated bioactive content.
Regionally, India (8.3% CAGR) and Japan (6.9% CAGR) lead expansion through Ayurveda- and clinical-grade nutraceutical adoption, followed by China (6.2%), supported by strong TCM integration and e-commerce penetration. Mature markets including the United States (4.3%), the United Kingdom (4.1%), and Germany (4.0%) sustain steady premium demand through regulated supplement channels and growing nutricosmetic adoption.
Competitive advantage consolidates around extraction purity, standardized ginkgolide/bilobalide levels, organic certification, and global distribution capability, with leading companies such as Indena S.p.A., Hunan NutraMax, Bio-Botanica, Givaudan, Croda, Provital, SILAB, Lucas Meyer Cosmetics, and Rahn AG competing through clinical validation, traceability assurance, and multifunctional formulation support across supplements, functional foods, and beauty-from-within applications.
One of the primary drivers of market expansion is the rising demand for cognitive support supplements. Ginkgo biloba extract is frequently incorporated into formulations aimed at improving mental clarity, reducing age-related cognitive decline, and supporting overall brain function. With increasing awareness of brain health, rising stress levels, and an aging global population, nutraceutical brands are launching ginkgo-based capsules, tablets, soft gels, and liquid extracts targeted at seniors, working professionals, and students. The growing popularity of preventive health approaches further reinforces consumption of such botanical ingredients.
Supply chain developments and extraction technologies also shape market dynamics. Manufacturers are investing in improved extraction processes, including solvent extraction, water extraction, and advanced purification techniques, to produce high-potency, standardized extracts with consistent bioactive concentrations. These advancements support both regulatory compliance and product performance, helping brands differentiate themselves in competitive nutraceutical markets.
Regional growth patterns highlight strong demand across North America, Europe, and Asia-Pacific. Western markets exhibit high adoption of dietary supplements, while Asian markets benefit from established traditional herbal medicine systems. Increased consumer education, rising disposable incomes, and a shift toward natural wellness products continue to strengthen global demand for ginkgo biloba extract.
| Period | Primary Revenue Buckets | Share (%) | Notes |
|---|---|---|---|
| Today | Dietary supplements (capsules, tablets, soft gels) | 55% | Mass adoption for cognitive health, memory, circulatory benefits |
| Powdered extracts (bulk B2B, blends) | 25% | Functional versatility, shelf stability, bioavailability | |
| Traditional medicine channels (herbal shops, TCM, Ayurveda) | 10% | Cultural credibility; fragmented regulation | |
| Cosmetic/skincare actives | 5% | Early-stage use in anti-aging, hydration, dermal wellness | |
| Functional beverages | 5% | Infused teas, RTD shots, niche launches | |
| Future (3-5 yrs) | Dietary supplements (premiumized blends, organic) | 35-40% | Fortified capsules with adaptogens, vitamins, nootropics |
| Powder extracts & personalized mixes | 20-25% | DIY formulations, protein/nutrition blends | |
| Functional beverages & wellness shots | 10-15% | Cognitive energy drinks, stress-relief teas | |
| Cosmetics & nutricosmetics | 10-15% | Anti-aging serums, beauty-from-within capsules | |
| Pharmaceutical/nutraceutical-grade formulations | 10-12% | Clinical standardization, neuroprotective R&D | |
| Data & traceability services | 3-5% | Organic certification, clean-label transparency |
| Metric | Value |
|---|---|
| Market Value (2025) | USD 1.8 billion |
| Market Forecast (2035) | USD 2.7 billion |
| Growth Rate | 4.1% CAGR |
| Leading Delivery Form | Powder (38.6% share) |
| Primary Application | Dietary Supplements (CAGR 4.8%) |
The ginkgo biloba extract market exhibits steady fundamentals, with powdered formats capturing a dominant share due to their functional versatility, improved bioavailability, and enhanced shelf stability. Dietary supplements remain the primary demand driver, driven by aging demographics, increasing health consciousness, and growing awareness of cognitive health.
Growth momentum is strongest in South Asia & Pacific (India) and East Asia (China, Japan), where traditional herbal use aligns with modern nutraceutical adoption. Mature markets such as the United States and the United Kingdom provide steady demand through well-established supplement industries and premium organic positioning.
Primary Classification (By Delivery Form):
The market segments into Powder, Capsules/Tablets, Liquid Extracts, and Soft Gels, representing the progression from traditional herbal formats to standardized nutraceutical and functional applications. Powder formats dominate with 38.6% share, while capsules and liquids reflect growing consumer convenience needs and clinical-grade use.
Secondary Classification (By Application):
Applications divide into Dietary Supplements, Cosmetics/Personal Care, Functional Beverages, and Pharmaceuticals, reflecting distinct consumer pathways for cognitive support, preventive wellness, beauty-from-within, and clinical applications.
Tertiary Classification (By Distribution Channel):
Sales channels span Direct-to-Consumer (E-commerce), Pharmacies & Health Stores, B2B Nutraceutical Supply, and Food & Beverage Manufacturers, capturing a diverse ecosystem from wellness platforms to clinical distributors.
Regional Classification:
Geographic distribution covers North America, Latin America, Europe, East Asia, South Asia Pacific, and Middle East & Africa, with India (8.3% CAGR) and China (6.2% CAGR) driving rapid adoption, while mature markets such as the USA (4.3% CAGR) and UK (4.1% CAGR) provide stable growth anchored in regulatory-compliant supplement industries.
The segmentation structure highlights the transition from single-function herbal supplements to multifunctional wellness solutions integrated into cosmetics, beverages, and clinical nutrition, supported by rising demand for traceability, organic certification, and standardized bioactives.
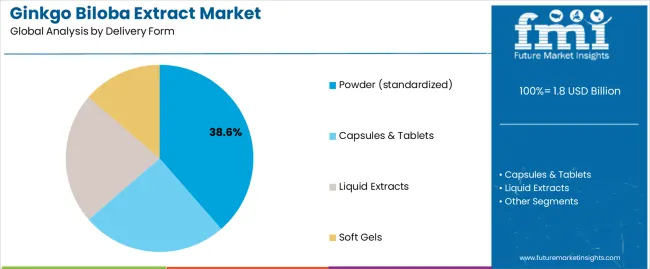
Market Position: Powder dominates with 38.6% share, driven by bioavailability, shelf stability, and formulation versatility that allows integration into capsules, sachets, teas, and fortified blends.
Value Drivers: Ease of blending, dosing precision, and suitability for international trade make powder the format of choice for both consumers and manufacturers.
Competitive Advantages: Powder extracts allow standardized flavonoid/terpenoid concentrations, customization in DIY mixes, and seamless incorporation into dietary supplement and functional food systems.
Key Characteristics:
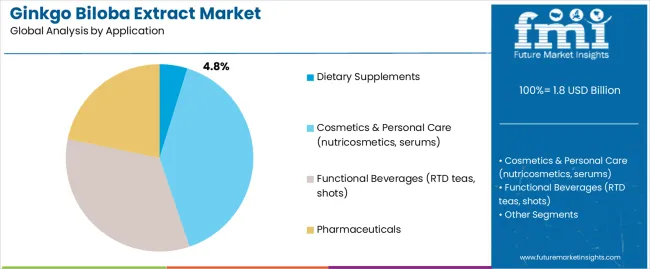
Market Position: Supplements remain the largest segment with a projected CAGR of 4.8%, driven by aging demographics and global wellness culture.
Value Drivers: Consumers associate Ginkgo with memory enhancement, cognitive support, and circulatory health, making supplements the default use-case across capsules, tablets, and soft gels.
Competitive Advantages: Scientific validation, routine consumption habits, and compatibility with other adaptogens and vitamins reinforce supplement leadership.
Application Dynamics:
Market Context: E-commerce platforms (Amazon, Tmall, health-focused portals) show fastest adoption, fueled by digital wellness trends and global reach.
Business Model Advantages: Direct-to-consumer models ensure traceability, subscription convenience, and global access.
Operational Benefits: Enables personalized product curation, bundled wellness kits, and cross-selling of supplements with skincare and functional beverage offerings.
| Category | Factor | Impact | Why It Matters |
|---|---|---|---|
| Driver | Rising demand for cognitive & mental wellness | ★★★★★ | Aging populations, stress, and brain health awareness push Ginkgo into mainstream supplements and functional foods. |
| Driver | Clean-label & natural ingredient preference | ★★★★★ | Consumers shift from synthetic nootropics to botanical-based, organic-certified products; creates premium pricing opportunities. |
| Driver | Expansion of herbal traditions in Asia (TCM & Ayurveda) | ★★★★☆ | Strong cultural acceptance in China & India accelerates adoption; aligns with nutraceutical modernization. |
| Restraint | Regulatory complexity & inconsistent dosage standards | ★★★★☆ | EFSA, FDA, and TCM standards vary, raising compliance costs and slowing global distribution. |
| Restraint | Adulteration & quality variability in extracts | ★★★☆☆ | Inconsistent ginkgolide/bilobalide levels undermine efficacy and consumer trust; pushes need for standardization. |
| Trend | Diversification into cosmetics & functional beverages | ★★★★★ | Ginkgo’s antioxidant & microcirculation benefits fuel growth in skincare, nutricosmetics, and fortified teas. |
| Trend | Sustainability & traceability in sourcing | ★★★★☆ | Organic, non-GMO, and blockchain-enabled supply chains become core differentiators in premium markets. |
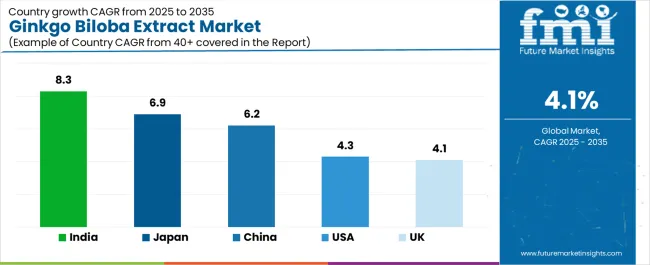
The sector demonstrates varied regional dynamics, with Growth Leaders including India (8.3% CAGR) and Japan (6.9% CAGR), fueled by strong nutraceutical adoption, herbal traditions, and preventive health awareness. Steady Performers include the United States (4.3% CAGR), United Kingdom (4.1% CAGR), and mature European markets, where supplements are established and premium organic positioning is expanding. Emerging Markets feature China (6.2% CAGR) and developing regions where cultural acceptance of herbal remedies and modernization of nutraceutical processing drive expansion.
Regional synthesis reveals Asia-Pacific markets leading adoption through Ayurveda and TCM integration, North America maintaining steady expansion supported by mature supplement industries and e-commerce penetration, and Europe showing moderate growth driven by clean-label preferences, organic certification, and functional beauty trends.
| Region / Country | 2025 to 2035 Growth | How to Win | What to Watch Out |
|---|---|---|---|
| India | 8.3% | Leverage Ayurveda + affordable blends | Quality control & standardization gaps |
| Japan | 6.9% | Premium clinical-grade nutraceuticals | High regulatory standards; aging demographics dependency |
| China | 6.2% | Combine TCM credibility + modern formats | Adulteration risks; import/export standards |
| United States | 4.3% | Organic + cognitive wellness bundles | Price wars; supplement saturation |
| United Kingdom | 4.1% | Clean-label + multifunctional blends | Brexit trade complexities; labeling compliance |
| Germany | 4.0% | Technical-grade formulations + pharma integration | Stringent EU compliance; slow approvals |
| Brazil | 4.5% | Cost-effective herbal supplements for middle class | Import dependency; logistics challenges |
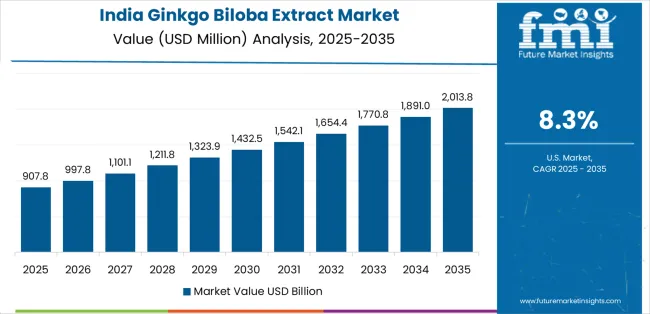
India leads the Ginkgo Biloba Extract Market with the fastest growth, expanding at 8.3% CAGR, fueled by Ayurveda heritage and rapid nutraceutical adoption. Ginkgo is increasingly formulated into capsules, powders, and herbal teas positioned for memory, stress relief, and circulatory health. Rising middle-class wellness spending and the growing reach of e-commerce platforms provide strong access to urban and semi-urban consumers. Domestic manufacturers leverage agricultural advantages and traditional medicine credibility to deliver cost-effective, standardized products for both local and export markets. Blends with native botanicals such as ashwagandha and bacopa enhance appeal, while government AYUSH initiatives provide credibility. Export growth targeting Southeast Asia and the Middle East positions India as a global hub for Ginkgo-based nutraceutical solutions.
Strategic Market Indicators:
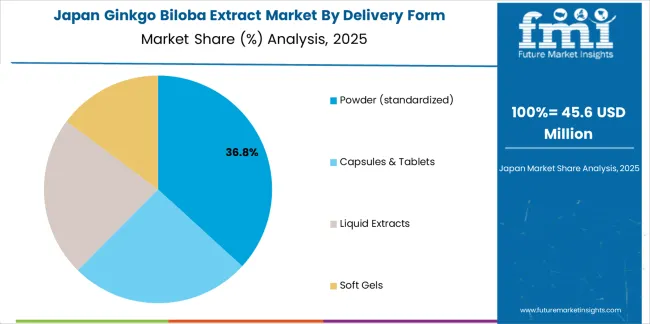
Japan demonstrates 6.9% CAGR, supported by its aging population and strong preference for clinical-grade nutraceuticals. Ginkgo enjoys broad usage in functional supplements, OTC brain health products, and fortified beverages marketed toward memory support and stress relief. Skincare adoption is growing, especially in anti-aging serums and nutricosmetics targeting consumers over 40. Japan’s advanced R&D ecosystem has enabled innovations such as nano-encapsulation and hydrogel delivery systems that enhance bioavailability and consumer convenience. Regulatory clarity ensures consumer trust, making Japan a leading market for pharmaceutical-grade extracts. Integration of Ginkgo with vitamins, adaptogens, and nootropics supports multifunctional health applications. Premiumization and scientific credibility remain the defining features, positioning Japan as a benchmark market for Ginkgo innovation worldwide.
Market Intelligence Brief:
China maintains a strong 6.2% CAGR, rooted in its Traditional Chinese Medicine (TCM) heritage and reinforced by modern nutraceutical adoption. Ginkgo is widely consumed in tablets, fortified herbal teas, and urban-focused nutraceutical blends. Increasing middle-class demand for preventive healthcare fuels demand, particularly in metropolitan hubs like Beijing, Shanghai, and Guangzhou. Government support for TCM and large-scale nutraceutical programs strengthens mainstream adoption. Domestic producers expand rapidly through technology transfer partnerships with international suppliers, improving standardization of ginkgolides and bilobalide. E-commerce platforms further accelerate accessibility across regions, creating large-scale consumer awareness. Challenges remain in quality control and inconsistent labeling, but growing emphasis on certification and traceability continues to push the market toward international credibility and competitive export positioning.
Market Intelligence Brief:
The United States records steady 4.3% CAGR, maintaining its position as a mature and globally significant Ginkgo Biloba Extract Market. Supplements dominate usage, particularly capsules, tablets, and soft gels consumed by seniors and professionals seeking cognitive enhancement, stress relief, and circulatory health benefits. Organic-certified extracts capture premium segments, accounting for nearly 25% of supplement share. Large supplement brands like Nature’s Bounty and GNC expand with blended formulations combining Ginkgo with omega-3s, B vitamins, and adaptogens. E-commerce and retail giants provide broad consumer access, though consolidation has increased margin pressure. The USA benefits from established regulatory clarity and consumer trust, with innovation extending into functional beverages and beauty-from-within categories. Its infrastructure ensures continued stable adoption and long-term relevance.
Market Intelligence Brief:
The United Kingdom grows at 4.1% CAGR, driven by consumer preference for clean-label and multifunctional herbal supplements. Ginkgo is widely adopted in capsules, fortified teas, and emerging cosmetic formulations such as anti-aging serums and scalp-care products. UK consumers increasingly value botanical blends that combine Ginkgo with magnesium, B vitamins, or omega-3s, creating targeted solutions for stress relief and memory support. E-commerce penetration supports widespread distribution, while premiumization trends attract younger, health-conscious demographics. Regulatory requirements under EFSA frameworks ensure credibility but increase compliance costs for suppliers. Brexit has complicated labeling and supply chain processes, creating cost challenges for import-dependent firms. Nevertheless, the UK’s positioning as a wellness-driven and sustainability-focused market underpins long-term adoption across supplements and cosmetics.
Market Intelligence Brief:
Germany demonstrates a strong position in the Ginkgo Biloba Extract Market, supported by advanced nutraceutical infrastructure and pharma-grade integration. While CAGR data was not provided, the market is estimated at around 4.0%, reflecting demand for highly standardized extracts in both supplements and pharmaceuticals. German consumers prioritize efficacy, safety, and EU-compliant products, pushing manufacturers to maintain rigorous certification standards. Partnerships between nutraceutical firms and pharmaceutical companies shorten R&D cycles, enabling faster development of clinically validated formulations. Premium product positioning supports sustained demand, particularly in brain health and circulatory care applications. Innovation collaborations with international suppliers further boost credibility. Despite stringent regulations that slow product rollouts, Germany remains Europe’s benchmark for high-quality, certified nutraceuticals.
Market Intelligence Brief:
Brazil is an emerging herbal supplements hub, showing consistent growth estimated at 4.5% CAGR, supported by rising wellness awareness and expanding urban middle-class demand. Ginkgo is increasingly incorporated into capsules, herbal blends, and functional beverages targeting stress management and cognitive health. Major cities such as São Paulo and Rio de Janeiro serve as growth centers for nutraceutical adoption. Imports dominate supply, creating volatility due to currency fluctuations and logistics costs, but local partnerships with international firms are emerging to stabilize production. Blends with native botanicals such as guaraná and acerola resonate with local consumers, enhancing differentiation. The cosmetics sector is also incorporating Ginkgo into anti-aging and skin-brightening formulations. Brazil’s long-term growth reflects increasing herbal credibility.
Strategic Market Considerations:
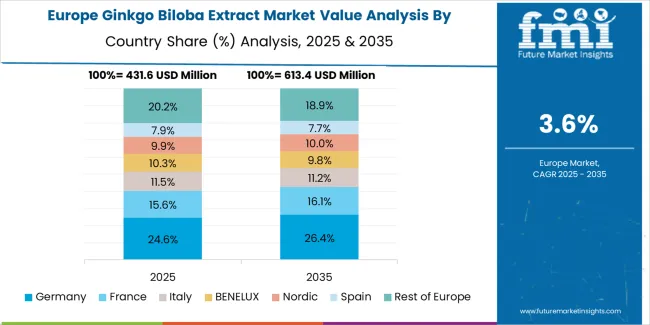
The market is projected to grow from USD 700 million in 2025 to USD 1.20 billion by 2035, registering a 5.5% CAGR over the forecast period. Germany is expected to maintain leadership with a 28.5% market share in 2025, supported by its advanced nutraceutical and pharmaceutical infrastructure and stringent EU compliance.
The United Kingdom follows with a 25.8% share in 2025, driven by strong supplement adoption and clean-label consumer trends. France holds 22.3% share, supported by specialized herbal medicine adoption and regulatory-certified applications. Italy commands 15.2% share, while Spain accounts for 8.2% in 2025. The Rest of Europe is projected to increase its collective share from 6.5% in 2025 to 7.1% in 2035, supported by rising demand in Nordic countries and growing adoption of organic nutraceuticals across smaller European markets.
In Germany, the Ginkgo Biloba Extract Market prioritizes powder formulations, which capture the dominant share across supplements and pharma applications due to their bioavailability, stability, and compatibility with pharmaceutical-grade processing systems. German manufacturers emphasize efficacy, EU compliance, and traceability, creating strong demand for standardized extracts with consistent ginkgolide and bilobalide content. Local producers integrate with pharmaceutical systems, ensuring reliability for both preventive health and clinical-grade products. Capsule and liquid forms maintain secondary roles in niche personal care or functional beverage segments, but powders remain the primary driver of Germany’s leadership position.
Market Characteristics:
In the United Kingdom, the market is shaped by strong international nutraceutical brands such as Indena, Croda, and Bio-Botanica, alongside regional supplement providers leveraging e-commerce and wellness channels. Clean-label preferences dominate, with multifunctional Ginkgo blends (combined with B vitamins, omega-3, or adaptogens) gaining traction among students, professionals, and aging populations. UK distributors emphasize subscription services and direct-to-consumer e-commerce strategies that appeal to wellness-driven consumers. Domestic herbal brands provide competitive offerings with strong consumer trust, while international brands maintain premium positioning through certified quality and clinical validation.
Channel Insights:
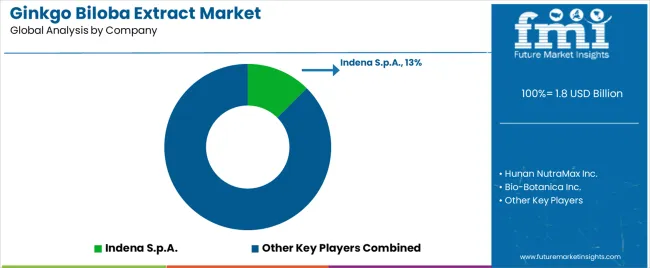
Structure: 25–30 credible players; top 5 firms hold ~50–55% of revenue, reflecting a moderately fragmented yet consolidated premium tier.
| Stakeholder | What they actually control | Typical strengths | Typical blind spots |
|---|---|---|---|
| Global nutraceutical leaders | Standardized extraction, global distribution, clinical trial validation | Proven efficacy, brand credibility, pharma compliance | High cost base; exposed to regulatory hurdles and pricing pressure |
| Fast innovators | Functional blends, novel delivery (nano-encapsulation, gummies, RTD) | First-to-market with formats; strong appeal to younger consumers | Quality consistency risk; scalability outside core markets |
| Regional processors | Local cultivation, traditional herbal credibility, proximity supply chains | Cost efficiency, cultural trust, tailored regional blends | Export barriers; weaker global certifications and brand power |
| E-commerce-first brands | Direct-to-consumer sales, subscription kits, wellness bundles | Rapid scaling, consumer engagement, personalized packs | Low differentiation risk; dependent on marketing spend and platform rules |
| Cosmetic & beauty integrators | Ginkgo actives in serums, nutricosmetics, beauty-from-within capsules | Strong ESG fit, premium anti-aging positioning | Limited scientific validation compared to pharma-grade extracts |
| Item | Value |
|---|---|
| Quantitative Units | USD 1.8 billion (2025 base) |
| Delivery Form | Powder (standardized), Capsules/Tablets, Liquid Extracts, Soft Gels |
| Application | Dietary Supplements, Cosmetics/Personal Care, Functional Beverages, Pharmaceuticals |
| Distribution Channel | Direct-to-Consumer (E-commerce), Pharmacies & Health Stores, B2B Nutraceutical Supply, Food & Beverage Manufacturers |
| Regions Covered | North America, Latin America, Europe, East Asia, South Asia & Pacific, Middle East & Africa |
| Countries Covered | United States, United Kingdom, Germany, France, Italy, Spain, Netherlands, China, Japan, South Korea, India, Brazil, Canada, Australia, and 25+ additional countries |
| Key Companies Profiled | Indena S.p.A., Hunan NutraMax Inc., Bio-Botanica Inc., Givaudan, Croda International Plc, Provital Group, SILAB, Lucas Meyer Cosmetics, Rahn AG, BIOLANDES Group |
| Additional Attributes | Dollar sales by delivery form & application; regional adoption trends across North America, East Asia, and Europe; competitive landscape with nutraceutical & cosmetic actives suppliers; buyer preferences for clean-label, organic, and standardized potency; integration with supplement, beverage, and skincare systems; innovations in extraction/standardization, micro-/nano-encapsulation, and synergistic blends; sustainability & traceability (organic, non-GMO, QR/Blockchain). |
The global ginkgo biloba extract market is estimated to be valued at USD 1.8 billion in 2025.
The market size for the ginkgo biloba extract market is projected to reach USD 2.7 billion by 2035.
The ginkgo biloba extract market is expected to grow at a 4.1% CAGR between 2025 and 2035.
The key product types in ginkgo biloba extract market are powder (standardized), capsules & tablets, liquid extracts and soft gels.
In terms of application, dietary supplements segment to command 4.8% share in the ginkgo biloba extract market in 2025.


Our Research Products

The "Full Research Suite" delivers actionable market intel, deep dives on markets or technologies, so clients act faster, cut risk, and unlock growth.

The Leaderboard benchmarks and ranks top vendors, classifying them as Established Leaders, Leading Challengers, or Disruptors & Challengers.

Locates where complements amplify value and substitutes erode it, forecasting net impact by horizon

We deliver granular, decision-grade intel: market sizing, 5-year forecasts, pricing, adoption, usage, revenue, and operational KPIs—plus competitor tracking, regulation, and value chains—across 60 countries broadly.

Spot the shifts before they hit your P&L. We track inflection points, adoption curves, pricing moves, and ecosystem plays to show where demand is heading, why it is changing, and what to do next across high-growth markets and disruptive tech

Real-time reads of user behavior. We track shifting priorities, perceptions of today’s and next-gen services, and provider experience, then pace how fast tech moves from trial to adoption, blending buyer, consumer, and channel inputs with social signals (#WhySwitch, #UX).

Partner with our analyst team to build a custom report designed around your business priorities. From analysing market trends to assessing competitors or crafting bespoke datasets, we tailor insights to your needs.
Supplier Intelligence
Discovery & Profiling
Capacity & Footprint
Performance & Risk
Compliance & Governance
Commercial Readiness
Who Supplies Whom
Scorecards & Shortlists
Playbooks & Docs
Category Intelligence
Definition & Scope
Demand & Use Cases
Cost Drivers
Market Structure
Supply Chain Map
Trade & Policy
Operating Norms
Deliverables
Buyer Intelligence
Account Basics
Spend & Scope
Procurement Model
Vendor Requirements
Terms & Policies
Entry Strategy
Pain Points & Triggers
Outputs
Pricing Analysis
Benchmarks
Trends
Should-Cost
Indexation
Landed Cost
Commercial Terms
Deliverables
Brand Analysis
Positioning & Value Prop
Share & Presence
Customer Evidence
Go-to-Market
Digital & Reputation
Compliance & Trust
KPIs & Gaps
Outputs
Full Research Suite comprises of:
Market outlook & trends analysis
Interviews & case studies
Strategic recommendations
Vendor profiles & capabilities analysis
5-year forecasts
8 regions and 60+ country-level data splits
Market segment data splits
12 months of continuous data updates
DELIVERED AS:
PDF EXCEL ONLINE
Extraction Kits Market Analysis - Size, Share, and Forecast Outlook 2025 to 2035
Extracts and Distillates Market
Sage Extract Market Size and Share Forecast Outlook 2025 to 2035
Fume Extractor Market Size and Share Forecast Outlook 2025 to 2035
Meat Extracts Market Size and Share Forecast Outlook 2025 to 2035
Kale Extract Skincare Market Size and Share Forecast Outlook 2025 to 2035
Wine Extract Market Size and Share Forecast Outlook 2025 to 2035
Amla Extract Market Analysis - Size, Share, and Forecast Outlook 2025 to 2035
Dust Extractor Market Growth – Trends & Forecast 2025 to 2035
Data Extraction Software Market
Lipid Extraction Kit Market Size and Share Forecast Outlook 2025 to 2035
Peony Extract Brightening Creams Market Analysis - Size, Share, and Forecast Outlook 2025 to 2035
Peony Extracts for Brightening Market Size and Share Forecast Outlook 2025 to 2035
Algae Extracts Market Size and Share Forecast Outlook 2025 to 2035
Juice Extraction Equipment Market Size and Share Forecast Outlook 2025 to 2035
Yucca Extract Market Size and Share Forecast Outlook 2025 to 2035
Maple Extracts Market Size and Share Forecast Outlook 2025 to 2035
Yeast Extract Market Analysis - Size, Share, and Forecast Outlook 2025 to 2035
Yeast Extract Industry Analysis in USA Size, Growth, and Forecast for 2025 to 2035
Basil Extract Market Size, Growth, and Forecast for 2025 to 2035

Thank you!
You will receive an email from our Business Development Manager. Please be sure to check your SPAM/JUNK folder too.
Chat With
MaRIA