FTIR Gas Analyser Market Size and Share Forecast Outlook 2025 to 2035

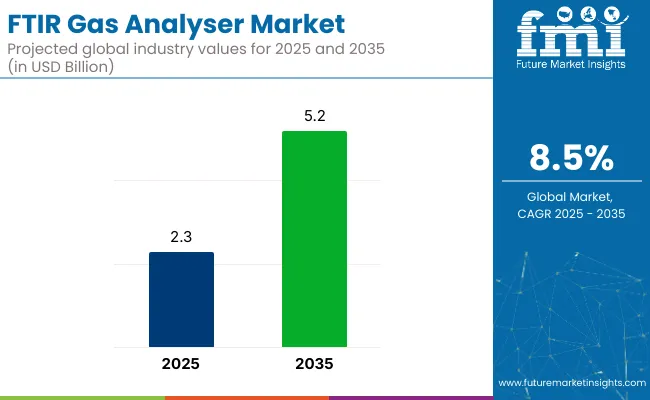
The global Fourier Transform Infrared (FTIR) gas analyser market is valued at USD 2.3 billion in 2025 and is projected to reach USD 5.2 billion by 2035, reflecting a compound annual growth rate (CAGR) of 8.5% during the forecast period. The adoption of FTIR gas analysers has been expanding steadily, supported by increasing requirements for multi-gas monitoring across environmental, industrial, and safety applications.

In 2024, Edinburgh Instruments introduced the IR5 FTIR spectrometer, marking its entry into the segment. This analyser supports configurations with dual detectors and photoluminescence modules, designed for high-resolution gas and molecular analysis. The product has been positioned to meet both academic and industrial research needs, offering temperature-controlled sampling options and multiple spectral range detectors.

Further developments have been seen in the portable analyser category. Gasmet launched the GT5000 Terra in 2025, engineered for field use under rugged conditions. The analyser supports up to 50 gases simultaneously, with measurements delivered within five seconds.

Gasmet’s official product release highlighted the system’s suitability for industrial hygiene inspections, greenhouse-gas assessments, and confined-space monitoring. The GT5000 Terra was noted for its low weight, integrated battery operation, and wireless data transmission, making it ideal for remote deployment scenarios.

ABB continues to enhance its FTIR portfolio with the MBGAS-3000 series. According to the company’s official specifications, the unit has been updated for better thermal and mechanical stability, and is tailored for original equipment manufacturer (OEM) applications in emissions monitoring. These systems are being utilized in stationary source compliance testing, continuous emissions monitoring, and industrial process control environments.
Ftir Gas Analysers Market

Market Metrics

Metric Value
Market Size (2025E) USD 2.3 Billion
Market Value (2035F) USD 5.2 Billion
CAGR (2025 to 2035) 8.5%

Growth in the FTIR gas analyser market is being driven by increased regulatory scrutiny across Europe and North America, where real-time monitoring of volatile organic compounds (VOCs), carbon monoxide (CO), and nitrogen oxides (NOx) is mandated. FTIR systems are valued for their ability to detect multiple gases simultaneously with high specificity, supporting compliance in sectors such as power generation, cement production, waste incineration, and chemical manufacturing.

Advancements in modularity and cloud connectivity are expected to continue reshaping user interfaces and data analytics. Industry participants are also offering service-linked product bundles, including rental, calibration, and on-site installation programs to support faster deployment.

Analyzing FTIR Gas Analyser Market by Top Investment Segments

Low concentration range analyzers are projected to lead product demand with expanding use in trace gas monitoring and environmental compliance

Low concentration level FTIR gas analyzers (capable of ppb and ppm detection) are estimated to account for approximately 61% of the global market share in 2025 and are projected to grow at a CAGR of 8.7% through 2035. These systems are preferred for their ability to detect and quantify trace-level pollutants and volatile organic compounds (VOCs), which are critical for compliance in cleanroom environments, ambient air monitoring, and emission control.

Industries such as chemical processing, automotive emissions testing, and environmental research rely on low-level FTIR analyzers for their high spectral resolution and multi-gas analysis capability. Manufacturers continue to enhance sensitivity, data acquisition speed, and interference correction to meet global regulatory standards including EPA, EN, and ISO frameworks.

Chemical industry is expected to dominate end-use adoption with growing demand for real-time process gas analysis and hazardous emissions control

The chemical industry is projected to hold approximately 33% of the global FTIR gas analyzer market share in 2025 and is expected to grow at a CAGR of 8.6% through 2035. FTIR analyzers are widely deployed in chemical plants for continuous monitoring of stack gases, leak detection, and VOC quantification.

These systems provide simultaneous multi-component analysis, enabling better process control, environmental safety, and regulatory reporting. In 2025, operators in petrochemical, specialty chemicals, and polymer manufacturing are increasingly adopting FTIR-based solutions to meet stricter emission norms and maintain air quality within permissible limits.

The demand is particularly strong across Europe, North America, and parts of East Asia, where chemical clusters are expanding and environmental enforcement is intensifying. As facilities seek cost-effective, maintenance-friendly, and precise gas analysis tools, the chemical sector remains a primary growth driver for FTIR gas analyzer manufacturers.
Country-wise Analysis

Ftir Gas Analysers Market Country Wise Analysis

United States

United States FTIR Gas Analyser industryis continuously growing due to high demand for precise gas measurements in different sectors and growing emphasis on environmental regulations. Industries are required to install high-end gas analyser equipment for compliance and monitoring due to stringent air quality standards. Furthermore, growing concerns over climate change and carbon footprint reduction has led business to adopt cleaner technologies, hence driving market growth.

FTIR gas analysers for concurrent detection and quantification of multiple gases are widely used in petrochemicals, power generation, pharmaceuticals etc. The need for optimizing processes and the need to maintain workplace safety will drive market adoption.

Companies are also looking to innovate what they are offering, investing in detection capabilities for multi-gas and improved data analytics to drive efficiency and improve compliance with regulations, she said. Additionally, recent developments in portable and AI-enabled FTIR analysers for field emissions analysis in real-time can help improve operational efficiencies across a range of industries. The increasing adoption of Industry 4.0 and smart factory initiatives is driving the deployment of IOT-enabled FTIR gas analysers.

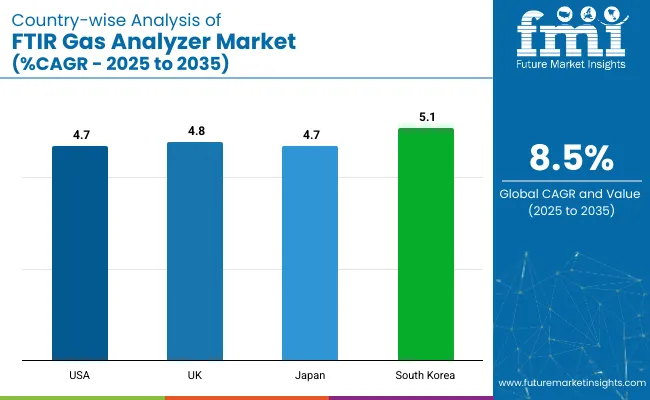
Country CAGR (2025 to 2035)
USA 4.7%

United Kingdom

The United Kingdom’s FTIR Gas Analyser market is experiencing steady growth, fueled by intensifying regulatory scrutiny on emissions and an accelerated national commitment to net-zero targets. In a landscape shaped by the UK’s Clean Air Strategy and carbon neutrality goals for 2050, industries are compelled to integrate advanced gas monitoring solutions for both compliance and operational transparency.

FTIR gas analysers, with their ability to perform simultaneous multi-gas detection with high precision, are gaining traction across key sectors such as chemical manufacturing, utilities, waste management, and pharmaceuticals. The UK’s large base of legacy industrial infrastructure also creates demand for retrofitting with smarter, low-maintenance, and highly accurate gas monitoring systems.

The shift towards decarbonization and circular economy models has driven companies to adopt FTIR analysers not just for regulatory compliance but also to achieve internal ESG (Environmental, Social, and Governance) performance benchmarks. Leading companies are investing in miniaturized, AI-augmented FTIR devices capable of providing real-time analytics, predictive maintenance insights, and remote monitoring, aligning with broader Industry 4.0 adoption across British manufacturing ecosystems.

Moreover, government-backed programs encouraging innovation in clean technologies and grants for industrial decarbonization are accelerating R&D in portable, IoT-integrated FTIR analysers. The growing need for flexible, in-field emissions testing - especially in waste-to-energy plants, offshore installations, and environmental research labs - is expected to drive further market expansion in the coming years.

Country CAGR (2025 to 2035)
UK 4.8%

Japan

Japan’s FTIR Gas Analyser market is advancing rapidly, driven by the country’s twin imperatives of stringent environmental control and relentless technological innovation. The Ministry of the Environment’s tightening emission standards, especially for volatile organic compounds (VOCs) and hazardous air pollutants, has pushed industries to adopt high-precision FTIR-based gas analysis systems for real-time monitoring and compliance assurance.

FTIR gas analysers are witnessing heightened deployment across automotive, chemical, and semiconductor sectors. Automotive manufacturers leverage them extensively for exhaust gas analysis and R&D into next-generation, low-emission vehicles, while semiconductor fabrication plants require ultra-sensitive gas monitoring to ensure product quality and environmental safety. The Japanese government’s funding incentives for advanced sensing technologies are further catalyzing domestic R&D in miniaturized, AI-powered FTIR platforms.

The country’s national push towards Smart Cities, factory automation, and carbon neutrality by 2050 is fostering the adoption of IoT-enabled FTIR analysers. Companies such as Horiba, Shimadzu, and Hitachi High-Tech are at the forefront, embedding AI-driven analytics for predictive maintenance, multi-gas pattern recognition, and real-time process optimization, expanding FTIR applications beyond traditional compliance monitoring into proactive industrial efficiency gains.

With Japan’s industrial sector under pressure to achieve both economic and environmental optimization, FTIR technology is evolving from a regulatory necessity to a strategic tool for competitive advantage.

Country CAGR (2025 to 2035)
Japan 4.7%

South Korea

South Korea’s FTIR Gas Analyser market is expanding swiftly, underpinned by aggressive industrialization, strengthened environmental regulations, and a national pivot toward smart, digitally connected industries. Regulatory pressure from the Ministry of Environment to curb industrial emissions - in alignment with global climate commitments - is compelling manufacturing hubs to upgrade to high-precision FTIR-based gas monitoring solutions.

The semiconductor and petrochemical sectors, cornerstones of South Korea’s economy, are among the largest adopters of FTIR technology. Here, analysers are not only used for emissions control but increasingly for process optimization, defect reduction, and safety assurance. Government-driven initiatives around smart healthcare infrastructure and enhanced indoor air quality standards are opening new growth avenues for FTIR deployments beyond traditional heavy industry.

Emerging technologies integrating FTIR systems with 5G connectivity, real-time AI analytics, and IoT platforms are reshaping South Korea’s gas monitoring landscape. Companies like LG Electronics, SKC, and Gasmet are investing heavily in portable, AI-augmented FTIR devices aimed at making gas analysis faster, smarter, and more scalable across industries.

These firms are also experimenting with machine learning-based spectral analysis to enhance detection sensitivity, efficiency, and predictive capabilities - essential features in South Korea’s vision for a fully integrated smart industrial economy.

Country CAGR (2025 to 2035)
South Korea 5.1%

Other Key Players

  • Emerson Electric Co.
  • PerkinElmer, Inc.
  • Bruker Corporation
  • MKS Instruments, Inc.
  • Yokogawa Electric Corporation

FTIR Gas Analyser Market Segmentation

By Portability Type:

  • Rack Mount
  • Portable

By End-Use:

  • Automotive
  • Chemical
  • Agriculture
  • Oil & Gas
  • Research & Development
  • Others

By Equipment Type:

  • High Concentration Range (up to ppm level)
  • Low Concentration Level (ppb and ppm level)

By Region:

  • North America
  • Latin America
  • Western Europe
  • Eastern Europe
  • South Asia and Pacific
  • East Asia
  • Middle East and Africa

Table of Content

  1. Executive Summary
  2. Market Overview
  3. Market Background
  4. Global Market Analysis 2020 to 2024 and Forecast 2025 to 2035
  5. Global Market Analysis 2020 to 2024 and Forecast 2025 to 2035, By Portability Type
    • Rack Mount
    • Portable
  6. Global Market Analysis 2020 to 2024 and Forecast 2025 to 2035, By End-Use
    • Automotive
    • Chemical
    • Agriculture
    • Oil & Gas
    • Research & Development
    • Others
  7. Global Market Analysis 2020 to 2024 and Forecast 2025 to 2035, By Equipment Type
    • High Concentration Range (up to ppm level)
    • Low Concentration Level (ppb and ppm level)
  8. Global Market Analysis 2020 to 2024 and Forecast 2025 to 2035, By Region
    • North America
    • Latin America
    • Western Europe
    • Eastern Europe
    • South Asia and Pacific
    • East Asia
    • Middle East and Africa
  9. North America Market Analysis 2020 to 2024 and Forecast 2025 to 2035, By Country
  10. Latin America Market Analysis 2020 to 2024 and Forecast 2025 to 2035, By Country
  11. Western Europe Market Analysis 2020 to 2024 and Forecast 2025 to 2035, By Country
  12. Eastern Europe Market Analysis 2020 to 2024 and Forecast 2025 to 2035, By Country
  13. South Asia and Pacific Market Analysis 2020 to 2024 and Forecast 2025 to 2035, By Country
  14. East Asia Market Analysis 2020 to 2024 and Forecast 2025 to 2035, By Country
  15. Middle East and Africa Market Analysis 2020 to 2024 and Forecast 2025 to 2035, By Country
  16. Key Countries Market Analysis
  17. Market Structure Analysis
  18. Competition Analysis
    • BREMBO S.p.A.
    • Surface Transforms PLC
    • MAT Foundry Group Ltd.
    • TVR Automotive Limited
    • Alfa Romeo Automobiles S.p.A.
    • Audi AG
    • Volkswagen of America, Inc.
    • Carroll Shelby International, Inc.
    • ALPINA Burkard Bovensiepen GmbH + Co. KG
    • BRABUS GmbH
    • ABT Sportsline GmbH
    • DeLorean Motor Company
  19. Assumptions & Acronyms Used
  20. Research Methodology

List of Tables

  • Table 1: Global Market Value (USD Million) Forecast by Region, 2020 to 2035
  • Table 2: Global Market Volume (Units) Forecast by Region, 2020 to 2035
  • Table 3: Global Market Value (USD Million) Forecast by Portability Type, 2020 to 2035
  • Table 4: Global Market Volume (Units) Forecast by Portability Type, 2020 to 2035
  • Table 5: Global Market Value (USD Million) Forecast by End-Use, 2020 to 2035
  • Table 6: Global Market Volume (Units) Forecast by End-Use, 2020 to 2035
  • Table 7: Global Market Value (USD Million) Forecast by Equipment Type, 2020 to 2035
  • Table 8: Global Market Volume (Units) Forecast by Equipment Type, 2020 to 2035
  • Table 9: North America Market Value (USD Million) Forecast by Country, 2020 to 2035
  • Table 10: North America Market Volume (Units) Forecast by Country, 2020 to 2035
  • Table 11: North America Market Value (USD Million) Forecast by Portability Type, 2020 to 2035
  • Table 12: North America Market Volume (Units) Forecast by Portability Type, 2020 to 2035
  • Table 13: North America Market Value (USD Million) Forecast by End-Use, 2020 to 2035
  • Table 14: North America Market Volume (Units) Forecast by End-Use, 2020 to 2035
  • Table 15: North America Market Value (USD Million) Forecast by Equipment Type, 2020 to 2035
  • Table 16: North America Market Volume (Units) Forecast by Equipment Type, 2020 to 2035
  • Table 17: Latin America Market Value (USD Million) Forecast by Country, 2020 to 2035
  • Table 18: Latin America Market Volume (Units) Forecast by Country, 2020 to 2035
  • Table 19: Latin America Market Value (USD Million) Forecast by Portability Type, 2020 to 2035
  • Table 20: Latin America Market Volume (Units) Forecast by Portability Type, 2020 to 2035
  • Table 21: Latin America Market Value (USD Million) Forecast by End-Use, 2020 to 2035
  • Table 22: Latin America Market Volume (Units) Forecast by End-Use, 2020 to 2035
  • Table 23: Latin America Market Value (USD Million) Forecast by Equipment Type, 2020 to 2035
  • Table 24: Latin America Market Volume (Units) Forecast by Equipment Type, 2020 to 2035
  • Table 25: Western Europe Market Value (USD Million) Forecast by Country, 2020 to 2035
  • Table 26: Western Europe Market Volume (Units) Forecast by Country, 2020 to 2035
  • Table 27: Western Europe Market Value (USD Million) Forecast by Portability Type, 2020 to 2035
  • Table 28: Western Europe Market Volume (Units) Forecast by Portability Type, 2020 to 2035
  • Table 29: Western Europe Market Value (USD Million) Forecast by End-Use, 2020 to 2035
  • Table 30: Western Europe Market Volume (Units) Forecast by End-Use, 2020 to 2035
  • Table 31: Western Europe Market Value (USD Million) Forecast by Equipment Type, 2020 to 2035
  • Table 32: Western Europe Market Volume (Units) Forecast by Equipment Type, 2020 to 2035
  • Table 33: Eastern Europe Market Value (USD Million) Forecast by Country, 2020 to 2035
  • Table 34: Eastern Europe Market Volume (Units) Forecast by Country, 2020 to 2035
  • Table 35: Eastern Europe Market Value (USD Million) Forecast by Portability Type, 2020 to 2035
  • Table 36: Eastern Europe Market Volume (Units) Forecast by Portability Type, 2020 to 2035
  • Table 37: Eastern Europe Market Value (USD Million) Forecast by End-Use, 2020 to 2035
  • Table 38: Eastern Europe Market Volume (Units) Forecast by End-Use, 2020 to 2035
  • Table 39: Eastern Europe Market Value (USD Million) Forecast by Equipment Type, 2020 to 2035
  • Table 40: Eastern Europe Market Volume (Units) Forecast by Equipment Type, 2020 to 2035
  • Table 41: South Asia and Pacific Market Value (USD Million) Forecast by Country, 2020 to 2035
  • Table 42: South Asia and Pacific Market Volume (Units) Forecast by Country, 2020 to 2035
  • Table 43: South Asia and Pacific Market Value (USD Million) Forecast by Portability Type, 2020 to 2035
  • Table 44: South Asia and Pacific Market Volume (Units) Forecast by Portability Type, 2020 to 2035
  • Table 45: South Asia and Pacific Market Value (USD Million) Forecast by End-Use, 2020 to 2035
  • Table 46: South Asia and Pacific Market Volume (Units) Forecast by End-Use, 2020 to 2035
  • Table 47: South Asia and Pacific Market Value (USD Million) Forecast by Equipment Type, 2020 to 2035
  • Table 48: South Asia and Pacific Market Volume (Units) Forecast by Equipment Type, 2020 to 2035
  • Table 49: East Asia Market Value (USD Million) Forecast by Country, 2020 to 2035
  • Table 50: East Asia Market Volume (Units) Forecast by Country, 2020 to 2035
  • Table 51: East Asia Market Value (USD Million) Forecast by Portability Type, 2020 to 2035
  • Table 52: East Asia Market Volume (Units) Forecast by Portability Type, 2020 to 2035
  • Table 53: East Asia Market Value (USD Million) Forecast by End-Use, 2020 to 2035
  • Table 54: East Asia Market Volume (Units) Forecast by End-Use, 2020 to 2035
  • Table 55: East Asia Market Value (USD Million) Forecast by Equipment Type, 2020 to 2035
  • Table 56: East Asia Market Volume (Units) Forecast by Equipment Type, 2020 to 2035
  • Table 57: Middle East and Africa Market Value (USD Million) Forecast by Country, 2020 to 2035
  • Table 58: Middle East and Africa Market Volume (Units) Forecast by Country, 2020 to 2035
  • Table 59: Middle East and Africa Market Value (USD Million) Forecast by Portability Type, 2020 to 2035
  • Table 60: Middle East and Africa Market Volume (Units) Forecast by Portability Type, 2020 to 2035
  • Table 61: Middle East and Africa Market Value (USD Million) Forecast by End-Use, 2020 to 2035
  • Table 62: Middle East and Africa Market Volume (Units) Forecast by End-Use, 2020 to 2035
  • Table 63: Middle East and Africa Market Value (USD Million) Forecast by Equipment Type, 2020 to 2035
  • Table 64: Middle East and Africa Market Volume (Units) Forecast by Equipment Type, 2020 to 2035

List of Figures

  • Figure 1: Global Market Value (USD Million) by Portability Type, 2025 to 2035
  • Figure 2: Global Market Value (USD Million) by End-Use, 2025 to 2035
  • Figure 3: Global Market Value (USD Million) by Equipment Type, 2025 to 2035
  • Figure 4: Global Market Value (USD Million) by Region, 2025 to 2035
  • Figure 5: Global Market Value (USD Million) Analysis by Region, 2020 to 2035
  • Figure 6: Global Market Volume (Units) Analysis by Region, 2020 to 2035
  • Figure 7: Global Market Value Share (%) and BPS Analysis by Region, 2025 to 2035
  • Figure 8: Global Market Y-o-Y Growth (%) Projections by Region, 2025 to 2035
  • Figure 9: Global Market Value (USD Million) Analysis by Portability Type, 2020 to 2035
  • Figure 10: Global Market Volume (Units) Analysis by Portability Type, 2020 to 2035
  • Figure 11: Global Market Value Share (%) and BPS Analysis by Portability Type, 2025 to 2035
  • Figure 12: Global Market Y-o-Y Growth (%) Projections by Portability Type, 2025 to 2035
  • Figure 13: Global Market Value (USD Million) Analysis by End-Use, 2020 to 2035
  • Figure 14: Global Market Volume (Units) Analysis by End-Use, 2020 to 2035
  • Figure 15: Global Market Value Share (%) and BPS Analysis by End-Use, 2025 to 2035
  • Figure 16: Global Market Y-o-Y Growth (%) Projections by End-Use, 2025 to 2035
  • Figure 17: Global Market Value (USD Million) Analysis by Equipment Type, 2020 to 2035
  • Figure 18: Global Market Volume (Units) Analysis by Equipment Type, 2020 to 2035
  • Figure 19: Global Market Value Share (%) and BPS Analysis by Equipment Type, 2025 to 2035
  • Figure 20: Global Market Y-o-Y Growth (%) Projections by Equipment Type, 2025 to 2035
  • Figure 21: Global Market Attractiveness by Portability Type, 2025 to 2035
  • Figure 22: Global Market Attractiveness by End-Use, 2025 to 2035
  • Figure 23: Global Market Attractiveness by Equipment Type, 2025 to 2035
  • Figure 24: Global Market Attractiveness by Region, 2025 to 2035
  • Figure 25: North America Market Value (USD Million) by Portability Type, 2025 to 2035
  • Figure 26: North America Market Value (USD Million) by End-Use, 2025 to 2035
  • Figure 27: North America Market Value (USD Million) by Equipment Type, 2025 to 2035
  • Figure 28: North America Market Value (USD Million) by Country, 2025 to 2035
  • Figure 29: North America Market Value (USD Million) Analysis by Country, 2020 to 2035
  • Figure 30: North America Market Volume (Units) Analysis by Country, 2020 to 2035
  • Figure 31: North America Market Value Share (%) and BPS Analysis by Country, 2025 to 2035
  • Figure 32: North America Market Y-o-Y Growth (%) Projections by Country, 2025 to 2035
  • Figure 33: North America Market Value (USD Million) Analysis by Portability Type, 2020 to 2035
  • Figure 34: North America Market Volume (Units) Analysis by Portability Type, 2020 to 2035
  • Figure 35: North America Market Value Share (%) and BPS Analysis by Portability Type, 2025 to 2035
  • Figure 36: North America Market Y-o-Y Growth (%) Projections by Portability Type, 2025 to 2035
  • Figure 37: North America Market Value (USD Million) Analysis by End-Use, 2020 to 2035
  • Figure 38: North America Market Volume (Units) Analysis by End-Use, 2020 to 2035
  • Figure 39: North America Market Value Share (%) and BPS Analysis by End-Use, 2025 to 2035
  • Figure 40: North America Market Y-o-Y Growth (%) Projections by End-Use, 2025 to 2035
  • Figure 41: North America Market Value (USD Million) Analysis by Equipment Type, 2020 to 2035
  • Figure 42: North America Market Volume (Units) Analysis by Equipment Type, 2020 to 2035
  • Figure 43: North America Market Value Share (%) and BPS Analysis by Equipment Type, 2025 to 2035
  • Figure 44: North America Market Y-o-Y Growth (%) Projections by Equipment Type, 2025 to 2035
  • Figure 45: North America Market Attractiveness by Portability Type, 2025 to 2035
  • Figure 46: North America Market Attractiveness by End-Use, 2025 to 2035
  • Figure 47: North America Market Attractiveness by Equipment Type, 2025 to 2035
  • Figure 48: North America Market Attractiveness by Country, 2025 to 2035
  • Figure 49: Latin America Market Value (USD Million) by Portability Type, 2025 to 2035
  • Figure 50: Latin America Market Value (USD Million) by End-Use, 2025 to 2035
  • Figure 51: Latin America Market Value (USD Million) by Equipment Type, 2025 to 2035
  • Figure 52: Latin America Market Value (USD Million) by Country, 2025 to 2035
  • Figure 53: Latin America Market Value (USD Million) Analysis by Country, 2020 to 2035
  • Figure 54: Latin America Market Volume (Units) Analysis by Country, 2020 to 2035
  • Figure 55: Latin America Market Value Share (%) and BPS Analysis by Country, 2025 to 2035
  • Figure 56: Latin America Market Y-o-Y Growth (%) Projections by Country, 2025 to 2035
  • Figure 57: Latin America Market Value (USD Million) Analysis by Portability Type, 2020 to 2035
  • Figure 58: Latin America Market Volume (Units) Analysis by Portability Type, 2020 to 2035
  • Figure 59: Latin America Market Value Share (%) and BPS Analysis by Portability Type, 2025 to 2035
  • Figure 60: Latin America Market Y-o-Y Growth (%) Projections by Portability Type, 2025 to 2035
  • Figure 61: Latin America Market Value (USD Million) Analysis by End-Use, 2020 to 2035
  • Figure 62: Latin America Market Volume (Units) Analysis by End-Use, 2020 to 2035
  • Figure 63: Latin America Market Value Share (%) and BPS Analysis by End-Use, 2025 to 2035
  • Figure 64: Latin America Market Y-o-Y Growth (%) Projections by End-Use, 2025 to 2035
  • Figure 65: Latin America Market Value (USD Million) Analysis by Equipment Type, 2020 to 2035
  • Figure 66: Latin America Market Volume (Units) Analysis by Equipment Type, 2020 to 2035
  • Figure 67: Latin America Market Value Share (%) and BPS Analysis by Equipment Type, 2025 to 2035
  • Figure 68: Latin America Market Y-o-Y Growth (%) Projections by Equipment Type, 2025 to 2035
  • Figure 69: Latin America Market Attractiveness by Portability Type, 2025 to 2035
  • Figure 70: Latin America Market Attractiveness by End-Use, 2025 to 2035
  • Figure 71: Latin America Market Attractiveness by Equipment Type, 2025 to 2035
  • Figure 72: Latin America Market Attractiveness by Country, 2025 to 2035
  • Figure 73: Western Europe Market Value (USD Million) by Portability Type, 2025 to 2035
  • Figure 74: Western Europe Market Value (USD Million) by End-Use, 2025 to 2035
  • Figure 75: Western Europe Market Value (USD Million) by Equipment Type, 2025 to 2035
  • Figure 76: Western Europe Market Value (USD Million) by Country, 2025 to 2035
  • Figure 77: Western Europe Market Value (USD Million) Analysis by Country, 2020 to 2035
  • Figure 78: Western Europe Market Volume (Units) Analysis by Country, 2020 to 2035
  • Figure 79: Western Europe Market Value Share (%) and BPS Analysis by Country, 2025 to 2035
  • Figure 80: Western Europe Market Y-o-Y Growth (%) Projections by Country, 2025 to 2035
  • Figure 81: Western Europe Market Value (USD Million) Analysis by Portability Type, 2020 to 2035
  • Figure 82: Western Europe Market Volume (Units) Analysis by Portability Type, 2020 to 2035
  • Figure 83: Western Europe Market Value Share (%) and BPS Analysis by Portability Type, 2025 to 2035
  • Figure 84: Western Europe Market Y-o-Y Growth (%) Projections by Portability Type, 2025 to 2035
  • Figure 85: Western Europe Market Value (USD Million) Analysis by End-Use, 2020 to 2035
  • Figure 86: Western Europe Market Volume (Units) Analysis by End-Use, 2020 to 2035
  • Figure 87: Western Europe Market Value Share (%) and BPS Analysis by End-Use, 2025 to 2035
  • Figure 88: Western Europe Market Y-o-Y Growth (%) Projections by End-Use, 2025 to 2035
  • Figure 89: Western Europe Market Value (USD Million) Analysis by Equipment Type, 2020 to 2035
  • Figure 90: Western Europe Market Volume (Units) Analysis by Equipment Type, 2020 to 2035
  • Figure 91: Western Europe Market Value Share (%) and BPS Analysis by Equipment Type, 2025 to 2035
  • Figure 92: Western Europe Market Y-o-Y Growth (%) Projections by Equipment Type, 2025 to 2035
  • Figure 93: Western Europe Market Attractiveness by Portability Type, 2025 to 2035
  • Figure 94: Western Europe Market Attractiveness by End-Use, 2025 to 2035
  • Figure 95: Western Europe Market Attractiveness by Equipment Type, 2025 to 2035
  • Figure 96: Western Europe Market Attractiveness by Country, 2025 to 2035
  • Figure 97: Eastern Europe Market Value (USD Million) by Portability Type, 2025 to 2035
  • Figure 98: Eastern Europe Market Value (USD Million) by End-Use, 2025 to 2035
  • Figure 99: Eastern Europe Market Value (USD Million) by Equipment Type, 2025 to 2035
  • Figure 100: Eastern Europe Market Value (USD Million) by Country, 2025 to 2035
  • Figure 101: Eastern Europe Market Value (USD Million) Analysis by Country, 2020 to 2035
  • Figure 102: Eastern Europe Market Volume (Units) Analysis by Country, 2020 to 2035
  • Figure 103: Eastern Europe Market Value Share (%) and BPS Analysis by Country, 2025 to 2035
  • Figure 104: Eastern Europe Market Y-o-Y Growth (%) Projections by Country, 2025 to 2035
  • Figure 105: Eastern Europe Market Value (USD Million) Analysis by Portability Type, 2020 to 2035
  • Figure 106: Eastern Europe Market Volume (Units) Analysis by Portability Type, 2020 to 2035
  • Figure 107: Eastern Europe Market Value Share (%) and BPS Analysis by Portability Type, 2025 to 2035
  • Figure 108: Eastern Europe Market Y-o-Y Growth (%) Projections by Portability Type, 2025 to 2035
  • Figure 109: Eastern Europe Market Value (USD Million) Analysis by End-Use, 2020 to 2035
  • Figure 110: Eastern Europe Market Volume (Units) Analysis by End-Use, 2020 to 2035
  • Figure 111: Eastern Europe Market Value Share (%) and BPS Analysis by End-Use, 2025 to 2035
  • Figure 112: Eastern Europe Market Y-o-Y Growth (%) Projections by End-Use, 2025 to 2035
  • Figure 113: Eastern Europe Market Value (USD Million) Analysis by Equipment Type, 2020 to 2035
  • Figure 114: Eastern Europe Market Volume (Units) Analysis by Equipment Type, 2020 to 2035
  • Figure 115: Eastern Europe Market Value Share (%) and BPS Analysis by Equipment Type, 2025 to 2035
  • Figure 116: Eastern Europe Market Y-o-Y Growth (%) Projections by Equipment Type, 2025 to 2035
  • Figure 117: Eastern Europe Market Attractiveness by Portability Type, 2025 to 2035
  • Figure 118: Eastern Europe Market Attractiveness by End-Use, 2025 to 2035
  • Figure 119: Eastern Europe Market Attractiveness by Equipment Type, 2025 to 2035
  • Figure 120: Eastern Europe Market Attractiveness by Country, 2025 to 2035
  • Figure 121: South Asia and Pacific Market Value (USD Million) by Portability Type, 2025 to 2035
  • Figure 122: South Asia and Pacific Market Value (USD Million) by End-Use, 2025 to 2035
  • Figure 123: South Asia and Pacific Market Value (USD Million) by Equipment Type, 2025 to 2035
  • Figure 124: South Asia and Pacific Market Value (USD Million) by Country, 2025 to 2035
  • Figure 125: South Asia and Pacific Market Value (USD Million) Analysis by Country, 2020 to 2035
  • Figure 126: South Asia and Pacific Market Volume (Units) Analysis by Country, 2020 to 2035
  • Figure 127: South Asia and Pacific Market Value Share (%) and BPS Analysis by Country, 2025 to 2035
  • Figure 128: South Asia and Pacific Market Y-o-Y Growth (%) Projections by Country, 2025 to 2035
  • Figure 129: South Asia and Pacific Market Value (USD Million) Analysis by Portability Type, 2020 to 2035
  • Figure 130: South Asia and Pacific Market Volume (Units) Analysis by Portability Type, 2020 to 2035
  • Figure 131: South Asia and Pacific Market Value Share (%) and BPS Analysis by Portability Type, 2025 to 2035
  • Figure 132: South Asia and Pacific Market Y-o-Y Growth (%) Projections by Portability Type, 2025 to 2035
  • Figure 133: South Asia and Pacific Market Value (USD Million) Analysis by End-Use, 2020 to 2035
  • Figure 134: South Asia and Pacific Market Volume (Units) Analysis by End-Use, 2020 to 2035
  • Figure 135: South Asia and Pacific Market Value Share (%) and BPS Analysis by End-Use, 2025 to 2035
  • Figure 136: South Asia and Pacific Market Y-o-Y Growth (%) Projections by End-Use, 2025 to 2035
  • Figure 137: South Asia and Pacific Market Value (USD Million) Analysis by Equipment Type, 2020 to 2035
  • Figure 138: South Asia and Pacific Market Volume (Units) Analysis by Equipment Type, 2020 to 2035
  • Figure 139: South Asia and Pacific Market Value Share (%) and BPS Analysis by Equipment Type, 2025 to 2035
  • Figure 140: South Asia and Pacific Market Y-o-Y Growth (%) Projections by Equipment Type, 2025 to 2035
  • Figure 141: South Asia and Pacific Market Attractiveness by Portability Type, 2025 to 2035
  • Figure 142: South Asia and Pacific Market Attractiveness by End-Use, 2025 to 2035
  • Figure 143: South Asia and Pacific Market Attractiveness by Equipment Type, 2025 to 2035
  • Figure 144: South Asia and Pacific Market Attractiveness by Country, 2025 to 2035
  • Figure 145: East Asia Market Value (USD Million) by Portability Type, 2025 to 2035
  • Figure 146: East Asia Market Value (USD Million) by End-Use, 2025 to 2035
  • Figure 147: East Asia Market Value (USD Million) by Equipment Type, 2025 to 2035
  • Figure 148: East Asia Market Value (USD Million) by Country, 2025 to 2035
  • Figure 149: East Asia Market Value (USD Million) Analysis by Country, 2020 to 2035
  • Figure 150: East Asia Market Volume (Units) Analysis by Country, 2020 to 2035
  • Figure 151: East Asia Market Value Share (%) and BPS Analysis by Country, 2025 to 2035
  • Figure 152: East Asia Market Y-o-Y Growth (%) Projections by Country, 2025 to 2035
  • Figure 153: East Asia Market Value (USD Million) Analysis by Portability Type, 2020 to 2035
  • Figure 154: East Asia Market Volume (Units) Analysis by Portability Type, 2020 to 2035
  • Figure 155: East Asia Market Value Share (%) and BPS Analysis by Portability Type, 2025 to 2035
  • Figure 156: East Asia Market Y-o-Y Growth (%) Projections by Portability Type, 2025 to 2035
  • Figure 157: East Asia Market Value (USD Million) Analysis by End-Use, 2020 to 2035
  • Figure 158: East Asia Market Volume (Units) Analysis by End-Use, 2020 to 2035
  • Figure 159: East Asia Market Value Share (%) and BPS Analysis by End-Use, 2025 to 2035
  • Figure 160: East Asia Market Y-o-Y Growth (%) Projections by End-Use, 2025 to 2035
  • Figure 161: East Asia Market Value (USD Million) Analysis by Equipment Type, 2020 to 2035
  • Figure 162: East Asia Market Volume (Units) Analysis by Equipment Type, 2020 to 2035
  • Figure 163: East Asia Market Value Share (%) and BPS Analysis by Equipment Type, 2025 to 2035
  • Figure 164: East Asia Market Y-o-Y Growth (%) Projections by Equipment Type, 2025 to 2035
  • Figure 165: East Asia Market Attractiveness by Portability Type, 2025 to 2035
  • Figure 166: East Asia Market Attractiveness by End-Use, 2025 to 2035
  • Figure 167: East Asia Market Attractiveness by Equipment Type, 2025 to 2035
  • Figure 168: East Asia Market Attractiveness by Country, 2025 to 2035
  • Figure 169: Middle East and Africa Market Value (USD Million) by Portability Type, 2025 to 2035
  • Figure 170: Middle East and Africa Market Value (USD Million) by End-Use, 2025 to 2035
  • Figure 171: Middle East and Africa Market Value (USD Million) by Equipment Type, 2025 to 2035
  • Figure 172: Middle East and Africa Market Value (USD Million) by Country, 2025 to 2035
  • Figure 173: Middle East and Africa Market Value (USD Million) Analysis by Country, 2020 to 2035
  • Figure 174: Middle East and Africa Market Volume (Units) Analysis by Country, 2020 to 2035
  • Figure 175: Middle East and Africa Market Value Share (%) and BPS Analysis by Country, 2025 to 2035
  • Figure 176: Middle East and Africa Market Y-o-Y Growth (%) Projections by Country, 2025 to 2035
  • Figure 177: Middle East and Africa Market Value (USD Million) Analysis by Portability Type, 2020 to 2035
  • Figure 178: Middle East and Africa Market Volume (Units) Analysis by Portability Type, 2020 to 2035
  • Figure 179: Middle East and Africa Market Value Share (%) and BPS Analysis by Portability Type, 2025 to 2035
  • Figure 180: Middle East and Africa Market Y-o-Y Growth (%) Projections by Portability Type, 2025 to 2035
  • Figure 181: Middle East and Africa Market Value (USD Million) Analysis by End-Use, 2020 to 2035
  • Figure 182: Middle East and Africa Market Volume (Units) Analysis by End-Use, 2020 to 2035
  • Figure 183: Middle East and Africa Market Value Share (%) and BPS Analysis by End-Use, 2025 to 2035
  • Figure 184: Middle East and Africa Market Y-o-Y Growth (%) Projections by End-Use, 2025 to 2035
  • Figure 185: Middle East and Africa Market Value (USD Million) Analysis by Equipment Type, 2020 to 2035
  • Figure 186: Middle East and Africa Market Volume (Units) Analysis by Equipment Type, 2020 to 2035
  • Figure 187: Middle East and Africa Market Value Share (%) and BPS Analysis by Equipment Type, 2025 to 2035
  • Figure 188: Middle East and Africa Market Y-o-Y Growth (%) Projections by Equipment Type, 2025 to 2035
  • Figure 189: Middle East and Africa Market Attractiveness by Portability Type, 2025 to 2035
  • Figure 190: Middle East and Africa Market Attractiveness by End-Use, 2025 to 2035
  • Figure 191: Middle East and Africa Market Attractiveness by Equipment Type, 2025 to 2035
  • Figure 192: Middle East and Africa Market Attractiveness by Country, 2025 to 2035

Frequently Asked Questions

What is the market scenario of the Global FTIR Gas Analyser?

During the forecast year of 2025 to 2035, the Global FTIR Gas Analyser market would be twirling at a high growth rate of 8.5%.

How much was the worldwide FTIR Gas Analyser industry worth in 2025?

The Worldwide FTIR Gas Analyser market was valued at USD 2.3 billion for the year 2025.

How much will be the worth of Global FTIR Gas Analyser Industry by the end of 2035?

News: The Global FTIR Gas Analyser Industry is expected to reach USD 5.2 Billion by 2035 End.

What region is anticipated to exhibit the steer CAGR over the conjecture time frame?

North America is the fastest growing region in the In-line continuous emission monitoring system market, owing to stringent environmental regulations and rising need for monitoring industrial emissions.

Who are the major players in the Global FTIR Gas Analyser market?

BREMBO S.p.A., Surface Transforms PLC, MAT Foundry Group Ltd., TVR Automotive Limited, Alfa Romeo Automobiles S.p.A., Audi AG, Volkswagen of America, Carroll Shelby International, ALPINA Burkard Bovensiepen GmbH + Co. KG, BRABUS GmbH, ABT Sportsline GmbH, DeLorean Motor Company, and others are the key players operating in the Global FTIR Gas Analyser industry.

Explore Similar Insights

Future Market Insights

FTIR Gas Analyser Market