Fully Automatic Hydraulic Lifting Column Market Forecast and Outlook (2025-2035)

The global fully automatic hydraulic lifting column market is projected to reach USD 316.6 million by 2035, recording an absolute increase of USD 169.9 million over the forecast period. The market is valued at USD 146.7 million in 2025 and is projected to grow at a CAGR of 8.0% during the forecast period. The overall market size is expected to grow by nearly 2.2 times during the same period, driven by the increasing adoption of automated security systems and digital transformation initiatives across the public safety and commercial sectors. However, high initial investment costs and the complexity of integrating new lifting technologies with existing security infrastructure may pose challenges to market expansion.
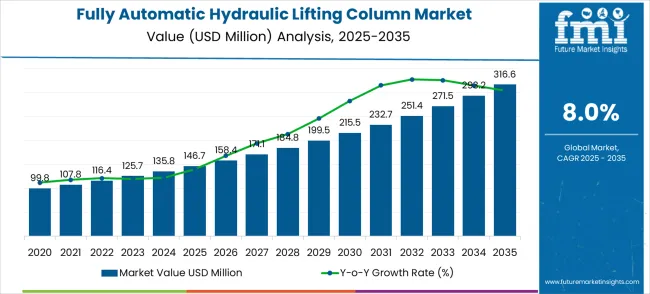
Quick Stats for Fully Automatic Hydraulic Lifting Column Market

  • Fully Automatic Hydraulic Lifting Column Market Value (2025): USD 146.7 million
  • Fully Automatic Hydraulic Lifting Column Market Forecast Value (2035): USD 316.6 million
  • Fully Automatic Hydraulic Lifting Column Market Forecast CAGR: 8.0%
  • Leading Product Type in Fully Automatic Hydraulic Lifting Column Market: Split Type (58% market Share)
  • Key Growth Regions in Fully Automatic Hydraulic Lifting Column Market: Asia Pacific, Europe, and North America
  • Top Key Players in Fully Automatic Hydraulic Lifting Column Market: ROEMHELD Group, Kanya AG, BIBUS, LINAK, TiMOTION Technology, Velyen, Shandong Feitian Optoelectronics Technology, Dahua Technology, Guangdong Qigong Industrial Group
  • Fully Automatic Hydraulic Lifting Column Market Year-over-Year Forecast (2025-2035)

Fully Automatic Hydraulic Lifting Column Market Market Value Analysis

Between 2025 and 2030, the Fully Automatic Hydraulic Lifting Column market is projected to expand from USD 146.7 million to USD 199.5 million, resulting in a value increase of USD 52.8 million, which represents 31.1% of the total forecast growth for the decade. This phase of development will be shaped by rising demand for automated security solutions, product innovation in hydraulic technology and control systems, and expanding integration with IoT and smart city technologies. Companies are establishing competitive positions through investment in advanced hydraulic technologies, AI-powered control capabilities, and strategic market expansion across public safety, commercial, and civil infrastructure sectors.

From 2030 to 2035, the market is forecast to grow from USD 199.5 million to USD 316.6 million, adding another USD 117.1 million, which constitutes 68.9% of the overall ten-year expansion. This period is expected to be characterized by the expansion of specialized lifting systems, including wireless control networks and cloud-based monitoring platforms tailored for specific security applications, strategic collaborations between technology providers and infrastructure equipment manufacturers, and an enhanced focus on urban security and traffic management optimization. The growing emphasis on smart city initiatives and perimeter security will drive demand for intelligent lifting column solutions across diverse public safety and commercial applications.

Fully Automatic Hydraulic Lifting Column Market Key Takeaways

Metric Value
Market Value (2025) USD 146.7 million
Market Forecast Value (2035) USD 316.6 million
Forecast CAGR (2025-2035) 8.0%

Why is the Fully Automatic Hydraulic Lifting Column Market Growing?

The fully automatic hydraulic lifting column market grows by enabling organizations to enhance security infrastructure through automated vehicle access control and perimeter protection systems. Public safety facilities face mounting pressure to improve security measures, with government buildings typically requiring multiple access control points, making automated lifting columns essential for operational efficiency and threat mitigation. The commercial sector's need for seamless traffic flow control - facilities must maintain continuous operation while ensuring security - creates demand for remote-controlled capabilities that can manage vehicle access without manual intervention. Urban security regulations and smart city compliance requirements drive adoption in municipal and infrastructure sectors, where automated access control directly impacts public safety and operational costs. However, budget constraints for security infrastructure upgrades and the complexity of retrofitting legacy access control systems with advanced hydraulic technologies may limit adoption rates among smaller commercial operators.

Segmental Analysis

The market is segmented by product type, application, and region. By product type, the market is divided into split type and integrated type systems. Based on the application, the market is categorized into public safety, commercial, civil, and other applications. Regionally, the market is divided into North America, Europe, Asia Pacific, and other regions.
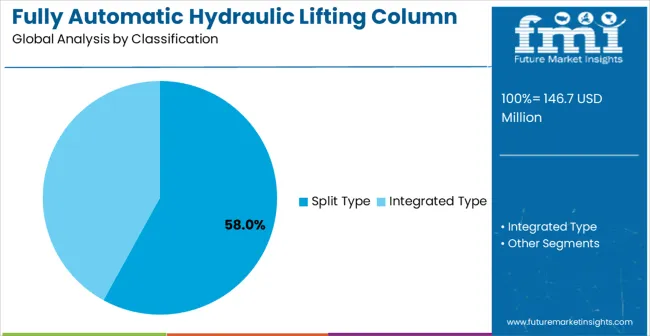
By Product Type, Split Type Segment Accounts for Dominant Market Share

Fully Automatic Hydraulic Lifting Column Market Analysis By Classification

Split type systems are projected to account for the largest share of 58% of the fully automatic hydraulic lifting column market in 2025. This dominant position is supported by the technology's ability to provide modular installation flexibility and enhanced maintenance accessibility, enabling operators to customize deployment configurations according to specific site requirements and security protocols. The segment allows stakeholders to benefit from distributed control capabilities, simplified installation processes in existing infrastructure, and cost-effective scalability for multi-point access control systems. Split Type configurations offer superior adaptability for complex security installations where traditional integrated systems face space or technical constraints.

The modular design enables independent component upgrades and maintenance without system-wide shutdowns, reducing operational disruption and lifecycle costs. Advanced hydraulic control systems within Split Type configurations provide precise lifting speed regulation and emergency stop functionality, meeting stringent safety standards required for high-security applications. Market adoption is accelerated by the segment's compatibility with existing security infrastructure and reduced installation complexity compared to comprehensive system overhauls. The technology's proven reliability in government and commercial applications, combined with standardized component availability, positions Split Type systems as the preferred solution for organizations prioritizing operational flexibility and long-term maintenance efficiency in automated access control deployments.

Key advantages include:
  • Modular hydraulic technology that separates control units from lifting mechanisms for flexible deployment
  • Cost-effective installation solutions enabled by developments in compact hydraulic systems and standardized components
  • Real-time access control with automated threat detection capabilities and emergency override functions

By Application, Public Safety Segment Accounts for Largest Market Share

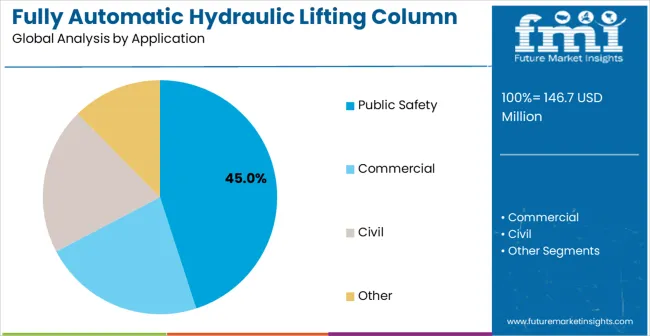
Fully Automatic Hydraulic Lifting Column Market Analysis By Application

Public safety applications are expected to represent the dominant share of 45% fully automatic hydraulic lifting column applications in 2025. This leading position reflects the critical role of automated access control as essential infrastructure for government facilities, military installations, and critical infrastructure protection, where continuous security monitoring is essential for national security and public protection. The segment provides critical support for perimeter security and vehicle access management in high-security environments where manual security checkpoint operation is impractical during continuous operation. Government agencies increasingly prioritize automated solutions that can respond to security threats within seconds while maintaining operational continuity.

The Public safety segment benefits from substantial government funding allocations for infrastructure security upgrades, particularly following heightened global security concerns and evolving threat landscapes. Federal mandates requiring enhanced perimeter protection at sensitive facilities drive consistent demand, while standardized procurement processes facilitate large-scale deployments across multiple government locations. Integration capabilities with existing security systems, including surveillance cameras and access control databases, enable comprehensive threat assessment and response coordination. The segment's growth is further supported by international security cooperation initiatives and technology sharing agreements that promote standardized automated security solutions across allied nations and critical infrastructure operators worldwide.

Key market dynamics include:

  • Government facilities requiring specialized automated solutions for multi-level security protocols
  • Public safety emphasis on rapid deployment capabilities to respond to security threats in critical infrastructure
  • Growing adoption of integrated security systems and AI-powered threat assessment for operational optimization in public safety applications

What are the Drivers, Restraints, and Key Trends of the Fully Automatic Hydraulic Lifting Column Market?

The market is driven by three concrete demand factors tied to security outcomes. First, automated threat response capabilities reduce security breach risks by providing immediate vehicle access denial within seconds of threat detection, with government facilities experiencing up to 40% improvement in perimeter security effectiveness through automated lifting column systems. Second, operational efficiency optimization through remote control capabilities enables security operators to achieve 25% reduction in personnel requirements while maintaining comprehensive access control standards. Third, regulatory compliance requirements for critical infrastructure protection and anti-terrorism measures create mandatory adoption scenarios across public safety sectors.

Market restraints include high initial investment costs that can deter smaller commercial enterprises from upgrading their access control systems, particularly in developing regions where capital allocation for advanced security technologies remains limited. Integration complexity poses another significant challenge, as implementing new hydraulic lifting technologies with existing security systems requires substantial training and expertise, potentially causing operational disruptions during transition periods. Rapid technological advancement creates continuous pressure for system updates, demanding ongoing research and development investments that strain organizational resources.

Key trends indicate accelerated adoption in Asia-Pacific markets, particularly China and India, where urban development and security regulations drive lifting column system deployment. Design shifts toward AI-powered control systems, IoT-enabled devices, and cloud-based monitoring platforms enable predictive capabilities that transform security from reactive to proactive approaches. However, the market thesis could face disruption if alternative access control technologies or radical changes in urban security methods reduce reliance on traditional hydraulic lifting column operations.
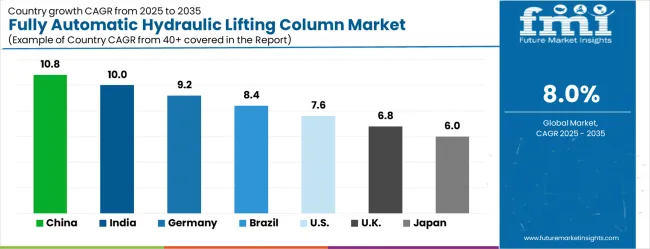
Analysis of Fully Automatic Hydraulic Lifting Column Market by Key Country

Fully Automatic Hydraulic Lifting Column Market Cagr Analysis By Country

Country CAGR (2025-2035)
China 10.8%
India 10.0%
Germany 9.2%
Brazil 8.4%
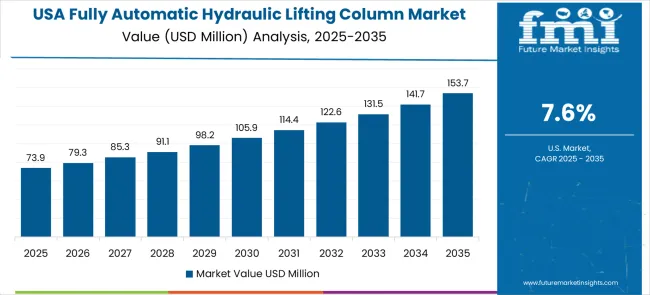
USA 7.6%
UK 6.8%
Japan 6.0%

The fully automatic hydraulic lifting column market is gathering pace worldwide, with China taking the lead at a CAGR of 10.8% thanks to rapid urbanization and infrastructure security mandates. Close behind, India benefits from expanding smart city initiatives and government programs promoting urban security, achieving a CAGR of 10.0% and positioning itself as a strategic hub for growth. Germany shows steady advancement with a CAGR of 9.2%, where integration of Industry 4.0 technologies strengthens its role in the European security infrastructure supply chain. Brazil is sharpening its focus on public safety enhancement and infrastructure protection at a CAGR of 8.4%, signaling an ambition to capture niche opportunities in South American markets. Meanwhile, the USA stands out for its advanced adoption of security technology with a CAGR of 7.6%, and the UK (6.8% CAGR) and Japan (6.0% CAGR) continue to record consistent progress. Together, China and India anchor the global expansion story, while the rest build stability and diversity into the market's growth path.

The report covers an in-depth analysis of 40+ countries, the top-performing countries are highlighted below.

China Leads Global Market Expansion

China demonstrates the strongest growth potential in the fully automatic hydraulic lifting column market with a CAGR of 10.8% through 2035. The country's leadership position stems from massive urban development projects, aggressive smart city automation initiatives, and stringent security regulations, driving the adoption of advanced access control technologies. Growth is concentrated in major urban centers, including Beijing, Shanghai, and Guangzhou, where government facilities and commercial complexes are implementing automated security solutions to comply with national security enhancement targets. Chinese security operators are adopting intelligent lifting column systems for perimeter protection optimization and access control improvement in high-security installations. Distribution channels through local security integrators and government-backed infrastructure modernization programs expand deployment across state-owned facilities and private commercial developments. The country's "Smart City 2030" strategy provides policy support for automated security initiatives, including hydraulic lifting column system adoption.

Key market factors:

  • Government and commercial facility concentration in eastern coastal regions
  • Government subsidies for security infrastructure upgrades unlock adoption with 20% cost reduction incentives
  • Strategic partnerships between international lifting column providers and domestic security equipment manufacturers

India Emerges as High-Growth Market

In Mumbai, Delhi, and Bangalore, adoption of intelligent hydraulic lifting column systems with a CAGR of 10% is accelerating across government facilities and commercial complexes, driven by rapid urban expansion and security enhancement pressures. The market demonstrates strong growth momentum with a CAGR of 10.0% through 2035, linked to government initiatives promoting smart city development and infrastructure security compliance. Indian security operators are implementing automated access control systems and remote monitoring platforms to improve security effectiveness while meeting increasingly stringent protection standards in major urban corridors. The country's expanding infrastructure development creates sustained demand for perimeter security optimization, while growing focus on public safety drives adoption of lifting technologies that enhance threat response capabilities.

  • Leading smart city development states, including Maharashtra, Karnataka, and Gujarat, are driving adoption
  • Security automation channel growth enabling 30% faster deployment timelines
  • Public-private partnerships accelerating technology transfer with international lifting column providers

Germany Maintains Technology Leadership

The market maintains steady growth through focus on Industry 4.0 integration and security compliance, with a CAGR of 9.2% through 2035. Germany's advanced security infrastructure demonstrates sophisticated implementation of intelligent hydraulic lifting column systems, with documented case studies showing 30% improvement in access control effectiveness through automated deployment platforms. The country's security sector in North Rhine-Westphalia, Bavaria, and Baden-Württemberg showcases integration of lifting technologies with existing perimeter security systems, leveraging expertise in automation and hydraulic technologies. German facilities emphasize precision engineering and reliability standards, creating demand for high-accuracy lifting solutions that support continuous security improvement initiatives.

Key development areas:

  • Government and critical infrastructure segments are leading in lifting column system adoption
  • Security services channel providing integrated solutions with 92% customer retention rates
  • Technology partnerships between ROEMHELD Group, Kanya AG and security facility operators are expanding market reach

Brazil Shows Strong Regional Leadership

Brazil's market expansion is driven by diverse security infrastructure demand with a CAGR of 8.4%, including government facilities in São Paulo and Rio de Janeiro, commercial complexes in Brasília, and critical infrastructure protection across multiple states. The country faces implementation challenges related to capital investment constraints and technical expertise availability, requiring phased deployment approaches and financing support. However, growing security regulations and urban safety pressures create compelling business cases for the adoption of lifting column systems, particularly in high-risk urban areas where automated access control directly impacts public safety and operational effectiveness.

Market characteristics:
  • Government facility segment showing fastest growth with 15% annual increase in lifting column installations
  • Regional expansion trends focused on security infrastructure clusters in southeastern states
  • Future projections indicate the need for local technical support infrastructure and training programs to sustain growth

United States Demonstrates Technology Innovation

Fully Automatic Hydraulic Lifting Column Market Country Value Analysis

The USA market leads in advanced lifting column system innovation based on integration with artificial intelligence and machine learning platforms for threat assessment analytics. The country shows strong potential with a CAGR of 7.6% through 2035, driven by security enhancement requirements under compliance and reliability constraints across government, commercial, and critical infrastructure sectors. American security facilities are adopting intelligent lifting column systems for perimeter protection improvement and regulatory compliance, particularly in regions with strict federal security standards. Technology deployment channels through security automation distributors and direct manufacturer relationships expand coverage across government facilities and commercial complexes. Implementation of advanced control systems demonstrates the successful integration of lifting technologies with existing security infrastructure.

Leading market segments:
  • Government facilities in Washington D.C., Texas, and California are implementing comprehensive lifting column solutions
  • Security automation channel growth with 88% annual renewal rates for maintenance service contracts
  • Strategic partnerships between LINAK, TiMOTION Technology and major security operators

Japan Emphasizes Precision Security Integration

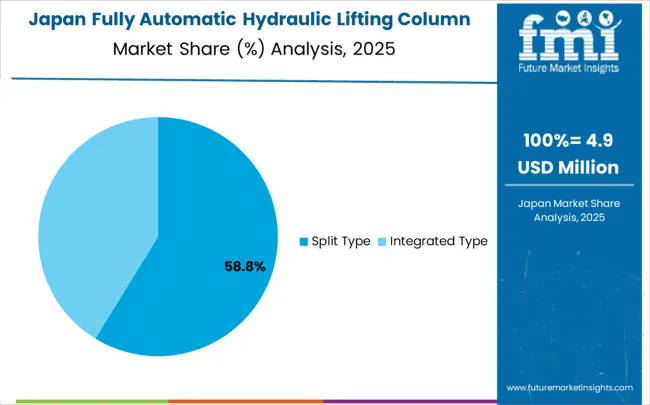
Fully Automatic Hydraulic Lifting Column Market Japan Market Share Analysis By Classification

Japan's fully automatic hydraulic lifting column market demonstrates sophisticated implementation focused on precision security and reliability optimization, with documented integration of automated access control systems achieving 20% improvement in security response consistency across government and commercial facilities. The country maintains steady growth momentum with a CAGR of 6.0% through 2035, driven by security facilities' emphasis on operational excellence and continuous improvement methodologies that align with comprehensive security management principles. Major urban centers, including Tokyo, Osaka, and Nagoya, showcase advanced deployment of automated access control platforms where lifting column systems integrate seamlessly with existing security management systems and automated threat detection controls.

Key market characteristics:

  • Precision security sectors, including government and financial services, are driving advanced lifting column requirements
  • Security automation partnerships enabling 96% system reliability with comprehensive maintenance programs
  • Technology collaboration between domestic automation leaders and international lifting column providers

United Kingdom Drives Security-Focused Adoption

In London, Manchester, and Birmingham, security facilities are implementing intelligent hydraulic lifting column systems to meet enhanced protection targets under the UK's National Security Strategy, with government facilities achieving 18% improvement in perimeter security effectiveness through optimized access control. The market shows moderate growth potential with a CAGR of 6.8% through 2035, linked to regulatory compliance requirements and infrastructure security initiatives that mandate access control improvements. British security operators are adopting automated lifting systems and predictive monitoring platforms to enhance security effectiveness while maintaining operational efficiency in urban environments where threat assessment increasingly influences security decisions. The country's established critical infrastructure sector creates sustained demand for specialized lifting solutions that support both operational security and compliance requirements across diverse government and commercial applications.

Market development factors:
  • Government and financial services industries leading lifting column system deployment in Greater London and northern England
  • Security infrastructure programs providing 15% capital allowances for automated access control equipment upgrades
  • Strategic partnerships between UK security operators and European technology providers are expanding market access

Europe Market Split by Country

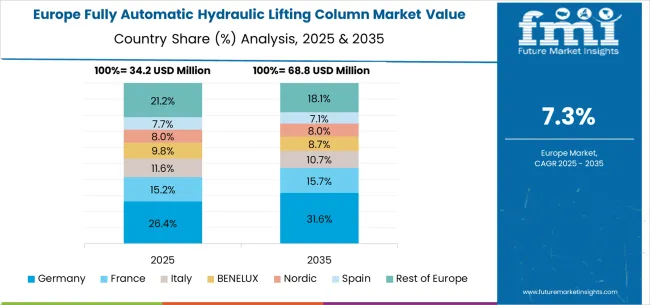
Fully Automatic Hydraulic Lifting Column Market Europe Country Market Share Analysis, 2025 & 2035

The fully automatic hydraulic lifting column market in Europe is projected to grow from USD 29.2 million in 2025 to USD 58.7 million by 2035, registering a CAGR of 7.2% over the forecast period. Germany is expected to maintain its leadership position with a 31.5% market share in 2025, declining slightly to 30.8% by 2035, supported by its advanced security infrastructure and major urban centers including Berlin and Munich.

France follows with a 22.1% share in 2025, projected to reach 22.6% by 2035, driven by comprehensive urban security modernization programs in Paris and other major metropolitan areas. The United Kingdom holds a 19.4% share in 2025, expected to decrease to 18.9% by 2035 due to post-Brexit security infrastructure adjustments. Italy commands a 12.8% share, while Spain accounts for 8.9% in 2025. The Rest of Europe region is anticipated to gain momentum, expanding its collective share from 5.3% to 6.2% by 2035, attributed to increasing lifting column adoption in Nordic countries and emerging Eastern European cities implementing smart security programs.
Competitive Landscape of Fully Automatic Hydraulic Lifting Column Market

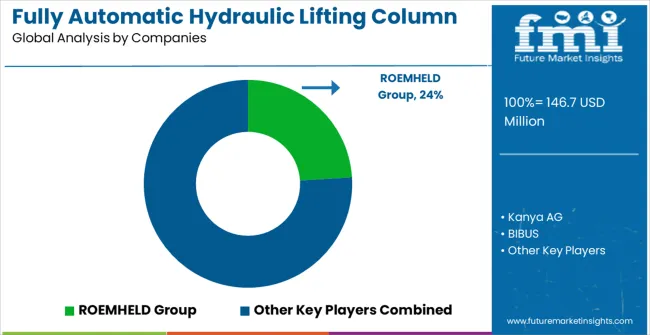
Fully Automatic Hydraulic Lifting Column Market Analysis By Company

The Fully Automatic Hydraulic Lifting Column market features approximately 12-15 meaningful players with moderate concentration, where the top three companies control roughly 42-47% of global market share through established technology platforms and extensive security customer relationships. Competition centers on technological differentiation, service capabilities, and integration expertise rather than price competition alone.

Market leaders include ROEMHELD Group, Kanya AG, and LINAK, which maintain competitive advantages through comprehensive hydraulic portfolios, global service networks, and deep security process expertise, creating high switching costs for customers. These companies leverage installed base relationships and ongoing service contracts to defend market positions while expanding into adjacent security monitoring applications.

Challengers encompass TiMOTION Technology and BIBUS, which compete through specialized lifting solutions and strong regional presence in key security markets. Technology specialists, including Velyen, Shandong Feitian Optoelectronics Technology, and Dahua Technology, focus on specific hydraulic technologies or vertical applications, offering differentiated capabilities in automated control, security system integration, and predictive maintenance platforms.

Regional players and emerging technology providers create competitive pressure through cost-effective solutions and rapid deployment capabilities, particularly in high-growth markets including China and India, where local presence provides advantages in customer support and regulatory compliance. Market dynamics favor companies that combine advanced hydraulic technologies with AI-powered control systems and comprehensive service offerings that address the complete lifting column system lifecycle from installation through ongoing optimization.

Key Players in the Fully Automatic Hydraulic Lifting Column Market

  • ROEMHELD Group
  • Kanya AG
  • BIBUS
  • LINAK
  • TiMOTION Technology
  • Velyen
  • Shandong Feitian Optoelectronics Technology
  • Dahua Technology
  • Guangdong Qigong Industrial Group
  • Shen ZHEN Libtor Technology
  • JKDC Security
  • Jiuding Intelligent
  • Foshan Ddun Protection Equipment Technology
  • Shanghai Liqing Intelligent Technology
  • Jiangsu Guojin Tewei Technology

Scope of the Report

Item Value
Quantitative Units USD 146.7 million
Product Type Split Type, Integrated Type
Application Public Safety, Commercial, Civil, Other
Regions Covered North America, Europe, Asia Pacific, Latin America, Middle East & Africa
Country Covered China, India, Germany, Brazil, the U.S., the U.K., Japan, and 40+ countries
Key Companies Profiled ROEMHELD Group, Kanya AG, BIBUS, LINAK, TiMOTION Technology, Velyen, Shandong Feitian Optoelectronics Technology, Dahua Technology, Guangdong Qigong Industrial Group
Additional Attributes Dollar sales by product type and application categories, regional adoption trends across North America, Europe, and Asia-Pacific, competitive landscape with technology providers and system integrators, security facility preferences and requirements, integration with smart city initiatives and IoT platforms, innovations in hydraulic technology and automated control systems, and development of specialized lifting applications with security compliance capabilities.

Fully Automatic Hydraulic Lifting Column Market by Segments

Product Type:

  • Split Type
  • Integrated Type

Application:

  • Public Safety
  • Commercial
  • Civil
  • Other

Region:

  • North America
    • United States
    • Canada
    • Mexico
  • Europe
    • Germany
    • United Kingdom
    • France
    • Italy
    • Spain
    • Nordic
    • BENELUX
    • Rest of Europe
  • Asia Pacific
    • China
    • Japan
    • South Korea
    • India
    • ASEAN
    • Australia & New Zealand
    • Rest of Asia Pacific
  • Latin America
    • Brazil
    • Chile
    • Rest of Latin America
  • Middle East & Africa
    • Kingdom of Saudi Arabia
    • Other GCC Countries
    • Turkiye
    • South Africa
    • Other African Union
    • Rest of Middle East & Africa

Table of Content

  1. Executive Summary
    • Global Market Outlook
    • Demand to side Trends
    • Supply to side Trends
    • Technology Roadmap Analysis
    • Analysis and Recommendations
  2. Market Overview
    • Market Coverage / Taxonomy
    • Market Definition / Scope / Limitations
  3. Market Background
    • Market Dynamics
      • Drivers
      • Restraints
      • Opportunity
      • Trends
    • Scenario Forecast
      • Demand in Optimistic Scenario
      • Demand in Likely Scenario
      • Demand in Conservative Scenario
    • Opportunity Map Analysis
    • Product Life Cycle Analysis
    • Supply Chain Analysis
    • Investment Feasibility Matrix
    • Value Chain Analysis
    • PESTLE and Porter’s Analysis
    • Regulatory Landscape
    • Regional Parent Market Outlook
    • Production and Consumption Statistics
    • Import and Export Statistics
  4. Global Market Analysis 2020 to 2024 and Forecast, 2025 to 2035
    • Historical Market Size Value (USD Million) Analysis, 2020 to 2024
    • Current and Future Market Size Value (USD Million) Projections, 2025 to 2035
      • Y to o to Y Growth Trend Analysis
      • Absolute $ Opportunity Analysis
  5. Global Market Pricing Analysis 2020 to 2024 and Forecast 2025 to 2035
  6. Global Market Analysis 2020 to 2024 and Forecast 2025 to 2035, By Classification
    • Introduction / Key Findings
    • Historical Market Size Value (USD Million) Analysis By Classification , 2020 to 2024
    • Current and Future Market Size Value (USD Million) Analysis and Forecast By Classification , 2025 to 2035
      • Split Type
      • Integrated Type
    • Y to o to Y Growth Trend Analysis By Classification , 2020 to 2024
    • Absolute $ Opportunity Analysis By Classification , 2025 to 2035
  7. Global Market Analysis 2020 to 2024 and Forecast 2025 to 2035, By Application
    • Introduction / Key Findings
    • Historical Market Size Value (USD Million) Analysis By Application, 2020 to 2024
    • Current and Future Market Size Value (USD Million) Analysis and Forecast By Application, 2025 to 2035
      • Public Safety
      • Commercial
      • Civil
      • Other
    • Y to o to Y Growth Trend Analysis By Application, 2020 to 2024
    • Absolute $ Opportunity Analysis By Application, 2025 to 2035
  8. Global Market Analysis 2020 to 2024 and Forecast 2025 to 2035, By Region
    • Introduction
    • Historical Market Size Value (USD Million) Analysis By Region, 2020 to 2024
    • Current Market Size Value (USD Million) Analysis and Forecast By Region, 2025 to 2035
      • North America
      • Latin America
      • Western Europe
      • Eastern Europe
      • East Asia
      • South Asia and Pacific
      • Middle East & Africa
    • Market Attractiveness Analysis By Region
  9. North America Market Analysis 2020 to 2024 and Forecast 2025 to 2035, By Country
    • Historical Market Size Value (USD Million) Trend Analysis By Market Taxonomy, 2020 to 2024
    • Market Size Value (USD Million) Forecast By Market Taxonomy, 2025 to 2035
      • By Country
        • USA
        • Canada
        • Mexico
      • By Classification
      • By Application
    • Market Attractiveness Analysis
      • By Country
      • By Classification
      • By Application
    • Key Takeaways
  10. Latin America Market Analysis 2020 to 2024 and Forecast 2025 to 2035, By Country
    • Historical Market Size Value (USD Million) Trend Analysis By Market Taxonomy, 2020 to 2024
    • Market Size Value (USD Million) Forecast By Market Taxonomy, 2025 to 2035
      • By Country
        • Brazil
        • Chile
        • Rest of Latin America
      • By Classification
      • By Application
    • Market Attractiveness Analysis
      • By Country
      • By Classification
      • By Application
    • Key Takeaways
  11. Western Europe Market Analysis 2020 to 2024 and Forecast 2025 to 2035, By Country
    • Historical Market Size Value (USD Million) Trend Analysis By Market Taxonomy, 2020 to 2024
    • Market Size Value (USD Million) Forecast By Market Taxonomy, 2025 to 2035
      • By Country
        • Germany
        • UK
        • Italy
        • Spain
        • France
        • Nordic
        • BENELUX
        • Rest of Western Europe
      • By Classification
      • By Application
    • Market Attractiveness Analysis
      • By Country
      • By Classification
      • By Application
    • Key Takeaways
  12. Eastern Europe Market Analysis 2020 to 2024 and Forecast 2025 to 2035, By Country
    • Historical Market Size Value (USD Million) Trend Analysis By Market Taxonomy, 2020 to 2024
    • Market Size Value (USD Million) Forecast By Market Taxonomy, 2025 to 2035
      • By Country
        • Russia
        • Poland
        • Hungary
        • Balkan & Baltic
        • Rest of Eastern Europe
      • By Classification
      • By Application
    • Market Attractiveness Analysis
      • By Country
      • By Classification
      • By Application
    • Key Takeaways
  13. East Asia Market Analysis 2020 to 2024 and Forecast 2025 to 2035, By Country
    • Historical Market Size Value (USD Million) Trend Analysis By Market Taxonomy, 2020 to 2024
    • Market Size Value (USD Million) Forecast By Market Taxonomy, 2025 to 2035
      • By Country
        • China
        • Japan
        • South Korea
      • By Classification
      • By Application
    • Market Attractiveness Analysis
      • By Country
      • By Classification
      • By Application
    • Key Takeaways
  14. South Asia and Pacific Market Analysis 2020 to 2024 and Forecast 2025 to 2035, By Country
    • Historical Market Size Value (USD Million) Trend Analysis By Market Taxonomy, 2020 to 2024
    • Market Size Value (USD Million) Forecast By Market Taxonomy, 2025 to 2035
      • By Country
        • India
        • ASEAN
        • Australia & New Zealand
        • Rest of South Asia and Pacific
      • By Classification
      • By Application
    • Market Attractiveness Analysis
      • By Country
      • By Classification
      • By Application
    • Key Takeaways
  15. Middle East & Africa Market Analysis 2020 to 2024 and Forecast 2025 to 2035, By Country
    • Historical Market Size Value (USD Million) Trend Analysis By Market Taxonomy, 2020 to 2024
    • Market Size Value (USD Million) Forecast By Market Taxonomy, 2025 to 2035
      • By Country
        • Kingdom of Saudi Arabia
        • Other GCC Countries
        • Turkiye
        • South Africa
        • Other African Union
        • Rest of Middle East & Africa
      • By Classification
      • By Application
    • Market Attractiveness Analysis
      • By Country
      • By Classification
      • By Application
    • Key Takeaways
  16. Key Countries Market Analysis
    • USA
      • Pricing Analysis
      • Market Share Analysis, 2024
        • By Classification
        • By Application
    • Canada
      • Pricing Analysis
      • Market Share Analysis, 2024
        • By Classification
        • By Application
    • Mexico
      • Pricing Analysis
      • Market Share Analysis, 2024
        • By Classification
        • By Application
    • Brazil
      • Pricing Analysis
      • Market Share Analysis, 2024
        • By Classification
        • By Application
    • Chile
      • Pricing Analysis
      • Market Share Analysis, 2024
        • By Classification
        • By Application
    • Germany
      • Pricing Analysis
      • Market Share Analysis, 2024
        • By Classification
        • By Application
    • UK
      • Pricing Analysis
      • Market Share Analysis, 2024
        • By Classification
        • By Application
    • Italy
      • Pricing Analysis
      • Market Share Analysis, 2024
        • By Classification
        • By Application
    • Spain
      • Pricing Analysis
      • Market Share Analysis, 2024
        • By Classification
        • By Application
    • France
      • Pricing Analysis
      • Market Share Analysis, 2024
        • By Classification
        • By Application
    • India
      • Pricing Analysis
      • Market Share Analysis, 2024
        • By Classification
        • By Application
    • ASEAN
      • Pricing Analysis
      • Market Share Analysis, 2024
        • By Classification
        • By Application
    • Australia & New Zealand
      • Pricing Analysis
      • Market Share Analysis, 2024
        • By Classification
        • By Application
    • China
      • Pricing Analysis
      • Market Share Analysis, 2024
        • By Classification
        • By Application
    • Japan
      • Pricing Analysis
      • Market Share Analysis, 2024
        • By Classification
        • By Application
    • South Korea
      • Pricing Analysis
      • Market Share Analysis, 2024
        • By Classification
        • By Application
    • Russia
      • Pricing Analysis
      • Market Share Analysis, 2024
        • By Classification
        • By Application
    • Poland
      • Pricing Analysis
      • Market Share Analysis, 2024
        • By Classification
        • By Application
    • Hungary
      • Pricing Analysis
      • Market Share Analysis, 2024
        • By Classification
        • By Application
    • Kingdom of Saudi Arabia
      • Pricing Analysis
      • Market Share Analysis, 2024
        • By Classification
        • By Application
    • Turkiye
      • Pricing Analysis
      • Market Share Analysis, 2024
        • By Classification
        • By Application
    • South Africa
      • Pricing Analysis
      • Market Share Analysis, 2024
        • By Classification
        • By Application
  17. Market Structure Analysis
    • Competition Dashboard
    • Competition Benchmarking
    • Market Share Analysis of Top Players
      • By Regional
      • By Classification
      • By Application
  18. Competition Analysis
    • Competition Deep Dive
      • ROEMHELD Group
        • Overview
        • Product Portfolio
        • Profitability by Market Segments (Product/Age /Sales Channel/Region)
        • Sales Footprint
        • Strategy Overview
          • Marketing Strategy
          • Product Strategy
          • Channel Strategy
      • Kanya AG
      • BIBUS
      • LINAK
      • TiMOTION Technology
      • Velyen
      • Shandong Feitian Optoelectronics Technology
      • Dahua Technology
      • Guangdong Qigong Industrial Group
      • Shen ZHEN Libtor Technology
      • JKDC Security
      • Jiuding Intelligent
      • Foshan Ddun Protection Equipment Technology
      • Shanghai Liqing Intelligent Technology
      • Jiangsu Guojin Tewei Technology
  19. Assumptions & Acronyms Used
  20. Research Methodology

List of Tables

  • Table 1: Global Market Value (USD Million) Forecast by Region, 2020 to 2035
  • Table 2: Global Market Value (USD Million) Forecast by Classification , 2020 to 2035
  • Table 3: Global Market Value (USD Million) Forecast by Application, 2020 to 2035
  • Table 4: North America Market Value (USD Million) Forecast by Country, 2020 to 2035
  • Table 5: North America Market Value (USD Million) Forecast by Classification , 2020 to 2035
  • Table 6: North America Market Value (USD Million) Forecast by Application, 2020 to 2035
  • Table 7: Latin America Market Value (USD Million) Forecast by Country, 2020 to 2035
  • Table 8: Latin America Market Value (USD Million) Forecast by Classification , 2020 to 2035
  • Table 9: Latin America Market Value (USD Million) Forecast by Application, 2020 to 2035
  • Table 10: Western Europe Market Value (USD Million) Forecast by Country, 2020 to 2035
  • Table 11: Western Europe Market Value (USD Million) Forecast by Classification , 2020 to 2035
  • Table 12: Western Europe Market Value (USD Million) Forecast by Application, 2020 to 2035
  • Table 13: Eastern Europe Market Value (USD Million) Forecast by Country, 2020 to 2035
  • Table 14: Eastern Europe Market Value (USD Million) Forecast by Classification , 2020 to 2035
  • Table 15: Eastern Europe Market Value (USD Million) Forecast by Application, 2020 to 2035
  • Table 16: East Asia Market Value (USD Million) Forecast by Country, 2020 to 2035
  • Table 17: East Asia Market Value (USD Million) Forecast by Classification , 2020 to 2035
  • Table 18: East Asia Market Value (USD Million) Forecast by Application, 2020 to 2035
  • Table 19: South Asia and Pacific Market Value (USD Million) Forecast by Country, 2020 to 2035
  • Table 20: South Asia and Pacific Market Value (USD Million) Forecast by Classification , 2020 to 2035
  • Table 21: South Asia and Pacific Market Value (USD Million) Forecast by Application, 2020 to 2035
  • Table 22: Middle East & Africa Market Value (USD Million) Forecast by Country, 2020 to 2035
  • Table 23: Middle East & Africa Market Value (USD Million) Forecast by Classification , 2020 to 2035
  • Table 24: Middle East & Africa Market Value (USD Million) Forecast by Application, 2020 to 2035

List of Figures

  • Figure 1: Global Market Pricing Analysis
  • Figure 2: Global Market Value (USD Million) Forecast 2020-2035
  • Figure 3: Global Market Value Share and BPS Analysis by Classification , 2025 and 2035
  • Figure 4: Global Market Y to o to Y Growth Comparison by Classification , 2025-2035
  • Figure 5: Global Market Attractiveness Analysis by Classification
  • Figure 6: Global Market Value Share and BPS Analysis by Application, 2025 and 2035
  • Figure 7: Global Market Y to o to Y Growth Comparison by Application, 2025-2035
  • Figure 8: Global Market Attractiveness Analysis by Application
  • Figure 9: Global Market Value (USD Million) Share and BPS Analysis by Region, 2025 and 2035
  • Figure 10: Global Market Y to o to Y Growth Comparison by Region, 2025-2035
  • Figure 11: Global Market Attractiveness Analysis by Region
  • Figure 12: North America Market Incremental Dollar Opportunity, 2025-2035
  • Figure 13: Latin America Market Incremental Dollar Opportunity, 2025-2035
  • Figure 14: Western Europe Market Incremental Dollar Opportunity, 2025-2035
  • Figure 15: Eastern Europe Market Incremental Dollar Opportunity, 2025-2035
  • Figure 16: East Asia Market Incremental Dollar Opportunity, 2025-2035
  • Figure 17: South Asia and Pacific Market Incremental Dollar Opportunity, 2025-2035
  • Figure 18: Middle East & Africa Market Incremental Dollar Opportunity, 2025-2035
  • Figure 19: North America Market Value Share and BPS Analysis by Country, 2025 and 2035
  • Figure 20: North America Market Value Share and BPS Analysis by Classification , 2025 and 2035
  • Figure 21: North America Market Y to o to Y Growth Comparison by Classification , 2025-2035
  • Figure 22: North America Market Attractiveness Analysis by Classification
  • Figure 23: North America Market Value Share and BPS Analysis by Application, 2025 and 2035
  • Figure 24: North America Market Y to o to Y Growth Comparison by Application, 2025-2035
  • Figure 25: North America Market Attractiveness Analysis by Application
  • Figure 26: Latin America Market Value Share and BPS Analysis by Country, 2025 and 2035
  • Figure 27: Latin America Market Value Share and BPS Analysis by Classification , 2025 and 2035
  • Figure 28: Latin America Market Y to o to Y Growth Comparison by Classification , 2025-2035
  • Figure 29: Latin America Market Attractiveness Analysis by Classification
  • Figure 30: Latin America Market Value Share and BPS Analysis by Application, 2025 and 2035
  • Figure 31: Latin America Market Y to o to Y Growth Comparison by Application, 2025-2035
  • Figure 32: Latin America Market Attractiveness Analysis by Application
  • Figure 33: Western Europe Market Value Share and BPS Analysis by Country, 2025 and 2035
  • Figure 34: Western Europe Market Value Share and BPS Analysis by Classification , 2025 and 2035
  • Figure 35: Western Europe Market Y to o to Y Growth Comparison by Classification , 2025-2035
  • Figure 36: Western Europe Market Attractiveness Analysis by Classification
  • Figure 37: Western Europe Market Value Share and BPS Analysis by Application, 2025 and 2035
  • Figure 38: Western Europe Market Y to o to Y Growth Comparison by Application, 2025-2035
  • Figure 39: Western Europe Market Attractiveness Analysis by Application
  • Figure 40: Eastern Europe Market Value Share and BPS Analysis by Country, 2025 and 2035
  • Figure 41: Eastern Europe Market Value Share and BPS Analysis by Classification , 2025 and 2035
  • Figure 42: Eastern Europe Market Y to o to Y Growth Comparison by Classification , 2025-2035
  • Figure 43: Eastern Europe Market Attractiveness Analysis by Classification
  • Figure 44: Eastern Europe Market Value Share and BPS Analysis by Application, 2025 and 2035
  • Figure 45: Eastern Europe Market Y to o to Y Growth Comparison by Application, 2025-2035
  • Figure 46: Eastern Europe Market Attractiveness Analysis by Application
  • Figure 47: East Asia Market Value Share and BPS Analysis by Country, 2025 and 2035
  • Figure 48: East Asia Market Value Share and BPS Analysis by Classification , 2025 and 2035
  • Figure 49: East Asia Market Y to o to Y Growth Comparison by Classification , 2025-2035
  • Figure 50: East Asia Market Attractiveness Analysis by Classification
  • Figure 51: East Asia Market Value Share and BPS Analysis by Application, 2025 and 2035
  • Figure 52: East Asia Market Y to o to Y Growth Comparison by Application, 2025-2035
  • Figure 53: East Asia Market Attractiveness Analysis by Application
  • Figure 54: South Asia and Pacific Market Value Share and BPS Analysis by Country, 2025 and 2035
  • Figure 55: South Asia and Pacific Market Value Share and BPS Analysis by Classification , 2025 and 2035
  • Figure 56: South Asia and Pacific Market Y to o to Y Growth Comparison by Classification , 2025-2035
  • Figure 57: South Asia and Pacific Market Attractiveness Analysis by Classification
  • Figure 58: South Asia and Pacific Market Value Share and BPS Analysis by Application, 2025 and 2035
  • Figure 59: South Asia and Pacific Market Y to o to Y Growth Comparison by Application, 2025-2035
  • Figure 60: South Asia and Pacific Market Attractiveness Analysis by Application
  • Figure 61: Middle East & Africa Market Value Share and BPS Analysis by Country, 2025 and 2035
  • Figure 62: Middle East & Africa Market Value Share and BPS Analysis by Classification , 2025 and 2035
  • Figure 63: Middle East & Africa Market Y to o to Y Growth Comparison by Classification , 2025-2035
  • Figure 64: Middle East & Africa Market Attractiveness Analysis by Classification
  • Figure 65: Middle East & Africa Market Value Share and BPS Analysis by Application, 2025 and 2035
  • Figure 66: Middle East & Africa Market Y to o to Y Growth Comparison by Application, 2025-2035
  • Figure 67: Middle East & Africa Market Attractiveness Analysis by Application
  • Figure 68: Global Market - Tier Structure Analysis
  • Figure 69: Global Market - Company Share Analysis

Frequently Asked Questions

How big is the fully automatic hydraulic lifting column market in 2025?

The global fully automatic hydraulic lifting column market is estimated to be valued at USD 146.7 million in 2025.

What will be the size of fully automatic hydraulic lifting column market in 2035?

The market size for the fully automatic hydraulic lifting column market is projected to reach USD 316.6 million by 2035.

How much will be the fully automatic hydraulic lifting column market growth between 2025 and 2035?

The fully automatic hydraulic lifting column market is expected to grow at a 8.0% CAGR between 2025 and 2035.

What are the key product types in the fully automatic hydraulic lifting column market?

The key product types in fully automatic hydraulic lifting column market are split type and integrated type.

Which application segment to contribute significant share in the fully automatic hydraulic lifting column market in 2025?

In terms of application, public safety segment to command 45.0% share in the fully automatic hydraulic lifting column market in 2025.

Explore Similar Insights

Future Market Insights

Fully Automatic Hydraulic Lifting Column Market

Chat With

MaRIA

Hi There, I am MaRIA, Your Market Research Intelligence Assistant. How may I help you?