

- Market Size (2026)
- USD 5.2 Bn
- Forecast (2036)
- USD 31.7 Bn
- CAGR (2026 to 2036)
- 19.8%
How big is the Generative Adversarial Networks Market in 2026?
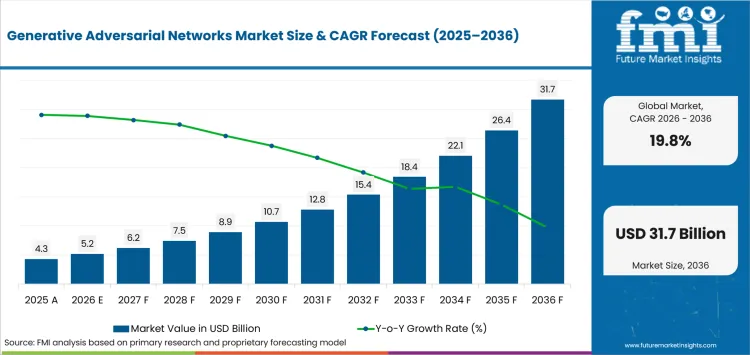
USD 5.2 billion in 2026 and USD 31.7 billion by 2036 at a 19.8% CAGR.
Sales in the generative adversarial networks market are projected to reach USD 31.7 billion by 2036, rising from USD 5.2 billion in 2026 at a CAGR of 19.8%. Industry expansion reflects broader enterprise adoption of artificial intelligence for content generation, data augmentation, model training, and simulation applications. OECD reported that 20.2% of firms used AI in 2025, indicating continued expansion of AI capabilities within business operations and creating a larger addressable market for generative technologies, including synthetic data generation.
The United States exhibits stronger commercial diffusion of enterprise AI solutions, while Japan places greater emphasis on centralized evaluation and testing frameworks for public-sector deployment. USA Census Bureau data released in May 2026 showed six-month business expectations for AI use ranging from 20% to 23%, reflecting continued interest in expanding AI implementation across organizations. This growing adoption outlook supports demand for cloud-based AI infrastructure and generative modeling platforms, whereas Japan's more centralized approach can result in a comparatively structured deployment pathway.
Key Takeaways of Generative Adversarial Networks Market
- Developers use controlled images and simulated conditions that physical collection cannot supply at acceptable cost.
- Software is projected at 73.0% in 2026 because model development and validation occur within software platforms.
- Cloud deployment is estimated at 68.0% in 2026 as variable training requires temporary accelerator capacity.
- Image generation is forecast at 33.0% in 2026 due to established synthesis, enhancement and translation workflows.
- Training instability and incomplete provenance records increase testing costs across regulated or customer-facing production workflows.
- NVIDIA Corporation, Microsoft Corporation, Google LLC, IBM Corporation, Amazon Web Services, Inc., Adobe Inc., Meta Platforms, Inc. and DataRobot, Inc. are some key players.
Analyst Perspective
"GAN suppliers earn recurring contracts by proving generated outputs remain varied and traceable within one production workflow. Platform comparisons center on failure diagnostics, source-data rights and repeatable retraining costs during vendor selection."
- Sudip saha, Principal Consultant, Future Market Insights
How is the Generative Adversarial Networks Market segmented?
The generative adversarial networks industry is segmented by component, deployment, application, end user, enterprise size and region.
Component coverage includes software, services and managed services across cloud, on-premise and edge deployment environments. Applications cover image, video, synthetic data and content creation across technology, media, healthcare, automotive and manufacturing organizations.
Why does software lead the component category?
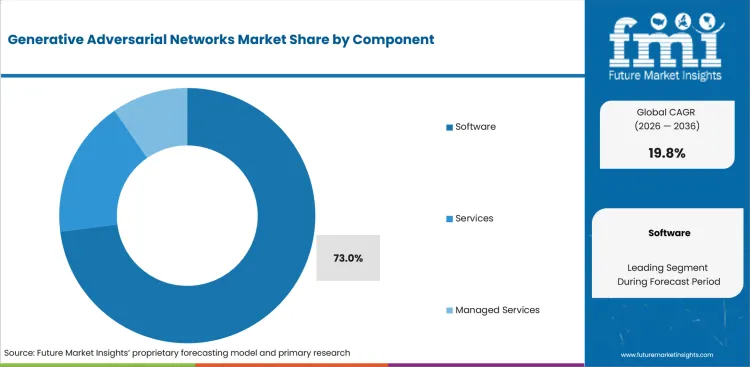
Software concentrates model construction, diagnostics and output evaluation inside one commercial layer for enterprise teams. Deep learning frameworks connect adversarial training with enterprise data pipelines and release controls that internal teams can evaluate consistently across recurring enterprise projects.
- Software is projected to hold 73.0% share in 2026 owing to demand for development platforms, diagnostics and synthetic-data tools.
- OECD reported in January 2026 that 57.3% of ICT firms used AI during 2025. The installed software base lowers access costs, but each GAN deployment requires stability tests plus provenance records and application-specific output review for production approval.
Why does cloud lead the deployment category?
Cloud deployment lets engineering teams compare accelerator runs without funding permanent capacity for every experiment. The United Kingdom reported in January 2026 that public research compute expanded from 2 to 21 exaFLOPS, improving access for cloud computing model tests for enterprises.
- By deployment, cloud is estimated to hold 68.0% in 2026 owing to variable training demand and managed accelerator access.
- Temporary clusters support memory-intensive runs and rapid capacity changes across project development stages for engineering teams. Cloud contracts must address data residency, transfer pricing and accelerator availability as proprietary records alter costs during training cycles.
Why does image generation lead the application category?
Image generation applies adversarial loss to synthesis, enhancement and translation across creative or technical workflows. Production teams compare visual consistency, source rights and approval rules before using generated assets for content creation or customer-facing applications at commercial scale.
- The image generation segment is likely to capture 33.0% share in 2026 attributable to established synthesis and translation workflows.
- Eurostat reported in December 2025 that 9.5% of EU enterprises used AI for pictures, video or audio. The measured adoption base supports commercial testing, but routine commercial distribution depends on provenance records and application review for generated visuals.
Why do IT and telecommunications lead end-user demand?
IT and telecommunications companies operate compute services, data pipelines and monitoring systems required for model development. Their AI platform operations support adversarial workloads used by enterprise teams across industries with service levels and access controls across customer accounts.
- The end-user category is forecast to be led by IT and telecommunications at 28.0% share in 2026 due to established cloud operations.
- In May 2026 the USA Census Bureau reported 39.7% AI use within the information sector. Platform operators convert that adoption base into contracts by assigning responsibility for model monitoring, output controls and recurring infrastructure support.
What are the drivers, restraints and opportunities in the Generative Adversarial Networks Market?
Scarce examples support adoption, unstable convergence limits production use and domain validation provides a practical commercial route.
- Driver: Engineering teams need rare examples that physical collection cannot reproduce at an acceptable cost.
- Restraint: Mode collapse and unstable convergence raise compute use as incomplete provenance records delay approval.
- Opportunity: Domain-specific systems serve defined imaging and simulation tasks with narrower validation and recurring support needs.
Digital twin technology teams generate rare operating states economically, and measured improvement determines commercial value within each evaluation task. Digital twin environments allow organizations to recreate infrequent equipment failures and extreme operating conditions that are difficult to observe in real-world settings, significantly reducing the cost and time required for data collection.
Generators can converge on narrow outputs and consume repeated cycles, but NIST requires provenance and detection controls for synthetic content. Generative models may suffer from output concentration, where repeated training cycles produce limited variations and fail to adequately represent the diversity present in real-world data.
Healthcare developers use synthetic clinical trial data in defined research tasks, yet commercial adoption requires separate technical and regulatory validation. Synthetic clinical trial datasets enable researchers to expand limited patient cohorts and accelerate analytical development while reducing exposure to sensitive health information
Which country CAGRs are profiled in the Generative Adversarial Networks Market?
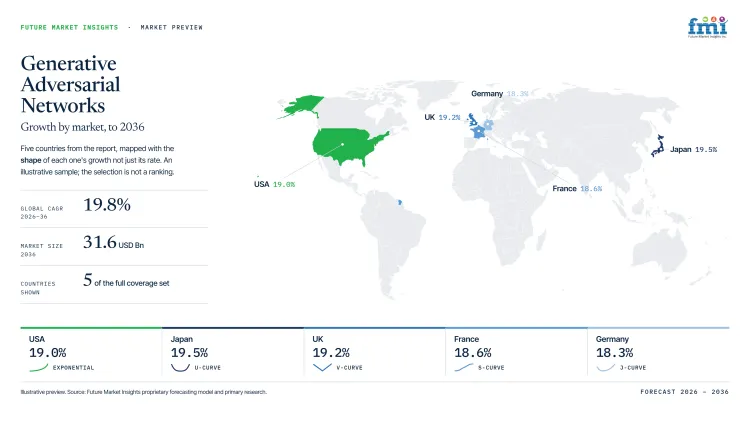
| Country | CAGR |
|---|---|
| Japan | 19.5% |
| United Kingdom | 19.2% |
| United States | 19.0% |
| France | 18.6% |
| Germany | 18.3% |
How do country-level CAGRs compare in the Generative Adversarial Networks Market?
The five CAGRs span 1.2 percentage points and describe forecast pace, not current market size.
- Japan combines centralized public deployment, domestic model testing and established technology service channels for qualification.
- The United Kingdom pairs expanding public compute with formal assurance requirements across sensitive commercial applications.
- The United States combines hyperscale infrastructure, broad enterprise use and fragmented governance expectations across industries.
- France coordinates compute and specialist training programs, although smaller providers face persistent hiring pressure nationwide.
- Germany links industrial simulation demand with planned compute expansion and demanding energy requirements for deployment.
Comparable CAGRs can produce different market entry conditions. The full report provides country-level CAGR analysis across North America, Latin America, Europe, East Asia, South Asia and Pacific, and the Middle East and Africa.
Country-wise Analysis
- Japan’s Digital Agency began testing three domestic foundation models on Sakura Cloud in July 2026 to compare usefulness, reliability and cost for future government procurement across ministries and research institutions before wider adoption. Adoption of generative adversarial networks in Japan is estimated to expand at 19.5% CAGR through 2036, supported by centralized purchasing plus domestic support for Japanese-language model evaluation across public and industrial workflows. Platform providers gain a defined qualification route, but undocumented synthetic outputs and demanding reliability thresholds can delay approval across manufacturing programs and participating government agencies nationwide that require local records and responsive technical support.
- United Kingdom developers use public compute and research networks that support visual generation, simulation and enterprise testing across universities and commercial technology clusters with established assurance teams and regional implementation partners serving enterprises. The United Kingdom’s generative adversarial networks outlook is anticipated to advance at 19.2% CAGR over the assessment period, aided by infrastructure access despite demanding controls for sensitive workloads across regulated commercial applications. In January 2026 the government reported completing 38 of 50 AI Opportunities Action Plan actions and establishing five AI Growth Zones, widening procurement routes as providers document security and recurring support for nationwide contracts.
- United States demand centers on hyperscale cloud platforms and specialized model teams serving information-intensive industries that fund repeated validation through distributed operations, national service groups and regulated compliance functions across several business units. The United States is estimated to post 19.0% CAGR over the forecast period, supported by enterprise adoption despite fragmented governance and costly application-specific validation for public-facing systems across major enterprise technology accounts nationwide. The Census Bureau reported in May 2026 that 37% of firms with at least 250 employees used AI, expanding the addressable base as providers prove data rights and output utility before recurring regional contracts.
- France combines national AI programs, research institutions and creative industries that support image generation and controlled synthetic-data development through coordinated education, compute initiatives and specialist commercial service networks in major cities and universities. In February 2025 the economy ministry reaffirmed annual training targets of 2,000 first-cycle students, 1,500 master’s students and 200 additional doctorates to expand specialist capacity across national programs and universities nationwide. Generative adversarial networks demand in France is forecast to rise at 18.6% CAGR over the forecast period, reinforced by training support despite hiring pressure and complex compliance requirements for commercial applications and deployments.
- Germany connects industrial automation and digital-twin applications with demand for controlled synthetic environments across manufacturing and mobility programs supported by regional engineering groups and established software channels serving export-oriented industrial production sites nationwide. Generative adversarial networks sales in Germany are forecast to expand at 18.3% CAGR by 2036, supported by industrial data depth despite energy costs and lengthy infrastructure approvals across regional enterprise computing projects nationwide. In March 2026 the federal government targeted doubled data-centre connection capacity and quadrupled high-performance or AI capacity by 2030, improving local training access as power prices and permitting schedules shape deployment economics and investment.
Who are the notable companies in the Generative Adversarial Networks Market?
NVIDIA Corporation, Microsoft Corporation, Google LLC, IBM Corporation, Amazon Web Services, Inc., Adobe Inc., Meta Platforms, Inc. and DataRobot, Inc. serve the market.
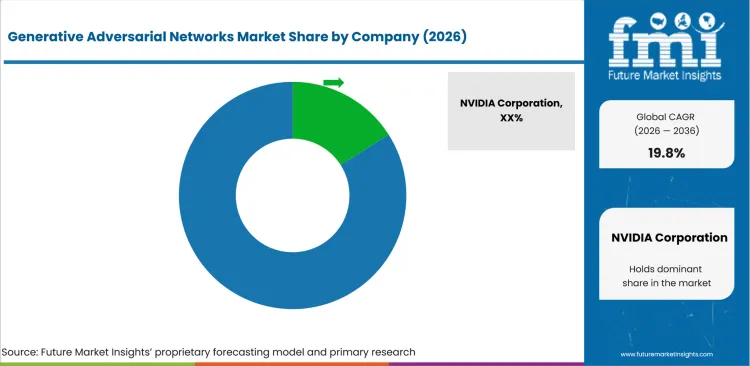
Competition remains fragmented across infrastructure and application providers as entry depends on output quality plus machine vision or AIOps platform systems.
- NVIDIA Corporation, Microsoft Corporation, Google LLC and IBM Corporation combine research, infrastructure and tooling for development.
- Amazon Web Services, Inc., Adobe Inc., Meta Platforms, Inc. and DataRobot, Inc. focus on managed training, visual workflows and governed evaluation.
Competitive Benchmarking: Generative Adversarial Networks Market
| Company | GAN Tooling | Training Capacity | Application Coverage | Geographic Reach |
|---|---|---|---|---|
| NVIDIA Corporation | High | High | High | Global |
| Microsoft Corporation | Medium | High | Medium | Global |
| Google LLC | Medium | High | Medium | Global |
| IBM Corporation | High | Medium | Medium | Global |
| Amazon Web Services, Inc. | Medium | High | High | Global |
| Adobe Inc. | Medium | Medium | High | Global |
| Meta Platforms, Inc. | Medium | High | High | Global |
| DataRobot, Inc. | Low | Medium | Medium | Global |
Key Developments in the Generative Adversarial Networks Market
- In November 2025, Amazon Web Services launched AWS Clean Rooms synthetic datasets for model training.
- In October 2025, Adobe documented synthetic-data pilots protecting content and improving document-model performance above 10%.
- In June 2025, NVIDIA released Cosmos Predict-2 and 40,000 clips for controlled driving scenarios.
Key Players in the Generative Adversarial Networks Market
AI Infrastructure and Model Tooling
- NVIDIA Corporation
- Microsoft Corporation
- Google LLC
- IBM Corporation
- Amazon Web Services, Inc.
Visual and Synthetic-Data Applications
- Adobe Inc.
- Meta Platforms, Inc.
- DataRobot, Inc.
Generative Adversarial Networks Market - Report Scope
| Coverage field | Report scope |
|---|---|
| Market breakdown | By component, deployment, application, end user, enterprise size and region. |
| Quantitative Units | Revenue in USD billion and CAGR in % |
| Market Definition | Software and services for developing, training and operating adversarial networks. |
| Regions Covered | North America, Latin America, Europe, East Asia, South Asia and Pacific, and Middle East and Africa. |
| Countries Covered | Japan, United Kingdom, United States, France, Germany, and 20+ countries included in the full report. |
| Key Companies Profiled | NVIDIA Corporation, Microsoft Corporation, Google LLC, IBM Corporation, Amazon Web Services, Inc., Adobe Inc., Meta Platforms, Inc. and DataRobot, Inc. |
| Forecast Period | 2026 to 2036. |
| Approach | Primary and secondary research with market triangulation. |
Generative Adversarial Networks Market - Research Methodology
| Method | Approach |
|---|---|
| Primary Research | FMI analysts gathered input from manufacturers, service providers, technology developers, distributors, end users, procurement teams, and subject-matter experts. Interviews examined purchasing decisions, product or service evaluation, adoption barriers, approval requirements, pricing considerations, and expectations for technical or commercial support. Respondents were also asked what evidence is required before a trial, pilot, or initial order develops into regular purchasing. |
| Desk Research | Desk research covered government statistics, regulatory publications, trade data, industry associations, technical literature, standards, company filings, product information, and official corporate announcements. Sources were reviewed for relevance, publication date, geographic coverage, and consistency with the defined market scope. Claims relating to performance, applications, approvals, capacity, investment, and commercial activity were retained only when supported by credible public evidence. |
| Market Sizing and Forecasting | The market model combined the baseline value with historical performance, segment structure, pricing and volume indicators, adoption levels, company participation, and country-level demand conditions. Forecast assumptions considered economic activity, investment trends, regulatory developments, technology adoption, purchasing cycles, supply availability, and barriers to wider market use. Segment and regional estimates were reconciled before the final market total was calculated. |
| Data Validation | Estimates were checked against multiple independent indicators, including public data, company activity, trade patterns, industry developments, and findings from primary interviews. Validation also tested whether products, services, applications, and company revenues fell within the defined market boundaries. Adjacent categories, unsupported claims, overlapping revenues, and activities without direct market relevance were excluded to reduce double counting and maintain consistency across segments and countries. |
Generative Adversarial Networks Market by Segments
Generative Adversarial Networks Market segmented by Component:
- Software
- GAN Development Platforms
- Model Training Frameworks
- Synthetic Data Generation Software
- Services
- Consulting Services
- Implementation & Integration
- AI Model Optimization Services
- Managed Services
- Model Monitoring
- AI Infrastructure Management
- Cloud AI Services
Generative Adversarial Networks Market segmented by Deployment:
- Cloud
- Public Cloud
- Private Cloud
- Hybrid Cloud
- On-premise
- Enterprise Data Centers
- GPU Clusters
- Private AI Infrastructure
- Edge Deployment
- Edge AI Devices
- Industrial Edge Systems
- Embedded AI Platforms
Generative Adversarial Networks Market segmented by Application:
- Image Generation
- Image Synthesis
- Image Enhancement
- Image-to-Image Translation
- Video Generation
- Deepfake Generation
- Video Enhancement
- Animation Generation
- Synthetic Data Generation
- Autonomous Vehicle Training Data
- Healthcare Imaging Data
- Financial Data Simulation
- Content Creation
- Digital Media Production
- Game Asset Generation
- Advertising Content Creation
Generative Adversarial Networks Market segmented by End User:
- IT & Telecommunications
- Cloud Service Providers
- Software Companies
- Telecommunication Operators
- Media & Entertainment
- Film Production
- Gaming Studios
- Digital Content Providers
- Healthcare
- Medical Imaging
- Drug Discovery
- Clinical Research
- Automotive & Manufacturing
- Autonomous Vehicles
- Industrial Automation
- Digital Twin Development
Generative Adversarial Networks Market segmented by Enterprise Size:
- Large Enterprises
- Global Enterprises
- Fortune 1000 Companies
- Public Sector Organizations
- Small & Medium Enterprises
- Mid-sized Businesses
- AI Startups
- Innovation-focused SMEs
Generative Adversarial Networks Market by Region:
- North America
- United States
- Canada
- Latin America
- Brazil
- Chile
- Mexico
- Rest of Latin America
- Western Europe
- Germany
- United Kingdom
- Italy
- Spain
- France
- Nordics
- Benelux
- Rest of Western Europe
- Eastern Europe
- Russia
- Poland
- Hungary
- Balkan and Baltic States
- Rest of Eastern Europe
- East Asia
- China
- Japan
- South Korea
- South Asia and Pacific
- India
- ASEAN
- Australia and New Zealand
- Rest of South Asia and Pacific
- Middle East and Africa
- Kingdom of Saudi Arabia
- Other GCC Countries
- Türkiye
- South Africa
- Other African Union Countries
- Rest of Middle East and Africa
Research Sources and Bibliography
- OECD. (2026, January 28). AI use by individuals surges across the OECD as adoption by firms continues to expand.
- Digital Agency, Government of Japan. (2026, July 10). Government AI GENAI starts trial use of Domestic Foundation Models on a Domestic Cloud Platform.
- Department for Science, Innovation and Technology. (2026, January 29). AI Opportunities Action Plan: One Year On.
- USA Census Bureau. (2026, May 26). Large Firms With at Least 20 Employees Biggest AI Users.
- Eurostat. (2025, December 11). 20% of EU enterprises use AI technologies.
- NIST. (2024, November 20). Reducing Risks Posed by Synthetic Content An Overview of Technical Approaches to Digital Content Transparency.
- Ministry of Economy, Finance and Industrial and Digital Sovereignty. (2025, February 7). La stratégie nationale pour l’intelligence artificielle.
- German Federal Government. (2026, March 18). Mehr Rechenpower für Deutschland.
- Amazon Web Services. (2025, November 30). AWS Clean Rooms supports synthetic dataset generation training custom ML training.
- Adobe. (2025, October 28). Adobe leverages synthetic data to deliver document intelligence at scale with NVIDIA.
- NVIDIA. (2025, June 11). NVIDIA Releases New AI Models and Developer Tools to Advance Autonomous Vehicle Ecosystem.
This bibliography is provided for reader reference and is not exhaustive. The full report contains the complete reference list and detailed citations.
This Report Answers
- What defines the forecast outlook for the global Generative Adversarial Networks (GANs) market through 2036?
- What factors are supporting the adoption of GAN technologies across industries and use cases?
- Which component segment holds the largest share of the GANs market?
- How are GAN deployments managed and controlled across cloud, on-premise, and hybrid environments?
- Which application segment accounts for the largest share of market demand?
- How do market growth rates and adoption trends compare across key countries and regions?
- Which leading companies are participating in the global Generative Adversarial Networks market?
- What technical, regulatory, data privacy, and implementation challenges restrict GAN deployment?
Frequently Asked Questions
How big is the Generative Adversarial Networks Market in 2026?
In 2026, the Generative Adversarial Networks Market is valued at USD 5.2 billion across software, services and managed platforms. Commercial use depends on repeatable training and documented output quality across image generation, simulation and synthetic-data workflows under defined governance controls.
What is the CAGR of the Generative Adversarial Networks Market from 2026 to 2036?
The Generative Adversarial Networks Market is projected to expand at 19.8% CAGR from 2026 to 2036 and reach USD 31.7 billion. Forecast performance depends on scalable compute access, application validation and provenance controls across regulated or customer-facing production workloads globally.
Which component is projected to account for 73.0% of the Generative Adversarial Networks Market?
Software is projected to account for 73.0% of the Generative Adversarial Networks Market by component in 2026. Development platforms concentrate model construction, diagnostics and integration work required for reliable applications across cloud, on-premise and edge deployment environments for enterprise teams.
How much value is the Generative Adversarial Networks Market expected to add between 2026 and 2036?
USD 26.5 billion is expected to be added to the Generative Adversarial Networks Market between 2026 and 2036. Realization depends on wider production use, but compute economics, unstable convergence and governance duties restrict recurring software and service spending across industries.
Which companies are active in the Generative Adversarial Networks Market?
Companies active in the Generative Adversarial Networks Market include NVIDIA Corporation, Microsoft Corporation, Google LLC and IBM Corporation. Amazon Web Services, Inc., Adobe Inc., Meta Platforms, Inc. and DataRobot, Inc. extend coverage across infrastructure, visual applications and governed synthetic-data operations.
Preview the report firsthand - request a free sample
Get SampleGet the brochure for pricing and purchase details.
Get PDFTable of Content
- Key Takeaways
- Market Size and CAGR
- Top Growth Driver
- Fastest Growing Segment
- Leading Region
- Key Companies
- Emerging Opportunities
- Executive Summary
- Global Market Outlook
- Demand-side Trends
- Supply-side Trends
- Technology Roadmap Analysis
- Analysis and Recommendations
- Analyst Perspective (What is happening? Why now? What should investors know?)
- Key Questions Answered
- How large is the market?
- What is the CAGR?
- What are key trends?
- Which region dominates?
- Who are the leaders?
- Market Overview
- Market Coverage / Taxonomy
- Market Definition / Scope / Limitations
- Research Methodology
- Chapter Orientation
- Analytical Lens and Working Hypotheses
- Market Structure, Signals, and Trend Drivers
- Benchmarking and Cross-market Comparability
- Market Sizing, Forecasting, and Opportunity Mapping
- Research Design and Evidence Framework
- Desk Research Programme (Secondary Evidence)
- Expert Input and Fieldwork (Primary Evidence)
- Tooling, Models, and Reference Databases
- Data Engineering and Model Build
- Quality Assurance and Audit Trail
- Market Background
- Market Dynamics (Drivers, Restraints, Opportunity, Trends)
- Scenario Forecast (Optimistic, Likely, Conservative)
- Impact Analysis
- AI Impact
- Sustainability Impact
- Regulatory Impact
- Technology Impact
- Consumer / Buyer Analysis
- Purchase Drivers
- Adoption Barriers
- Buyer Journey
- Opportunity Map Analysis
- Product Life Cycle Analysis
- Supply Chain Analysis
- Investment Feasibility Matrix
- Value Chain Analysis
- PESTLE and Porter's Analysis
- Regulatory Landscape
- Regional Parent Market Outlook
- Production and Consumption Statistics
- Import and Export Statistics
- Global Market Analysis and Forecast, 2021 to 2036
- Historical Market Size Value (USD Billion) Analysis, 2021 to 2025
- Current and Future Market Size Value (USD Billion) Projections, 2026 to 2036
- Y-o-Y Growth Trend Analysis
- Absolute $ Opportunity Analysis
- Global Market Pricing Analysis, 2021 to 2036
- Global Market Analysis and Forecast, By Component, 2021 to 2036
- Introduction / Key Findings
- Historical Market Size Value (USD Billion) Analysis By Component, 2021 to 2025
- Current and Future Market Size Value (USD Billion) Analysis and Forecast By Component, 2026 to 2036
- Software
- GAN Development Platforms
- Model Training Frameworks
- Synthetic Data Generation Software
- Services
- Consulting Services
- Implementation & Integration
- AI Model Optimization Services
- Managed Services
- Model Monitoring
- AI Infrastructure Management
- Cloud AI Services
- Software
- Y-o-Y Growth Trend Analysis By Component, 2021 to 2025
- Absolute $ Opportunity Analysis By Component, 2026 to 2036
- Global Market Analysis and Forecast, By Deployment, 2021 to 2036
- Introduction / Key Findings
- Historical Market Size Value (USD Billion) Analysis By Deployment, 2021 to 2025
- Current and Future Market Size Value (USD Billion) Analysis and Forecast By Deployment, 2026 to 2036
- Cloud
- Public Cloud
- Private Cloud
- Hybrid Cloud
- On-premise
- Enterprise Data Centers
- GPU Clusters
- Private AI Infrastructure
- Edge Deployment
- Edge AI Devices
- Industrial Edge Systems
- Embedded AI Platforms
- Cloud
- Y-o-Y Growth Trend Analysis By Deployment, 2021 to 2025
- Absolute $ Opportunity Analysis By Deployment, 2026 to 2036
- Global Market Analysis and Forecast, By Application, 2021 to 2036
- Introduction / Key Findings
- Historical Market Size Value (USD Billion) Analysis By Application, 2021 to 2025
- Current and Future Market Size Value (USD Billion) Analysis and Forecast By Application, 2026 to 2036
- Image Generation
- Image Synthesis
- Image Enhancement
- Image-to-Image Translation
- Video Generation
- Deepfake Generation
- Video Enhancement
- Animation Generation
- Synthetic Data Generation
- Autonomous Vehicle Training Data
- Healthcare Imaging Data
- Financial Data Simulation
- Content Creation
- Digital Media Production
- Game Asset Generation
- Advertising Content Creation
- Image Generation
- Y-o-Y Growth Trend Analysis By Application, 2021 to 2025
- Absolute $ Opportunity Analysis By Application, 2026 to 2036
- Global Market Analysis and Forecast, By End User, 2021 to 2036
- Introduction / Key Findings
- Historical Market Size Value (USD Billion) Analysis By End User, 2021 to 2025
- Current and Future Market Size Value (USD Billion) Analysis and Forecast By End User, 2026 to 2036
- IT & Telecommunications
- Cloud Service Providers
- Software Companies
- Telecommunication Operators
- Media & Entertainment
- Film Production
- Gaming Studios
- Digital Content Providers
- Healthcare
- Medical Imaging
- Drug Discovery
- Clinical Research
- Automotive & Manufacturing
- Autonomous Vehicles
- Industrial Automation
- Digital Twin Development
- IT & Telecommunications
- Y-o-Y Growth Trend Analysis By End User, 2021 to 2025
- Absolute $ Opportunity Analysis By End User, 2026 to 2036
- Global Market Analysis and Forecast, By Enterprise Size, 2021 to 2036
- Introduction / Key Findings
- Historical Market Size Value (USD Billion) Analysis By Enterprise Size, 2021 to 2025
- Current and Future Market Size Value (USD Billion) Analysis and Forecast By Enterprise Size, 2026 to 2036
- Large Enterprises
- Global Enterprises
- Fortune 1000 Companies
- Public Sector Organizations
- Small & Medium Enterprises
- Mid-sized Businesses
- AI Startups
- Innovation-focused SMEs
- Large Enterprises
- Y-o-Y Growth Trend Analysis By Enterprise Size, 2021 to 2025
- Absolute $ Opportunity Analysis By Enterprise Size, 2026 to 2036
- Global Market Analysis and Forecast, By Region, 2021 to 2036
- Introduction
- Historical Market Size Value (USD Billion) Analysis By Region, 2021 to 2025
- Current Market Size Value (USD Billion) Analysis and Forecast By Region, 2026 to 2036
- North America
- Latin America
- Western Europe
- Eastern Europe
- East Asia
- South Asia and Pacific
- Middle East & Africa
- Market Attractiveness Analysis By Region
- North America Market Analysis and Forecast, By Country, 2021 to 2036
- Historical Market Size Value (USD Billion) Trend Analysis By Market Taxonomy, 2021 to 2025
- Market Size Value (USD Billion) Forecast By Market Taxonomy, 2026 to 2036
- By Country
- USA
- Canada
- By Component
- By Deployment
- By Application
- By End User
- By Enterprise Size
- By Country
- Market Attractiveness Analysis
- By Country
- By Component
- By Deployment
- By Application
- By End User
- By Enterprise Size
- Key Takeaways
- Latin America Market Analysis and Forecast, By Country
- Historical Market Size Value (USD Billion) Trend Analysis By Market Taxonomy, 2021 to 2025
- Market Size Value (USD Billion) Forecast By Market Taxonomy, 2026 to 2036
- By Country
- Brazil
- Mexico
- Chile
- Rest of Latin America
- By Component
- By Deployment
- By Application
- By End User
- By Enterprise Size
- By Country
- Market Attractiveness Analysis
- By Country
- By Component
- By Deployment
- By Application
- By End User
- By Enterprise Size
- Key Takeaways
- Western Europe Market Analysis and Forecast, By Country
- Historical Market Size Value (USD Billion) Trend Analysis By Market Taxonomy, 2021 to 2025
- Market Size Value (USD Billion) Forecast By Market Taxonomy, 2026 to 2036
- By Country
- Germany
- UK
- Italy
- Spain
- France
- Nordic
- BENELUX
- Rest of Western Europe
- By Component
- By Deployment
- By Application
- By End User
- By Enterprise Size
- By Country
- Market Attractiveness Analysis
- By Country
- By Component
- By Deployment
- By Application
- By End User
- By Enterprise Size
- Key Takeaways
- Eastern Europe Market Analysis and Forecast, By Country
- Historical Market Size Value (USD Billion) Trend Analysis By Market Taxonomy, 2021 to 2025
- Market Size Value (USD Billion) Forecast By Market Taxonomy, 2026 to 2036
- By Country
- Russia
- Poland
- Hungary
- Balkan & Baltic
- Rest of Eastern Europe
- By Component
- By Deployment
- By Application
- By End User
- By Enterprise Size
- By Country
- Market Attractiveness Analysis
- By Country
- By Component
- By Deployment
- By Application
- By End User
- By Enterprise Size
- Key Takeaways
- East Asia Market Analysis and Forecast, By Country
- Historical Market Size Value (USD Billion) Trend Analysis By Market Taxonomy, 2021 to 2025
- Market Size Value (USD Billion) Forecast By Market Taxonomy, 2026 to 2036
- By Country
- China
- Japan
- South Korea
- By Component
- By Deployment
- By Application
- By End User
- By Enterprise Size
- By Country
- Market Attractiveness Analysis
- By Country
- By Component
- By Deployment
- By Application
- By End User
- By Enterprise Size
- Key Takeaways
- South Asia and Pacific Market Analysis and Forecast, By Country
- Historical Market Size Value (USD Billion) Trend Analysis By Market Taxonomy, 2021 to 2025
- Market Size Value (USD Billion) Forecast By Market Taxonomy, 2026 to 2036
- By Country
- India
- ASEAN
- Australia & New Zealand
- Rest of South Asia and Pacific
- By Component
- By Deployment
- By Application
- By End User
- By Enterprise Size
- By Country
- Market Attractiveness Analysis
- By Country
- By Component
- By Deployment
- By Application
- By End User
- By Enterprise Size
- Key Takeaways
- Middle East & Africa Market Analysis and Forecast, By Country
- Historical Market Size Value (USD Billion) Trend Analysis By Market Taxonomy, 2021 to 2025
- Market Size Value (USD Billion) Forecast By Market Taxonomy, 2026 to 2036
- By Country
- Kingdom of Saudi Arabia
- Other GCC Countries
- Türkiye
- South Africa
- Other African Union
- Rest of Middle East & Africa
- By Component
- By Deployment
- By Application
- By End User
- By Enterprise Size
- By Country
- Market Attractiveness Analysis
- By Country
- By Component
- By Deployment
- By Application
- By End User
- By Enterprise Size
- Key Takeaways
- Key Countries Market Analysis
- USA
- Pricing Analysis
- Market Share Analysis, 2025
- By Component
- By Deployment
- By Application
- By End User
- By Enterprise Size
- Canada
- Pricing Analysis
- Market Share Analysis, 2025
- By Component
- By Deployment
- By Application
- By End User
- By Enterprise Size
- Mexico
- Pricing Analysis
- Market Share Analysis, 2025
- By Component
- By Deployment
- By Application
- By End User
- By Enterprise Size
- Brazil
- Pricing Analysis
- Market Share Analysis, 2025
- By Component
- By Deployment
- By Application
- By End User
- By Enterprise Size
- Chile
- Pricing Analysis
- Market Share Analysis, 2025
- By Component
- By Deployment
- By Application
- By End User
- By Enterprise Size
- Germany
- Pricing Analysis
- Market Share Analysis, 2025
- By Component
- By Deployment
- By Application
- By End User
- By Enterprise Size
- UK
- Pricing Analysis
- Market Share Analysis, 2025
- By Component
- By Deployment
- By Application
- By End User
- By Enterprise Size
- Italy
- Pricing Analysis
- Market Share Analysis, 2025
- By Component
- By Deployment
- By Application
- By End User
- By Enterprise Size
- Spain
- Pricing Analysis
- Market Share Analysis, 2025
- By Component
- By Deployment
- By Application
- By End User
- By Enterprise Size
- France
- Pricing Analysis
- Market Share Analysis, 2025
- By Component
- By Deployment
- By Application
- By End User
- By Enterprise Size
- India
- Pricing Analysis
- Market Share Analysis, 2025
- By Component
- By Deployment
- By Application
- By End User
- By Enterprise Size
- ASEAN
- Pricing Analysis
- Market Share Analysis, 2025
- By Component
- By Deployment
- By Application
- By End User
- By Enterprise Size
- Australia & New Zealand
- Pricing Analysis
- Market Share Analysis, 2025
- By Component
- By Deployment
- By Application
- By End User
- By Enterprise Size
- China
- Pricing Analysis
- Market Share Analysis, 2025
- By Component
- By Deployment
- By Application
- By End User
- By Enterprise Size
- Japan
- Pricing Analysis
- Market Share Analysis, 2025
- By Component
- By Deployment
- By Application
- By End User
- By Enterprise Size
- South Korea
- Pricing Analysis
- Market Share Analysis, 2025
- By Component
- By Deployment
- By Application
- By End User
- By Enterprise Size
- Russia
- Pricing Analysis
- Market Share Analysis, 2025
- By Component
- By Deployment
- By Application
- By End User
- By Enterprise Size
- Poland
- Pricing Analysis
- Market Share Analysis, 2025
- By Component
- By Deployment
- By Application
- By End User
- By Enterprise Size
- Hungary
- Pricing Analysis
- Market Share Analysis, 2025
- By Component
- By Deployment
- By Application
- By End User
- By Enterprise Size
- Kingdom of Saudi Arabia
- Pricing Analysis
- Market Share Analysis, 2025
- By Component
- By Deployment
- By Application
- By End User
- By Enterprise Size
- Türkiye
- Pricing Analysis
- Market Share Analysis, 2025
- By Component
- By Deployment
- By Application
- By End User
- By Enterprise Size
- South Africa
- Pricing Analysis
- Market Share Analysis, 2025
- By Component
- By Deployment
- By Application
- By End User
- By Enterprise Size
- USA
- Market Structure Analysis
- Competition Dashboard
- Competition Benchmarking
- Market Share Analysis of Top Players
- By Regional
- By Component
- By Deployment
- By Application
- By End User
- By Enterprise Size
- Emerging Startups
- Innovation Benchmarking
- Competition Analysis
- Competition Deep Dive
- NVIDIA Corporation
- Overview
- Product Portfolio
- Profitability by Market Segments
- Sales Footprint
- Strategy Overview
- Marketing Strategy
- Product Strategy
- Channel Strategy
- Microsoft Corporation
- Google LLC
- IBM Corporation
- Amazon Web Services, Inc.
- Adobe Inc.
- OpenAI
- Meta Platforms, Inc.
- DataRobot, Inc.
- H2O.ai
- NVIDIA Corporation
- Case Studies
- Success Stories
- Recent Developments
- Competition Deep Dive
- Assumptions & Acronyms Used


