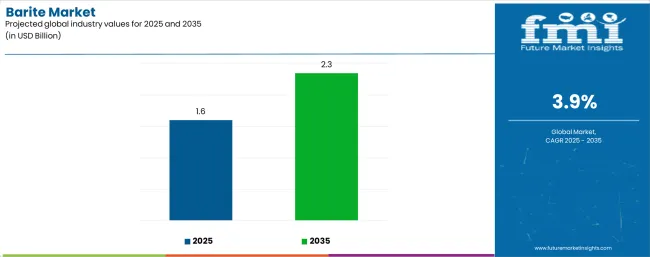
The global barite market is forecasted to reach USD 2.3 billion by 2035, recording an absolute increase of USD 0.8 billion over the forecast period. The market is valued at USD 1.6 billion in 2025 and is projected to grow at a CAGR of 3.9% during the forecast period. The overall market size is expected to grow by 1.5 times during the same period, driven by increasing demand for drilling fluid weighting agents worldwide. This demand is supported by the need for efficient high-density mineral solutions and rising investments in oil and gas exploration, healthcare infrastructure, and industrial applications globally. The environmental regulations regarding mining operations and competition from synthetic weighting agents may pose challenges to market expansion.
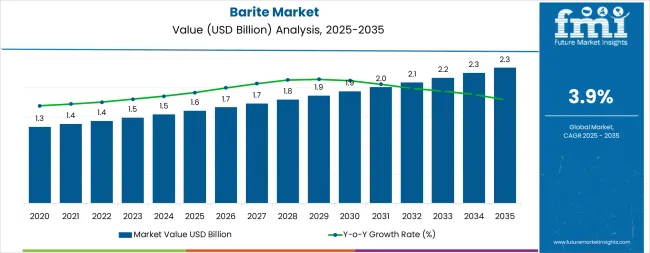
Between 2025 and 2030, the market is projected to expand from USD 1.6 billion to USD 1.9 billion, resulting in a value increase of USD 0.3 billion, which represents 37.5% of the total forecast growth for the decade. This phase of development will be shaped by rising demand for oil and gas exploration activities, product innovation in high-purity grades and specialized formulations, as well as expanding integration with offshore drilling programs and healthcare infrastructure development. Companies are establishing competitive positions through investment in API-grade production capabilities, strategic mine development in proven reserves, and market expansion across drilling fluids, radiation shielding, and industrial filler applications.
From 2030 to 2035, the market is forecast to grow from USD 1.9 billion to USD 2.3 billion, adding another USD 0.5 billion, which constitutes 62.5% of the overall ten-year expansion. This period is expected to be characterized by the expansion of specialized barite systems, including advanced micronized grades and integrated weighting agent solutions tailored for specific density requirements, strategic collaborations between mining companies and oilfield service providers, and an enhanced focus on green mining practices and environmental compliance. The growing focus on deepwater exploration and healthcare imaging facility construction will drive demand for high-specific-gravity barite solutions across diverse industrial applications.
| Metric | Value |
|---|---|
| Market Value (2025) | USD 1.6 billion |
| Market Forecast Value (2035) | USD 2.3 billion |
| Forecast CAGR (2025 to 2035) | 3.9% |
The barite market grows by enabling oil and gas operators to achieve optimal drilling fluid density and pressure control in well construction operations, ranging from shallow onshore wells to ultra-deepwater offshore projects. Drilling contractors face mounting technical requirements to manage formation pressures and prevent wellbore instability, with barite-weighted drilling fluids typically achieving specific gravities of 4.1-4.3 compared to 1.0 for water, making barite essential for safe and efficient well construction across all hydrocarbon basins. The oil and gas industry's continued development of challenging reservoirs including deepwater offshore fields, high-pressure formations, and extended-reach horizontal wells creates constant demand for API-grade barite that meets stringent specifications for particle size distribution, specific gravity, and contaminant levels.
Healthcare infrastructure expansion drives growing adoption of barite-based radiation shielding concretes and mortars in hospital construction and imaging facility upgrades, where barium sulfate's high atomic number provides effective X-ray and gamma ray attenuation at lower wall thickness compared to conventional materials. Industrial manufacturing sectors including paints and coatings, plastics and rubber, and specialty chemicals utilize barite as a functional filler providing density, whiteness, and chemical inertness in diverse applications. The environmental permitting challenges for new mine development and increasing scrutiny of mining practices in ecologically sensitive areas may limit supply expansion rates, while synthetic alternatives including hematite and ilmenite create competitive pressure in specific drilling applications.
The market is segmented by application, form, grade, and region. By application, the market is divided into drilling mud, pharmaceuticals, rubbers & plastics, paints & coatings, textiles, and other applications. Based on form, the market is categorized into lumps and powder. By grade based on specific gravity, the market is segmented into SP 4.2, SP 4.1, SP 4.0, SP 3.9, and ≥4.3 specialty grades. Regionally, the market is divided into North America, Latin America, Western Europe, Eastern Europe, South Asia & Pacific, East Asia, and Middle East & Africa.
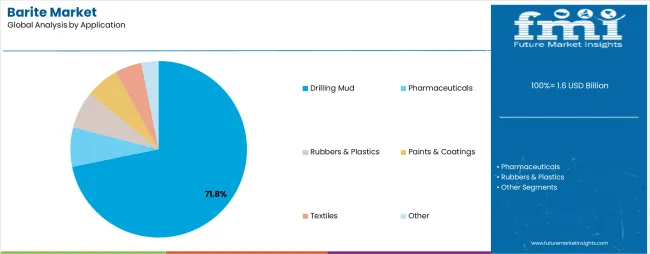
The drilling mud segment represents the dominant force in the market, capturing approximately 71.8% of total market share in 2025. This critical application category encompasses barite used as a weighting agent in water-based and oil-based drilling fluids, including offshore oil platforms, onshore conventional wells, shale and horizontal drilling operations, and geothermal energy projects. The drilling mud segment's market leadership stems from barite's unique combination of high specific gravity, chemical inertness, and low abrasiveness that enables effective wellbore pressure control while minimizing formation damage and equipment wear during drilling operations.
Within the drilling mud application segment, offshore oil drilling accounts for 36.0% share, serving deepwater and ultra-deepwater projects requiring high-density muds for pressure control and wellbore stability. Onshore conventional drilling represents 34.0% share through vertical well construction in established oil and gas basins. Shale and horizontal well drilling captures 24.0% share in unconventional resource development including hydraulic fracturing operations. Geothermal drilling and other specialized applications account for 6.0% of the drilling mud segment.
Key technological advantages driving the drilling mud segment include:
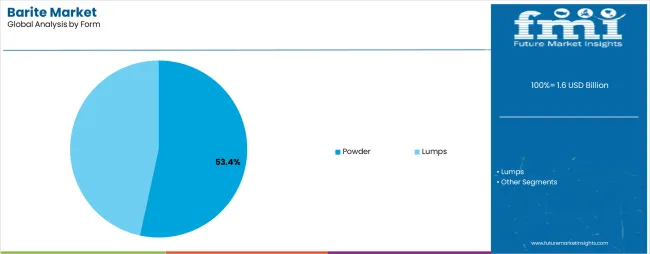
Powder form dominates the barite market with approximately 53.4% market share in 2025, reflecting the processing requirements for drilling fluid applications and specialty industrial uses demanding controlled particle size distributions. The powder segment's market leadership is supported by API specifications requiring barite drilling grade to pass through 200 mesh screens with at least 97% of material finer than 74 microns, necessitating crushing and grinding operations that convert run-of-mine barite into usable powder form.
Within the powder segment, API-grade powder suitable for drilling fluids accounts for 58.0% share, meeting American Petroleum Institute specifications for specific gravity, particle size, residue content, and soluble alkaline earth metals. Precipitated barium sulfate and industrial fillers represent 21.0% share through synthetic blanc fixe production and specialty filler applications in plastics, rubber, and coatings. Micronized medical and paint grades capture 15.0% share in pharmaceutical contrast media, radiation shielding concretes, and premium coating formulations. Specialty radiation-shield concrete mixes account for 6.0% of the powder segment.
The lumps segment maintains substantial market presence with approximately 46.6% share, serving customers with in-house milling capabilities or applications where coarse material is preferred, including certain concrete aggregate uses and blast furnace slag conditioning.
Key factors driving powder segment dominance include:
The market is driven by three concrete demand factors tied to oil and gas activity and industrial development. First, offshore oil and gas exploration and production expansion in deepwater basins create increasing demand for high-quality API-grade barite, with global offshore drilling rig counts projected to increase 8-12% annually in key regions including the Gulf of Mexico, North Sea, Brazil pre-salt, and West Africa, requiring reliable supplies of barite meeting stringent density and purity specifications for safe wellbore construction. Second, healthcare infrastructure development including hospital construction and medical imaging facility upgrades drives growing adoption of barite-based radiation shielding concrete and mortar systems, with healthcare capital expenditure in major markets supporting 5-7% annual growth in radiology room construction requiring barium sulfate shielding materials. Third, industrial manufacturing expansion in plastics, rubber, paints, and coatings sectors creates steady demand for barite as a functional filler providing density, opacity, and chemical resistance, with emerging market industrialization driving 4-6% annual growth in industrial barite consumption.
Market restraints include environmental permitting challenges and social license requirements that can delay or prevent new mine development, particularly in regions with indigenous land claims, protected habitats, or water resource concerns that complicate project approval processes and increase development costs. Supply concentration risks create vulnerability to disruptions, as major producing countries including India, China, Morocco, and Kazakhstan account for over 60% of global production, exposing buyers to geopolitical risks, export restrictions, and logistics challenges that can impact price stability and availability. Technical substitution by alternative weighting agents including hematite, ilmenite, and calcium carbonate-based systems poses competitive pressure in specific drilling applications, particularly where environmental regulations favor lower-toxicity alternatives or where cost optimization drives evaluation of substitute materials.
Key trends indicate accelerating demand for ultra-high-purity barite grades with <0.05% iron content for specialty applications including electronics, ceramics, and pharmaceutical uses where conventional mining-grade material fails to meet stringent contamination limits. Development of barite recycling and reclamation technologies for drilling waste management enables recovery of unused barite from drilling cuttings and spent fluids, reducing fresh barite consumption while addressing environmental concerns about drilling waste disposal. Growing focus on green mining practices including progressive reclamation, water management, and community engagement drives industry adoption of responsible sourcing certifications and third-party auditing programs. The market thesis could face disruption if energy transition accelerates beyond current projections, significantly reducing oil and gas drilling activity globally, or if breakthrough drilling fluid technologies eliminate the need for mineral weighting agents through alternative density control mechanisms.
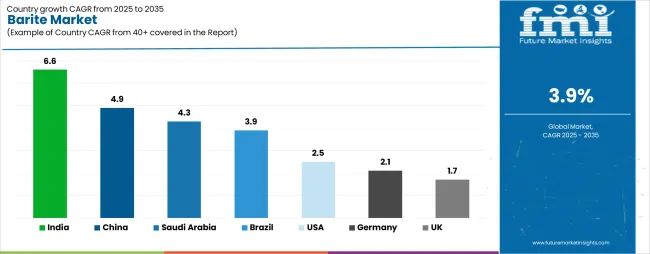
| Country | CAGR (2025-2035) |
|---|---|
| India | 6.6% |
| China | 4.9% |
| Saudi Arabia | 4.3% |
| Brazil | 3.9% |
| USA | 2.5% |
| Germany | 2.1% |
| UK | 1.7% |
The market is projected to record moderate growth between 2025 and 2035, driven by its essential role in oil and gas drilling operations, chemical production, and medical imaging applications. India is expected to lead with a CAGR of 6.6%, supported by increased exploration activities and expanding drilling operations in onshore and offshore sectors. China follows at 4.9%, driven by industrial applications and steady oilfield consumption. Saudi Arabia is projected to grow at 4.3%, benefiting from ongoing upstream development projects and demand for weighting agents in drilling fluids. Brazil records a 3.9% CAGR, backed by expanding energy infrastructure. The United States grows at 2.5%, showing mature market behavior with stable industrial use. Germany and the United Kingdom register slower growth at 2.1% and 1.7%, respectively, reflecting limited domestic exploration but consistent reliance on imports for high-purity barite used in medical and chemical industries.
The report covers an in-depth analysis of 40+ countries, top-performing countries are highlighted below.
India demonstrates the strongest growth potential in the market with a CAGR of 6.6% through 2035. The country's leadership position stems from the world-class Mangampeta barite mining district in Andhra Pradesh providing API-grade material to global oilfield service companies, rising domestic oil and gas exploration supporting energy security objectives, and expanding industrial consumption in plastics, rubber, and paint manufacturing sectors. Growth is concentrated in major producing and consuming regions, including Andhra Pradesh for mining and export operations, Gujarat and Maharashtra for industrial applications, and emerging hydrocarbon basins for drilling activity. Distribution channels through established mineral trading companies and direct supply agreements with oilfield service providers expand deployment across drilling fluid markets and industrial end-users. The country's strategic mineral development policies and healthcare infrastructure expansion provide policy support for ecofriendly barite extraction and value-added processing.
Key market factors:
In major producing provinces including Guizhou, Guangxi, Shaanxi, and Hunan, barite mining and processing operations serve both domestic drilling activity and international export markets, driven by onshore oil and gas development and established milling infrastructure. The market demonstrates strong growth momentum with a CAGR of 4.9% through 2035, linked to energy security policies supporting domestic hydrocarbon production and industrial demand from plastics, coatings, and rubber sectors consuming barite as functional fillers. Chinese producers are implementing advanced processing technologies and quality control systems to meet API specifications while serving growing domestic drilling programs in Xinjiang, Sichuan, and offshore basins. The country's integrated supply chains and logistics capabilities position it as a reliable supplier to Asian drilling markets while supporting domestic industrial consumption.
Key market characteristics:
Saudi Arabia's barite market demonstrates robust expansion driven by sustained drilling programs supporting hydrocarbon production capacity maintenance and expansion, rig count additions aligned with Vision 2030 energy sector development targets, and strategic initiatives to localize oilfield services supply chains. The country shows solid growth potential with a CAGR of 4.3% through 2035, driven by Saudi Aramco's capital expenditure programs and national oilfield services company development supporting domestic drilling activity. Saudi operators are increasingly sourcing barite through local supply arrangements and regional imports, reducing dependence on distant suppliers while ensuring reliable material availability for drilling campaigns. Growing focus on local content requirements and supply chain resilience creates opportunities for regional barite producers and processing operations.
Key development areas:
Brazil's market expansion is driven by pre-salt offshore drilling activity in Santos and Campos basins requiring high-density drilling fluids for deep and ultra-deepwater well construction, civil infrastructure development consuming barite in specialty concretes, and industrial coatings demand in agricultural and industrial sectors. The country demonstrates solid growth potential with a CAGR of 3.9% through 2035, supported by Petrobras capital expenditure programs and expanding participation of international oil companies in Brazilian basins. Brazilian operators face logistics challenges related to coastal infrastructure and import dependencies but are developing domestic processing capabilities and regional supply relationships. Growing offshore production capacity and infrastructure investment create steady demand for API-grade barite meeting rigorous quality specifications.
Market characteristics:
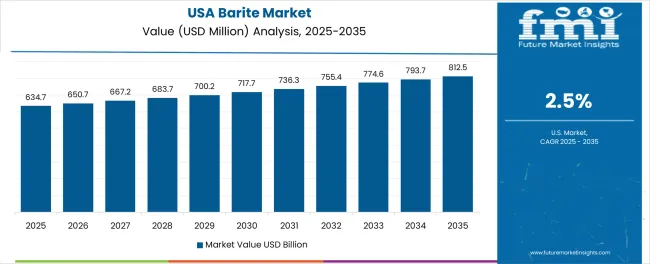
The United States market demonstrates moderate growth through shale refracturing and workover operations supporting production maintenance in established basins, hospital and radiology facility renovations requiring radiation shielding materials, and niche barium chemical applications. The country shows steady growth potential with a CAGR of 2.5% through 2035, driven by ongoing drilling activity in the Permian Basin, Eagle Ford, and other shale plays combined with healthcare infrastructure upgrades and specialty industrial applications. American operators are optimizing drilling fluid systems and implementing cost reduction measures that influence barite consumption patterns, while healthcare construction projects incorporate advanced radiation shielding designs. The market benefits from established supply chains including Gulf Coast import infrastructure and Nevada production supporting reliable material availability.
Leading market segments:
Germany's market demonstrates focus on high-purity barite for specialty applications including chemicals, coatings, and medical shielding, with documented integration in radiation protection concrete for healthcare facilities and precision filler applications in automotive coatings. The country maintains moderate growth momentum with a CAGR of 2.1% through 2035, driven by ongoing North Sea drilling activity supporting offshore oil and gas production, chemical industry demand for barium compounds, and hospital infrastructure upgrades incorporating advanced imaging equipment. German end-users emphasize quality specifications and REACH compliance, creating constant demand for certified barite grades meeting European environmental and safety standards. Limited domestic production requires import sourcing from established European and international suppliers.
Market development factors:
The United Kingdom market demonstrates concentration in offshore drilling fluids for North Sea operations and healthcare radiation shielding concrete for NHS imaging facilities, with documented applications in brownfield redevelopment projects and specialty concrete manufacturing. The market shows modest growth potential with a CAGR of 1.7% through 2035, linked to North Sea brownfield development supporting production from mature fields and healthcare capital investment programs. British operators prioritize supply chain reliability and quality assurance, sourcing API-grade barite from established European and international suppliers while maintaining strategic inventory to support offshore drilling campaigns. Growing focus on healthcare infrastructure modernization creates constant demand for radiation shielding materials in hospital construction and renovation projects.
Market development factors:
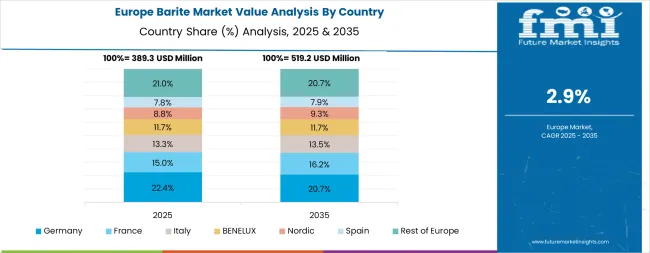
The barite market in Western Europe accounts for approximately 24.0% of global revenues in 2025, equivalent to approximately USD 0.4 billion. Within Western Europe, Germany leads with approximately 22.0% of regional market share, supported by North Sea oilfield service demand and high-purity grade requirements for chemical and industrial applications in major industrial centers focusing quality specifications and REACH compliance.
The United Kingdom follows with approximately 19.0% share driven by offshore drilling fluids for North Sea operations and healthcare radiation shielding concrete for NHS imaging centers and private medical facilities. France holds approximately 16.0% share through paints and coatings applications alongside radiology construction projects in major metropolitan areas. Italy commands approximately 12.0% market share driven by plastics and rubber masterbatch applications in manufacturing regions.
Spain accounts for approximately 9.0% share supported by civil engineering concrete applications and construction industry demand. The Nordic region captures approximately 8.0% share through specialty aggregates for coastal protection and environmental remediation uses. Benelux countries hold approximately 7.0% share functioning as distribution hubs for European markets. The Rest of Western Europe accounts for approximately 7.0% of regional market share through diversified industrial filler applications.
EU material compliance frameworks including REACH regulation, hospital infrastructure upgrade programs incorporating modern imaging technology, and brownfield refinery and chemical site development support steady, quality-driven demand through 2035. The European market prioritizes certified supply chains, environmental compliance, and technical specifications that favor established suppliers meeting stringent quality and documentation requirements.
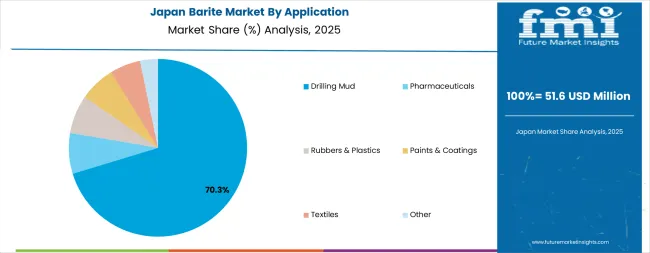
The Japanese market demonstrates a modest and specialized landscape, characterized by limited domestic mining capacity and reliance on imports to serve niche applications in specialty chemicals, electronics materials, and healthcare radiation shielding. Japan's focus on quality standards and material purity drives demand for certified barite grades meeting stringent specifications for industrial applications and healthcare construction projects. The market benefits from established relationships with international barite suppliers including Indian, Chinese, and Southeast Asian producers providing reliable supply chains for specialized applications. Manufacturing centers in major industrial regions maintain strategic inventories of barite for specialty chemical production and healthcare construction projects requiring documented material provenance and quality certification.
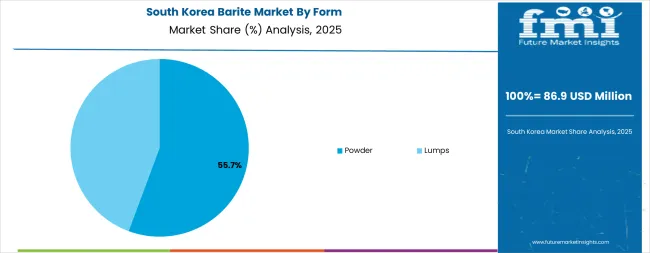
The South Korean market is characterized by modest consumption focused on healthcare radiation shielding and specialty industrial applications, with limited domestic production requiring import supply chains from regional producers. The market demonstrates stable demand patterns as Korean manufacturers and healthcare facilities source certified barite grades for radiation protection concrete in medical imaging facilities and industrial filler applications in specialty manufacturing. Local construction companies and healthcare facility developers utilize imported barite meeting Korean construction standards and healthcare facility requirements, sourcing material through established import channels and specialty material distributors. The competitive landscape shows reliance on international barite suppliers providing certified material documentation and technical support for healthcare and industrial applications.
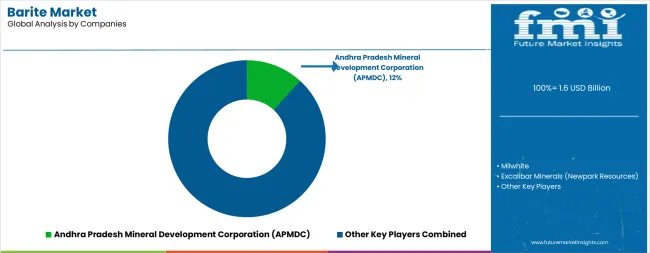
The market features approximately 15-20 meaningful players with moderate concentration, where the top three companies control roughly 30-35% of global market share through established mining operations and extensive logistics capabilities. Competition centers on supply reliability, API grade certification, and strategic location rather than price alone. The leading company, Andhra Pradesh Mineral Development Corporation (APMDC), commands approximately 12.0% of global market share through its control of the Mangampeta barite mining district in India, which provides high-quality API-grade material to global oilfield service companies and maintains strong export relationships with major drilling markets.
Market leaders include APMDC, Milwhite, and Excalibar Minerals (part of Newpark Resources), which maintain competitive advantages through established mining operations, processing facilities, and supply chain relationships with major oilfield service companies, creating switching barriers through quality certification and logistics infrastructure. These companies leverage consistent material quality and strategic inventory positioning to defend market positions while expanding into emerging drilling regions and specialty industrial applications.
Challengers encompass Anglo Pacific Minerals serving European and African markets, BariteWorld providing integrated supply chain solutions, and The Kish Company focusing on Gulf of Mexico and North American markets. Regional specialists including International Earth Products, Global Reach FZE, New Riverside Ochre, and Corpomin focus on specific geographic markets or application segments, offering differentiated capabilities in local sourcing, custom processing, and technical service supporting diverse customer requirements.
Regional players and emerging mining operations create competitive pressure through capacity expansion and strategic mine development, particularly in high-growth markets including India, China, and Middle East regions where proximity to drilling activity provides logistics advantages and customer service responsiveness. Market dynamics favor companies that combine reliable mining operations with comprehensive logistics infrastructure addressing complete supply chain requirements from mine production through delivered material meeting API specifications and customer quality requirements.
Barite represents a critical mineral commodity that enables oil and gas operators to achieve precise drilling fluid density control ranging from 8.5 to 19+ pounds per gallon, delivering essential wellbore pressure management and formation stability with high specific gravity (4.2+ g/cm³) and chemical inertness in demanding drilling environments. With the market projected to grow from USD 1.6 billion in 2025 to USD 2.3 billion by 2035 at a 3.9% CAGR, these mineral systems offer compelling advantages - optimal density characteristics, API specification compliance, and cost-effectiveness - making them essential for drilling mud applications (71.8% market share), healthcare radiation shielding, and industrial sectors seeking high-density mineral solutions for diverse applications. Scaling ecofriendly supply and responsible production requires coordinated action across mining policy frameworks, technical standards development, mineral producers, oilfield service companies, and responsible sourcing investment capital.
| Item | Value |
|---|---|
| Quantitative Units | USD 1.6 billion |
| Application | Drilling Mud (offshore oil, onshore conventional, shale/horizontal wells, geothermal & others), Pharmaceuticals, Rubbers & Plastics, Paints & Coatings, Textiles, Other |
| Form | Lumps, Powder (API-grade powder, precipitated/BaSO₄ filler, micronized medical/paint grade, specialty radiation-shield mixes) |
| Grade (Specific Gravity) | SP 4.2, SP 4.1, SP 4.0, SP 3.9, ≥4.3 Specialty |
| Regions Covered | North America, Latin America, Western Europe, Eastern Europe, South Asia & Pacific, East Asia, Middle East & Africa |
| Country Covered | India, China, Saudi Arabia, Brazil, the USA, Germany, the UK, and 40+ countries |
| Key Companies Profiled | APMDC, Milwhite, Excalibar Minerals, Anglo Pacific Minerals, BariteWorld, The Kish Company, International Earth Products, Global Reach FZE, New Riverside Ochre, Corpomin |
| Additional Attributes | Dollar sales by application, form, and grade categories, regional adoption trends across Asia Pacific, North America, and Middle East & Africa, competitive landscape with mining operations and oilfield service integrators, mining facility requirements and specifications, integration with drilling fluid programs and healthcare infrastructure projects, innovations in processing technology and quality control systems, and development of specialized grades with enhanced performance and ecofriendly capabilities. |
The global barite market is estimated to be valued at USD 1.6 billion in 2025.
The market size for the barite market is projected to reach USD 2.3 billion by 2035.
The barite market is expected to grow at a 3.9% CAGR between 2025 and 2035.
The key product types in barite market are drilling mud, pharmaceuticals, rubbers & plastics, paints & coatings, textiles and other.
In terms of form, powder segment to command 53.4% share in the barite market in 2025.


Our Research Products

The "Full Research Suite" delivers actionable market intel, deep dives on markets or technologies, so clients act faster, cut risk, and unlock growth.

The Leaderboard benchmarks and ranks top vendors, classifying them as Established Leaders, Leading Challengers, or Disruptors & Challengers.

Locates where complements amplify value and substitutes erode it, forecasting net impact by horizon

We deliver granular, decision-grade intel: market sizing, 5-year forecasts, pricing, adoption, usage, revenue, and operational KPIs—plus competitor tracking, regulation, and value chains—across 60 countries broadly.

Spot the shifts before they hit your P&L. We track inflection points, adoption curves, pricing moves, and ecosystem plays to show where demand is heading, why it is changing, and what to do next across high-growth markets and disruptive tech

Real-time reads of user behavior. We track shifting priorities, perceptions of today’s and next-gen services, and provider experience, then pace how fast tech moves from trial to adoption, blending buyer, consumer, and channel inputs with social signals (#WhySwitch, #UX).

Partner with our analyst team to build a custom report designed around your business priorities. From analysing market trends to assessing competitors or crafting bespoke datasets, we tailor insights to your needs.
Supplier Intelligence
Discovery & Profiling
Capacity & Footprint
Performance & Risk
Compliance & Governance
Commercial Readiness
Who Supplies Whom
Scorecards & Shortlists
Playbooks & Docs
Category Intelligence
Definition & Scope
Demand & Use Cases
Cost Drivers
Market Structure
Supply Chain Map
Trade & Policy
Operating Norms
Deliverables
Buyer Intelligence
Account Basics
Spend & Scope
Procurement Model
Vendor Requirements
Terms & Policies
Entry Strategy
Pain Points & Triggers
Outputs
Pricing Analysis
Benchmarks
Trends
Should-Cost
Indexation
Landed Cost
Commercial Terms
Deliverables
Brand Analysis
Positioning & Value Prop
Share & Presence
Customer Evidence
Go-to-Market
Digital & Reputation
Compliance & Trust
KPIs & Gaps
Outputs
Full Research Suite comprises of:
Market outlook & trends analysis
Interviews & case studies
Strategic recommendations
Vendor profiles & capabilities analysis
5-year forecasts
8 regions and 60+ country-level data splits
Market segment data splits
12 months of continuous data updates
DELIVERED AS:
PDF EXCEL ONLINE
GCC Barite Market Trends – Growth, Demand & Forecast 2025–2035
ASEAN Barite Market Analysis – Size, Share & Forecast 2025–2035
Japan Barite Market Growth – Trends, Demand & Innovations 2025–2035
Germany Barite Market Report – Trends, Demand & Industry Forecast 2025–2035
Demand for Barite in EU Size and Share Forecast Outlook 2025 to 2035
Market Share Breakdown of United States Barite Industry
United Kingdom Barite Market Analysis – Size, Share & Forecast 2025–2035

Thank you!
You will receive an email from our Business Development Manager. Please be sure to check your SPAM/JUNK folder too.
Chat With
MaRIA