Residential Robotic Vacuum Cleaner Market Size, Share, and Forecast Outlook 2025 to 2035

Global sales of residential robotic vacuum cleaners have been forecast to rise from USD 4.20 billion in 2025 to USD 14.89 billion by 2035, with a CAGR of 13.5%. Manufacturers are advised to strengthen margins by securing multiyear sensor contracts, relocating after-sales hubs to e-commerce hubs to reduce RMA cycles, and integrating voice-assistant compatibility as a default feature.
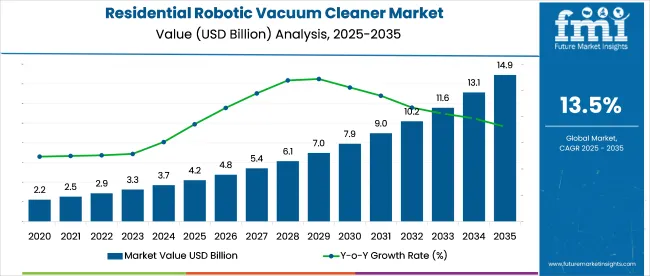
Quick Stats of the Residential Robotic Vacuum Cleaner Market

  • Industry Value (2025): USD 4.20 billion
  • Forecast Value (2035): USD 14.89 billion
  • Global CAGR (2025 to 2035): 13.5%
  • Leading Segment in 2025: In-house robots (~68.5% share)
  • Key Growth Region: Asia Pacific (China)
  • Key Players: iRobot Corporation, Xiaomi, ECOVACS, Samsung Electronics, Dyson

Residential Robotic Vacuum Cleaner Market Market Value Analysis

Metric Value
Industry Size (2025E) USD 4.20 billion
Industry Value (2035F) USD 14.89 billion
CAGR (2025 to 2035) 13.5%

ODM producers should focus on flexible line changeovers, as demand for wet-dry hybrid models is expected to surpass dry-only units by 2027. Sellers can increase average order value by bundling filter consumables and extended warranties, as demonstrated by a 14% basket size increase in 2024.

On June 7, 2025, Xiaomi unveiled the new Robot Vacuum S40C, offering improved suction power and navigation. Equipped with an upgraded LDS laser navigation system and 360° panoramic detection, the S40C can efficiently map home layouts and adapt cleaning routes in real-time.

It boasts 5,000 Pa suction power, four cleaning modes, and a 260ml water tank for mopping with a Y-shaped pattern for a thorough clean. The vacuum supports smart-home features through the Xiaomi Home app and is compatible with Amazon Alexa and Google Assistant for voice control.

The robotic vacuum cleaner market accounts for approximately 18% of the smart home devices market due to its widespread integration into connected ecosystems. Within the consumer electronics market, its share stands at 4%, reflecting its niche position amid broader categories like smartphones and TVs.

In the home appliances market, robotic vacuum cleaners represent around 7%, gaining traction as replacements for manual vacuum units. The market contributes 28% of the service robotics segment, driven by its dominance in residential automation. Lastly, within the floor cleaning equipment market, robotic vacuum cleaners hold a 35% share, with growth supported by rising demand for automated, time-saving cleaning solutions.

Analyzing the Residential Robotic Vacuum Cleaner Market by Top Investment Segment

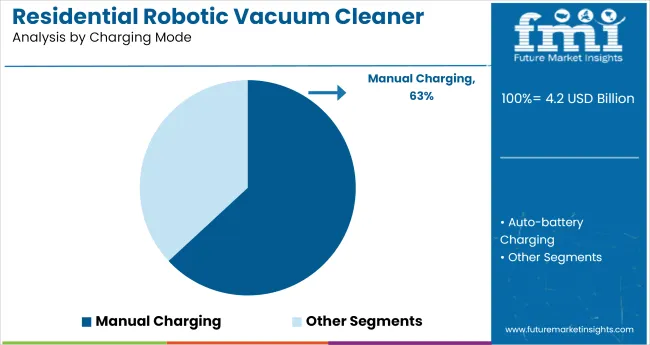
The market is experiencing significant growth, driven by key product features such as manual charging and in-house robots. Manual charging is expected to account for 63.1% of the share in 2025, while in-house robots will dominate the type segment, capturing 68.5%. This growth spans regions like North America, Latin America, Asia Pacific, the Middle East and Africa (MEA), and Europe, with increasing demand for affordable, convenient, and advanced home cleaning solutions.
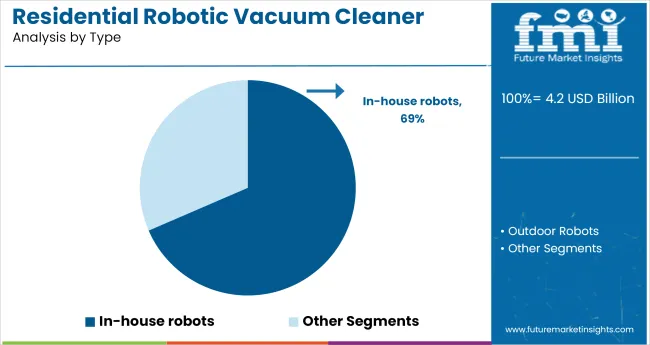
In-house Robots Lead the Type Segment

Residential Robotic Vacuum Cleaner Market Analysis By Type

In-house robots are expected to dominate the market, capturing 68.5% share in 2025. These devices are increasingly popular due to their ability to clean efficiently while navigating around furniture and obstacles. In-house robots are equipped with advanced features such as improved navigation, long battery life, and Wi-Fi connectivity, making them attractive to consumers seeking convenience and ease of use.

As home automation grows, consumers are more inclined to invest in products that integrate seamlessly with smart home systems like Alexa and Google Home. This demand for efficiency and convenience is driving the widespread adoption of in-house robots.
  • In-house robots are driven by consumer preference for smart home integration.
  • Advanced navigation and longer battery life boost the appeal of in-house robots.
  • Growing industry interest in home automation supports the adoption of in-house robots.

Manual Charging Dominates the End-Use Segment

Residential Robotic Vacuum Cleaner Market Analysis By Charging Mode

The manual charging segment is projected to hold 63.1% share in 2025. Although the industry is gradually moving towards self-charging models, manual charging continues to dominate due to its affordability. This feature remains popular in budget-friendly models, particularly in regions where smart home adoption is slower.

Consumers seeking value-driven products often prefer manual charging, as it offers a cost-effective solution without sacrificing functionality. While premium models increasingly feature automatic charging, the accessibility and lower cost of manual charging continue to make it a preferred choice for many households, particularly those with limited budgets.

  • Manual charging systems remain dominant in budget-friendly robotic cleaners.
  • Consumer preference for cost-effective models drives the demand for manual charging.
  • Growing adoption of self-charging models does not overshadow manual charging’s accessibility.

Top Dynamics in the Residential Robotic Vacuum Cleaner Market

The industry is experiencing significant growth, driven by technological advancements, rising consumer interest in smart home devices, and a shift toward more convenient, time-saving cleaning solutions. Increasing adoption of IoT-enabled appliances and the growing trend of home automation are key factors shaping this growth.

Retail and Consumer Adoption of Residential Robotic Vacuum Cleaners

Retailers and online platforms have streamlined sales processes to optimize stock turnover and enhance accessibility. Average product turnover for robotic vacuum cleaners in Western European markets has increased by 15% in Q1 2025 after adopting automated inventory management and digital tracking systems.

Major retailers in the UK and Germany now expect robotic vacuum cleaner SKUs to turn 1.3x faster than traditional cleaning appliances, prompting a 12% increase in dedicated smart home sections in-store. Digital platforms have reduced return rates by 8%, while product warranty programs funded by manufacturers have lowered malfunction rates by 10%. These efficiencies have led to a more balanced inventory, reducing excess stock by 9% and better aligning supply with consumer demand.

  • Product turnover for robotic vacuum cleaners increased by 15% in Q1 2025.
  • Retailers expanded dedicated smart home sections by 12% in-store.
  • Return rates reduced by 8% through improved digital tracking systems.

Growth in Demand for Budget-Friendly Robotic Vacuum Cleaners

The demand for budget-friendly robotic vacuum cleaners has grown by 18% in 2025, driven by a combination of price-sensitive consumers and expanded industry access. Retailers and online platforms now offer financing options and subscription models, making these devices more accessible across various consumer segments.

In the Eastern European sector, sales of affordable models have increased by 22%, surpassing premium models in terms of volume. Digital tracking and on-demand delivery systems have contributed to a 14% reduction in delivery times, further driving accessibility. These factors have expanded adoption in lower-income households, contributing to the rise of budget-friendly robotic vacuum cleaner models.
  • Demand for budget-friendly models has increased by 18% in 2025.
  • Affordable model sales grew by 22% in Eastern European sectors.
  • On-demand delivery systems reduced delivery times by 14%.

Top Countries Driving, Expanding, and Shaping the Residential Robotic Vacuum Cleaner Market

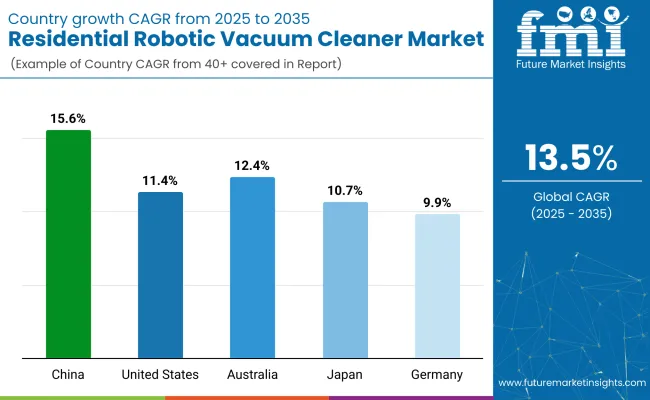
Residential Robotic Vacuum Cleaner Market Country Wise Analysis

Countries CAGR (2025 to 2035)
China 15.6%
United States 11.4%
Australia 12.4%
Japan 10.7%
Germany 9.9%

Global residential robotic vacuum cleaner demand is projected to rise at a 13.5% CAGR from 2025 to 2035. China, part of the BRICS, outpaces the global average with a 15.6% CAGR, reflecting its rapid adoption of smart home devices and high-tech vacuum cleaning solutions.

The United States, part of the OECD, posts a 11.4% growth rate, led by increasing demand for efficient and hands-free home cleaning solutions. Australia, with a 12.4% CAGR, follows closely, driven by high-tech product adoption. Japan, at 10.7%, is driven by increasing interest in compact, efficient cleaning devices.

Germany, part of the EU, records 9.9%, with growing interest in automated home cleaning but slower adoption compared to other regions. Other ASEAN countries are experiencing rising demand, although not yet profiled here, influenced by digitalization and home automation trends.

The report covers detailed analysis of 40+ countries and the top five countries have been shared as a reference.

Sales Analysis of Robotic Vacuum Cleaner Market in the United States

The USA market is growing at an 11.4% CAGR from 2025 to 2035, driven by demand for convenience-focused, AI-powered robotic vacuum cleaners. Growth is concentrated in high-end SKUs with features like lidar mapping, app integration, and self-emptying docks. Suburban households account for a large share due to floor area and lifestyle compatibility.

Brands such as iRobot and Shark dominate, with innovation cycles led by user interface upgrades and voice control integration. As part of the OECD, the USA benefits from high consumer trust, premium pricing potential, and robust after-sales infrastructure in the robotic vacuum cleaner category.

  • High-end SKUs dominate with AI and connectivity features
  • Suburban household penetration drives volume
  • Premium pricing supported by strong service networks

In-depth Analysis of Robotic Vacuum Cleaner Market in China

China is projected to expand at a 15.6% CAGR through 2035, well above the global average for robotic vacuum cleaners. Rising disposable income, increasing smart-home adoption, and domestic manufacturing dominance drive widespread uptake of robotic vacuum cleaner units. The country’s strong e-commerce ecosystem boosts reach across urban and semi-urban zones.

Government incentives for robotics and AI also contribute to scale and cost-efficiency. Domestic players like Ecovacs and Xiaomi are scaling exports, while aggressive R&D and vertical integration help China maintain cost and design leadership in mid-range to premium robotic vacuum cleaner segments.

  • Strong e-commerce penetration and domestic brand dominance
  • Smart-home adoption fuels volume across city tiers
  • Export leadership in low- and mid-range robotic vacuum cleaner SKUs

Demand Outlook for Robotic Vacuum Cleaner Market in Australia

Australia is expected to grow at a 12.4% CAGR through 2035, led by rising dual-income households, growing acceptance of robotic vacuum cleaner adoption, and retail partnerships across electronics chains. Urban dwellers in Sydney, Melbourne, and Brisbane are key consumers, attracted by compact robotic vacuum cleaner models suited to apartment living. Market traction is further supported by subscription models and bundled smart-home offers. Australian retailers have begun importing Asian SKUs, pushing competition on both price and features.

  • Urban apartment dwellers drive compact model adoption
  • Subscription plans expand industry accessibility.
  • High-margin sales through bundled smart-home packages

Opportunity Analysis of Robotic Vacuum Cleaner Market in Japan

Sales for robotic vacuum cleaners in Japan are forecast to grow at a 10.7% CAGR between 2025 and 2035. Growth is driven by aging demographics and high comfort with domestic automation, particularly robotic vacuum cleaner usage. Compact living spaces and high hygiene awareness increase the adoption of low-noise, compact robotic vacuum cleaners.

Domestic brands like Panasonic and Sharp focus on premium, whisper-quiet models optimized for small interiors. As an OECD member, Japan shows high brand loyalty, low return rates, and strong demand for feature-rich, reliable robotic vacuum cleaner units.

  • High-tech domestic brands dominate compact, quiet model sales
  • Aging population favors automation-friendly cleaning solutions
  • Steady demand from hygiene-conscious consumers in urban zones

Demand Analysis for Robotic Vacuum Cleaner Market in Germany

Germany is projected to grow at a 9.9% CAGR from 2025 to 2035. The robotic vacuum cleaner market is shaped by a preference for precision, energy efficiency, and strong after-sales service. German consumers favor robotic vacuum cleaners with European safety certifications and quiet operation. The rise of dual-income households and increasing smart-home integration is driving the replacement of traditional vacuum cleaners. Brands like Vorwerk and Miele maintain strong domestic appeal, while Asian brands gain traction through price competitiveness.
  • Consumers focus on build quality and energy efficiency
  • High replacement rate of traditional vacuums in urban households
  • Demand supported by domestic brands and certified safety features

Leading Robotic Vacuum Cleaner Market Suppliers

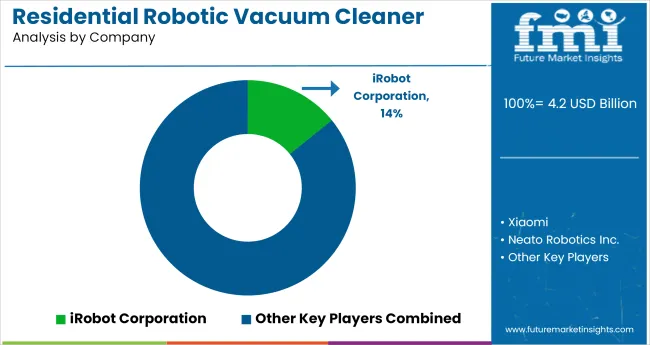
Residential Robotic Vacuum Cleaner Market Analysis By Company

In the robotic vacuum cleaner market, growth has been led by innovations in AI-based mapping, multi-surface adaptability, and home automation integration. Xiaomi, ECOVACS, and Samsung Electronics have positioned themselves as dominant suppliers through LIDAR-equipped models, smartphone connectivity, and competitive pricing.

Neato Robotics, Dyson, and Koninklijke Philips N.V. have continued to innovate in design, suction strength, and smart charging features. Emerging players such as Milagrow Business and Knowledge Solutions are expanding in South Asia and the Middle East, offering region-specific service support and affordable automation.

Competitive pressure has increased as new brands enter with OEM backing, yet premium positioning depends on connectivity, AI capabilities, and maintenance ecosystems. Core strategies include compatibility with smart-home ecosystems, SKU diversification for household needs, and regional distribution alliances to extend reach without escalating operational costs.

Recent Industry News

  • In December 2023, Samsung Electronics unveiled its new vacuum lineup at CES® 2024, integrating advanced AI for improved cleaning. The Bespoke Jet Bot Combo™, equipped with enhanced AI, recognized spaces and stains, offering more efficient cleaning. This innovation marked a significant step forward in home cleaning technology.
  • In January 2024, Roborock revealed a new lineup of smart home cleaning devices at CES, including the S8 MaxV Ultra and Q Revo Pro. The company, known for its robotic intelligence, aimed to meet evolving consumer demands, citing enhanced connectivity and cleaning capabilities.

Key Companies in the Robotic Vacuum Cleaner Market

  • iRobot Corporation
  • Xiaomi
  • Neato Robotics Inc.
  • Dyson Inc.
  • ECOVACS
  • Hayward Industries Inc.
  • Koninklijke Philips N.V.
  • Samsung Electronics Co. Ltd.
  • Pentair
  • Milagrow Business
  • Knowledge Solutions (Pvt) Limited

Research Coverage and Scope Summary

Report Attributes Details
Industry Size (2025) USD 4.20 billion
Projected Industry Size (2035) USD 14.89 billion
CAGR (2025 to 2035) 13.5%
Base Year for Estimation 2024
Historical Period 2020 to 2024
Projections Period 2025 to 2035
Quantitative Units USD billion for value and million units for volume
Types Analyzed (Segment 1) In-House Robots, Outdoor Robots
Charging Modes Analyzed (Segment 2) Manual Charging, Auto-Battery Charging
Regions Covered North America, Latin America, Asia Pacific, Middle East & Africa, Europe
Countries Covered United States, Canada, Germany, United Kingdom, France, Italy, Spain, China, India, Japan, South Korea, Australia, Brazil, Mexico, Argentina, Saudi Arabia, UAE, South Africa
Key Players iRobot Corporation, Xiaomi, Neato Robotics Inc., Dyson Inc., ECOVACS, Hayward Industries Inc., Koninklijke Philips N.V., Samsung Electronics Co. Ltd., Pentair, Milagrow Business, Knowledge Solutions (Pvt) Limited
Additional Attributes Dollar sales, share by type and charging mode, rising adoption in connected smart homes, demand for LIDAR and AI-based pathfinding, premiumization trends in robotic cleaning appliances across urban households

Market Segmentation

By Type:

The industry is segmented into in-house robots and outdoor robots.

By Charging Mode:

The industry is segmented into manual charging and auto-battery charging.

By Region:

The industry is segmented into North America, Latin America, Asia Pacific, Middle East and Africa (MEA), and Europe.

Table of Content

  1. Executive Summary
    • Global Market Outlook
    • Demand-side Trends
    • Supply-side Trends
    • Technology Roadmap Analysis
    • Analysis and Recommendations
  2. Market Overview
    • Market Coverage / Taxonomy
    • Market Definition / Scope / Limitations
  3. Market Background
    • Market Dynamics
      • Drivers
      • Restraints
      • Opportunity
      • Trends
    • Scenario Forecast
      • Demand in Optimistic Scenario
      • Demand in Likely Scenario
      • Demand in Conservative Scenario
    • Opportunity Map Analysis
    • Product Life Cycle Analysis
    • Supply Chain Analysis
      • Supply Side Participants and their Roles
        • Producers
        • Mid-Level Participants (Traders/ Agents/ Brokers)
        • Wholesalers and Distributors
      • Value Added and Value Created at Node in the Supply Chain
      • List of Raw Material Suppliers
      • List of Existing and Potential Buyer’s
    • Investment Feasibility Matrix
    • Value Chain Analysis
      • Profit Margin Analysis
      • Wholesalers and Distributors
      • Retailers
    • PESTLE and Porter’s Analysis
    • Regulatory Landscape
      • By Key Regions
      • By Key Countries
    • Regional Parent Market Outlook
    • Production and Consumption Statistics
    • Import and Export Statistics
  4. Global Market Analysis 2020 to 2024 and Forecast, 2025 to 2035
    • Historical Market Size Value (USD Billion) & Volume (Million Units) Analysis, 2020 to 2024
    • Current and Future Market Size Value (USD Billion) & Volume (Million Units) Projections, 2025 to 2035
      • Y-o-Y Growth Trend Analysis
      • Absolute $ Opportunity Analysis
  5. Global Market Pricing Analysis 2020 to 2024 and Forecast 2025 to 2035
  6. Global Market Analysis 2020 to 2024 and Forecast 2025 to 2035, By Type
    • Introduction / Key Findings
    • Historical Market Size Value (USD Billion) & Volume (Million Units) Analysis By Type, 2020 to 2024
    • Current and Future Market Size Value (USD Billion) & Volume (Million Units) Analysis and Forecast By Type, 2025 to 2035
      • In-house Robot
      • Outdoor Robot
    • Y-o-Y Growth Trend Analysis By Type, 2020 to 2024
    • Absolute $ Opportunity Analysis By Type, 2025 to 2035
  7. Global Market Analysis 2020 to 2024 and Forecast 2025 to 2035, By Charging Mode
    • Introduction / Key Findings
    • Historical Market Size Value (USD Billion) & Volume (Million Units) Analysis By Charging Mode, 2020 to 2024
    • Current and Future Market Size Value (USD Billion) & Volume (Million Units) Analysis and Forecast By Charging Mode, 2025 to 2035
      • Manual Charging
      • Auto-Battery Charging
    • Y-o-Y Growth Trend Analysis By Charging Mode, 2020 to 2024
    • Absolute $ Opportunity Analysis By Charging Mode, 2025 to 2035
  8. Global Market Analysis 2020 to 2024 and Forecast 2025 to 2035, By Region
    • Introduction
    • Historical Market Size Value (USD Billion) & Volume (Million Units) Analysis By Region, 2020 to 2024
    • Current Market Size Value (USD Billion) & Volume (Million Units) Analysis and Forecast By Region, 2025 to 2035
      • North America
      • Latin America
      • Western Europe
      • Eastern Europe
      • East Asia
      • South Asia & Pacific
      • Middle East and Africa
    • Market Attractiveness Analysis By Region
  9. North America Market Analysis 2020 to 2024 and Forecast 2025 to 2035, By Country
    • Historical Market Size Value (USD Billion) & Volume (Million Units) Trend Analysis By Market Taxonomy, 2020 to 2024
    • Market Size Value (USD Billion) & Volume (Million Units) Forecast By Market Taxonomy, 2025 to 2035
      • By Country
        • USA
        • Canada
        • Mexico
      • By Type
      • By Charging Mode
    • Market Attractiveness Analysis
      • By Country
      • By Type
      • By Charging Mode
    • Key Takeaways
  10. Latin America Market Analysis 2020 to 2024 and Forecast 2025 to 2035, By Country
    • Historical Market Size Value (USD Billion) & Volume (Million Units) Trend Analysis By Market Taxonomy, 2020 to 2024
    • Market Size Value (USD Billion) & Volume (Million Units) Forecast By Market Taxonomy, 2025 to 2035
      • By Country
        • Brazil
        • Argentina
        • Rest of LATAM
      • By Type
      • By Charging Mode
    • Market Attractiveness Analysis
      • By Country
      • By Type
      • By Charging Mode
    • Key Takeaways
  11. Western Europe Market Analysis 2020 to 2024 and Forecast 2025 to 2035, By Country
    • Historical Market Size Value (USD Billion) & Volume (Million Units) Trend Analysis By Market Taxonomy, 2020 to 2024
    • Market Size Value (USD Billion) & Volume (Million Units) Forecast By Market Taxonomy, 2025 to 2035
      • By Country
        • Germany
        • Italy
        • France
        • UK
        • Spain
        • BENELUX
        • Nordic
        • Rest of W.Europe
      • By Type
      • By Charging Mode
    • Market Attractiveness Analysis
      • By Country
      • By Type
      • By Charging Mode
    • Key Takeaways
  12. Eastern Europe Market Analysis 2020 to 2024 and Forecast 2025 to 2035, By Country
    • Historical Market Size Value (USD Billion) & Volume (Million Units) Trend Analysis By Market Taxonomy, 2020 to 2024
    • Market Size Value (USD Billion) & Volume (Million Units) Forecast By Market Taxonomy, 2025 to 2035
      • By Country
        • Russia
        • Hungary
        • Poland
        • Balkan & Baltics
        • Rest of E. Europe
      • By Type
      • By Charging Mode
    • Market Attractiveness Analysis
      • By Country
      • By Type
      • By Charging Mode
    • Key Takeaways
  13. East Asia Market Analysis 2020 to 2024 and Forecast 2025 to 2035, By Country
    • Historical Market Size Value (USD Billion) & Volume (Million Units) Trend Analysis By Market Taxonomy, 2020 to 2024
    • Market Size Value (USD Billion) & Volume (Million Units) Forecast By Market Taxonomy, 2025 to 2035
      • By Country
        • China
        • Japan
        • South Korea
      • By Type
      • By Charging Mode
    • Market Attractiveness Analysis
      • By Country
      • By Type
      • By Charging Mode
    • Key Takeaways
  14. South Asia & Pacific Market Analysis 2020 to 2024 and Forecast 2025 to 2035, By Country
    • Historical Market Size Value (USD Billion) & Volume (Million Units) Trend Analysis By Market Taxonomy, 2020 to 2024
    • Market Size Value (USD Billion) & Volume (Million Units) Forecast By Market Taxonomy, 2025 to 2035
      • By Country
        • India
        • Australia & New Zealand
        • ASEAN
        • Rest of SAP
      • By Type
      • By Charging Mode
    • Market Attractiveness Analysis
      • By Country
      • By Type
      • By Charging Mode
    • Key Takeaways
  15. Middle East and Africa Market Analysis 2020 to 2024 and Forecast 2025 to 2035, By Country
    • Historical Market Size Value (USD Billion) & Volume (Million Units) Trend Analysis By Market Taxonomy, 2020 to 2024
    • Market Size Value (USD Billion) & Volume (Million Units) Forecast By Market Taxonomy, 2025 to 2035
      • By Country
        • GCC Countries
        • Northern Africa
        • South Africa
        • Turkiye
        • Rest of MEA
      • By Type
      • By Charging Mode
    • Market Attractiveness Analysis
      • By Country
      • By Type
      • By Charging Mode
    • Key Takeaways
  16. Key Countries Market Analysis
    • USA
      • Pricing Analysis
      • Market Share Analysis, 2024
        • By Type
        • By Charging Mode
    • Canada
      • Pricing Analysis
      • Market Share Analysis, 2024
        • By Type
        • By Charging Mode
    • Brazil
      • Pricing Analysis
      • Market Share Analysis, 2024
        • By Type
        • By Charging Mode
    • Mexico
      • Pricing Analysis
      • Market Share Analysis, 2024
        • By Type
        • By Charging Mode
    • Argentina
      • Pricing Analysis
      • Market Share Analysis, 2024
        • By Type
        • By Charging Mode
  17. Market Structure Analysis
    • Competition Dashboard
    • Competition Benchmarking
    • Market Share Analysis of Top Players
      • By Regional
      • By Type
      • By Charging Mode
  18. Competition Analysis
    • Competition Deep Dive
      • iRobot Corporation
        • Overview
        • Product Portfolio
        • Profitability by Market Segments (Product/Age /Sales Channel/Region)
        • Sales Footprint
        • Strategy Overview
          • Marketing Strategy
          • Product Strategy
          • Channel Strategy
      • Xiaomi
        • Overview
        • Product Portfolio
        • Profitability by Market Segments (Product/Age /Sales Channel/Region)
        • Sales Footprint
        • Strategy Overview
          • Marketing Strategy
          • Product Strategy
          • Channel Strategy
      • Neato Robotics Inc.
        • Overview
        • Product Portfolio
        • Profitability by Market Segments (Product/Age /Sales Channel/Region)
        • Sales Footprint
        • Strategy Overview
          • Marketing Strategy
          • Product Strategy
          • Channel Strategy
      • Dyson Inc.
        • Overview
        • Product Portfolio
        • Profitability by Market Segments (Product/Age /Sales Channel/Region)
        • Sales Footprint
        • Strategy Overview
          • Marketing Strategy
          • Product Strategy
          • Channel Strategy
      • ECOVACS
        • Overview
        • Product Portfolio
        • Profitability by Market Segments (Product/Age /Sales Channel/Region)
        • Sales Footprint
        • Strategy Overview
          • Marketing Strategy
          • Product Strategy
          • Channel Strategy
      • Hayward Industries Inc.
        • Overview
        • Product Portfolio
        • Profitability by Market Segments (Product/Age /Sales Channel/Region)
        • Sales Footprint
        • Strategy Overview
          • Marketing Strategy
          • Product Strategy
          • Channel Strategy
      • Koninklijke Philips N.V.
        • Overview
        • Product Portfolio
        • Profitability by Market Segments (Product/Age /Sales Channel/Region)
        • Sales Footprint
        • Strategy Overview
          • Marketing Strategy
          • Product Strategy
          • Channel Strategy
      • Samsung Electronics Co. Ltd.
        • Overview
        • Product Portfolio
        • Profitability by Market Segments (Product/Age /Sales Channel/Region)
        • Sales Footprint
        • Strategy Overview
          • Marketing Strategy
          • Product Strategy
          • Channel Strategy
      • Pentair
        • Overview
        • Product Portfolio
        • Profitability by Market Segments (Product/Age /Sales Channel/Region)
        • Sales Footprint
        • Strategy Overview
          • Marketing Strategy
          • Product Strategy
          • Channel Strategy
      • Milagrow Business
        • Overview
        • Product Portfolio
        • Profitability by Market Segments (Product/Age /Sales Channel/Region)
        • Sales Footprint
        • Strategy Overview
          • Marketing Strategy
          • Product Strategy
          • Channel Strategy
      • Knowledge Solutions (Pvt) Limited
        • Overview
        • Product Portfolio
        • Profitability by Market Segments (Product/Age /Sales Channel/Region)
        • Sales Footprint
        • Strategy Overview
          • Marketing Strategy
          • Product Strategy
          • Channel Strategy
  19. Assumptions & Acronyms Used
  20. Research Methodology

List of Tables

  • Table 1: Global Market Value (USD Billion) Forecast by Region, 2020-2035
  • Table 2: Global Market Volume (Million Units) Forecast by Region, 2020-2035
  • Table 3: Global Market Value (USD Billion) Forecast by Type, 2020-2035
  • Table 4: Global Market Volume (Million Units) Forecast by Type, 2020-2035
  • Table 5: Global Market Value (USD Billion) Forecast by Charging Mode, 2020-2035
  • Table 6: Global Market Volume (Million Units) Forecast by Charging Mode, 2020-2035
  • Table 7: North America Market Value (USD Billion) Forecast by Country, 2020-2035
  • Table 8: North America Market Volume (Million Units) Forecast by Country, 2020-2035
  • Table 9: North America Market Value (USD Billion) Forecast by Type, 2020-2035
  • Table 10: North America Market Volume (Million Units) Forecast by Type, 2020-2035
  • Table 11: North America Market Value (USD Billion) Forecast by Charging Mode, 2020-2035
  • Table 12: North America Market Volume (Million Units) Forecast by Charging Mode, 2020-2035
  • Table 13: Latin America Market Value (USD Billion) Forecast by Country, 2020-2035
  • Table 14: Latin America Market Volume (Million Units) Forecast by Country, 2020-2035
  • Table 15: Latin America Market Value (USD Billion) Forecast by Type, 2020-2035
  • Table 16: Latin America Market Volume (Million Units) Forecast by Type, 2020-2035
  • Table 17: Latin America Market Value (USD Billion) Forecast by Charging Mode, 2020-2035
  • Table 18: Latin America Market Volume (Million Units) Forecast by Charging Mode, 2020-2035
  • Table 19: Western Europe Market Value (USD Billion) Forecast by Country, 2020-2035
  • Table 20: Western Europe Market Volume (Million Units) Forecast by Country, 2020-2035
  • Table 21: Western Europe Market Value (USD Billion) Forecast by Type, 2020-2035
  • Table 22: Western Europe Market Volume (Million Units) Forecast by Type, 2020-2035
  • Table 23: Western Europe Market Value (USD Billion) Forecast by Charging Mode, 2020-2035
  • Table 24: Western Europe Market Volume (Million Units) Forecast by Charging Mode, 2020-2035
  • Table 25: Eastern Europe Market Value (USD Billion) Forecast by Country, 2020-2035
  • Table 26: Eastern Europe Market Volume (Million Units) Forecast by Country, 2020-2035
  • Table 27: Eastern Europe Market Value (USD Billion) Forecast by Type, 2020-2035
  • Table 28: Eastern Europe Market Volume (Million Units) Forecast by Type, 2020-2035
  • Table 29: Eastern Europe Market Value (USD Billion) Forecast by Charging Mode, 2020-2035
  • Table 30: Eastern Europe Market Volume (Million Units) Forecast by Charging Mode, 2020-2035
  • Table 31: East Asia Market Value (USD Billion) Forecast by Country, 2020-2035
  • Table 32: East Asia Market Volume (Million Units) Forecast by Country, 2020-2035
  • Table 33: East Asia Market Value (USD Billion) Forecast by Type, 2020-2035
  • Table 34: East Asia Market Volume (Million Units) Forecast by Type, 2020-2035
  • Table 35: East Asia Market Value (USD Billion) Forecast by Charging Mode, 2020-2035
  • Table 36: East Asia Market Volume (Million Units) Forecast by Charging Mode, 2020-2035
  • Table 37: South Asia & Pacific Market Value (USD Billion) Forecast by Country, 2020-2035
  • Table 38: South Asia & Pacific Market Volume (Million Units) Forecast by Country, 2020-2035
  • Table 39: South Asia & Pacific Market Value (USD Billion) Forecast by Type, 2020-2035
  • Table 40: South Asia & Pacific Market Volume (Million Units) Forecast by Type, 2020-2035
  • Table 41: South Asia & Pacific Market Value (USD Billion) Forecast by Charging Mode, 2020-2035
  • Table 42: South Asia & Pacific Market Volume (Million Units) Forecast by Charging Mode, 2020-2035
  • Table 43: Middle East and Africa Market Value (USD Billion) Forecast by Country, 2020-2035
  • Table 44: Middle East and Africa Market Volume (Million Units) Forecast by Country, 2020-2035
  • Table 45: Middle East and Africa Market Value (USD Billion) Forecast by Type, 2020-2035
  • Table 46: Middle East and Africa Market Volume (Million Units) Forecast by Type, 2020-2035
  • Table 47: Middle East and Africa Market Value (USD Billion) Forecast by Charging Mode, 2020-2035
  • Table 48: Middle East and Africa Market Volume (Million Units) Forecast by Charging Mode, 2020-2035

List of Figures

  • Figure 1: Global Residential Market Volume (Million Units) Forecast 2020-2035
  • Figure 2: Global Residential Market Pricing Analysis
  • Figure 3: Global Residential Market Value (USD Billion) Forecast 2020-2035
  • Figure 4: Global Residential Market Value Share and BPS Analysis by Type, 2025 and 2035
  • Figure 5: Global Residential Market Y-o-Y Growth Comparison by Type, 2025-2035
  • Figure 6: Global Residential Market Attractiveness Analysis by Type
  • Figure 7: Global Residential Market Value Share and BPS Analysis by Charging Mode, 2025 and 2035
  • Figure 8: Global Residential Market Y-o-Y Growth Comparison by Charging Mode, 2025-2035
  • Figure 9: Global Residential Market Attractiveness Analysis by Charging Mode
  • Figure 10: Global Residential Market Value (USD Billion) Share and BPS Analysis by Region, 2025 and 2035
  • Figure 11: Global Residential Market Y-o-Y Growth Comparison by Region, 2025-2035
  • Figure 12: Global Residential Market Attractiveness Analysis by Region
  • Figure 13: North America Residential Market Incremental $ Opportunity, 2025-2035
  • Figure 14: Latin America Residential Market Incremental $ Opportunity, 2025-2035
  • Figure 15: Western Europe Residential Market Incremental $ Opportunity, 2025-2035
  • Figure 16: Eastern Europe Residential Market Incremental $ Opportunity, 2025-2035
  • Figure 17: East Asia Residential Market Incremental $ Opportunity, 2025-2035
  • Figure 18: South Asia & Pacific Residential Market Incremental $ Opportunity, 2025-2035
  • Figure 19: Middle East and Africa Residential Market Incremental $ Opportunity, 2025-2035
  • Figure 20: North America Residential Market Value Share and BPS Analysis by Country, 2025 and 2035
  • Figure 21: North America Residential Market Value Share and BPS Analysis by Type, 2025 and 2035
  • Figure 22: North America Residential Market Y-o-Y Growth Comparison by Type, 2025-2035
  • Figure 23: North America Residential Market Attractiveness Analysis by Type
  • Figure 24: North America Residential Market Value Share and BPS Analysis by Charging Mode, 2025 and 2035
  • Figure 25: North America Residential Market Y-o-Y Growth Comparison by Charging Mode, 2025-2035
  • Figure 26: North America Residential Market Attractiveness Analysis by Charging Mode
  • Figure 27: Latin America Residential Market Value Share and BPS Analysis by Country, 2025 and 2035
  • Figure 28: Latin America Residential Market Value Share and BPS Analysis by Type, 2025 and 2035
  • Figure 29: Latin America Residential Market Y-o-Y Growth Comparison by Type, 2025-2035
  • Figure 30: Latin America Residential Market Attractiveness Analysis by Type
  • Figure 31: Latin America Residential Market Value Share and BPS Analysis by Charging Mode, 2025 and 2035
  • Figure 32: Latin America Residential Market Y-o-Y Growth Comparison by Charging Mode, 2025-2035
  • Figure 33: Latin America Residential Market Attractiveness Analysis by Charging Mode
  • Figure 34: Western Europe Residential Market Value Share and BPS Analysis by Country, 2025 and 2035
  • Figure 35: Western Europe Residential Market Value Share and BPS Analysis by Type, 2025 and 2035
  • Figure 36: Western Europe Residential Market Y-o-Y Growth Comparison by Type, 2025-2035
  • Figure 37: Western Europe Residential Market Attractiveness Analysis by Type
  • Figure 38: Western Europe Residential Market Value Share and BPS Analysis by Charging Mode, 2025 and 2035
  • Figure 39: Western Europe Residential Market Y-o-Y Growth Comparison by Charging Mode, 2025-2035
  • Figure 40: Western Europe Residential Market Attractiveness Analysis by Charging Mode
  • Figure 41: Eastern Europe Residential Market Value Share and BPS Analysis by Country, 2025 and 2035
  • Figure 42: Eastern Europe Residential Market Value Share and BPS Analysis by Type, 2025 and 2035
  • Figure 43: Eastern Europe Residential Market Y-o-Y Growth Comparison by Type, 2025-2035
  • Figure 44: Eastern Europe Residential Market Attractiveness Analysis by Type
  • Figure 45: Eastern Europe Residential Market Value Share and BPS Analysis by Charging Mode, 2025 and 2035
  • Figure 46: Eastern Europe Residential Market Y-o-Y Growth Comparison by Charging Mode, 2025-2035
  • Figure 47: Eastern Europe Residential Market Attractiveness Analysis by Charging Mode
  • Figure 48: East Asia Residential Market Value Share and BPS Analysis by Country, 2025 and 2035
  • Figure 49: East Asia Residential Market Value Share and BPS Analysis by Type, 2025 and 2035
  • Figure 50: East Asia Residential Market Y-o-Y Growth Comparison by Type, 2025-2035
  • Figure 51: East Asia Residential Market Attractiveness Analysis by Type
  • Figure 52: East Asia Residential Market Value Share and BPS Analysis by Charging Mode, 2025 and 2035
  • Figure 53: East Asia Residential Market Y-o-Y Growth Comparison by Charging Mode, 2025-2035
  • Figure 54: East Asia Residential Market Attractiveness Analysis by Charging Mode
  • Figure 55: South Asia & Pacific Residential Market Value Share and BPS Analysis by Country, 2025 and 2035
  • Figure 56: South Asia & Pacific Residential Market Value Share and BPS Analysis by Type, 2025 and 2035
  • Figure 57: South Asia & Pacific Residential Market Y-o-Y Growth Comparison by Type, 2025-2035
  • Figure 58: South Asia & Pacific Residential Market Attractiveness Analysis by Type
  • Figure 59: South Asia & Pacific Residential Market Value Share and BPS Analysis by Charging Mode, 2025 and 2035
  • Figure 60: South Asia & Pacific Residential Market Y-o-Y Growth Comparison by Charging Mode, 2025-2035
  • Figure 61: South Asia & Pacific Residential Market Attractiveness Analysis by Charging Mode
  • Figure 62: Middle East and Africa Residential Market Value Share and BPS Analysis by Country, 2025 and 2035
  • Figure 63: Middle East and Africa Residential Market Value Share and BPS Analysis by Type, 2025 and 2035
  • Figure 64: Middle East and Africa Residential Market Y-o-Y Growth Comparison by Type, 2025-2035
  • Figure 65: Middle East and Africa Residential Market Attractiveness Analysis by Type
  • Figure 66: Middle East and Africa Residential Market Value Share and BPS Analysis by Charging Mode, 2025 and 2035
  • Figure 67: Middle East and Africa Residential Market Y-o-Y Growth Comparison by Charging Mode, 2025-2035
  • Figure 68: Middle East and Africa Residential Market Attractiveness Analysis by Charging Mode
  • Figure 69: Global Residential Market - Tier Structure Analysis
  • Figure 70: Global Residential Market - Company Share Analysis

Frequently Asked Questions

What is the projected industry value of the residential robotic vacuum cleaner market in 2025?

The industry is projected to reach USD 4.20 billion in 2025.

What is the expected global CAGR for the residential robotic vacuum cleaner market from 2025 to 2035?

The industry is expected to grow at a CAGR of 13.5% from 2025 to 2035.

Which segment is expected to dominate the residential robotic vacuum cleaner market in 2025?

In-house robots are expected to capture 68.5% of the market in 2025.

Which region is forecasted to show significant growth in the residential robotic vacuum cleaner market by 2035?

The Asia Pacific region, particularly China, is projected to register a CAGR of 15.6% from 2025 to 2035.

What is the forecasted industry value of the residential robotic vacuum cleaner market by 2035?

The industry is projected to reach USD 14.89 billion by 2035.

Explore Similar Insights

Future Market Insights

Residential Robotic Vacuum Cleaner Market