Reports

- Global Locations -

Headquarters

Future Market Insights, Inc.

Christiana Corporate, 200
Continental Drive, Suite 401,
Newark, Delaware - 19713,
United States

T: +1-845-579-5705

Americas

Future Market Insights, Inc.

616 Corporate Way, Suite 2-9018,
Valley Cottage, NY 10989, United States

T: +1-347-918-3531

MEA

Future Market Insights

1602-6 Jumeirah Bay X2 Tower, Plot No: JLT-PH2-X2A,
Jumeirah Lakes Towers, Dubai,
United Arab Emirates

Europe

Future Market Insights

3rd Floor, 207 Regent Street,
W1B 3HH London
United Kingdom

T: + 44 (0) 20 8123 9659
D: +44 (0) 20 3287 4268

Asia Pacific

Future Market Insights

IndiaLand Global Tech Park, Unit UG-1, Behind Grand HighStreet, Phase 1, Hinjawadi, MH, Pune – 411057, India

GMP Consumables Market Outlook (2023 to 2033)

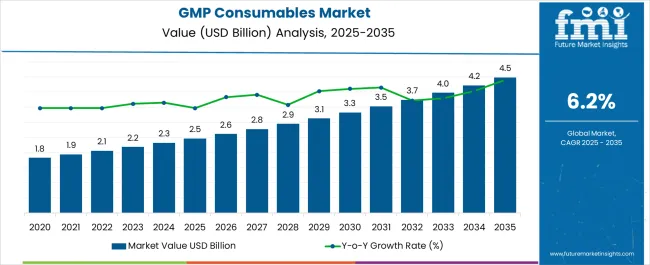
The GMP Consumables Market size is projected to be worth US$ 2.17 billion in 2023. The market is likely to surpass US$ 4.33 billion by 2033 at a CAGR of 6.5% during the forecast period. The market growth is being propelled by increased usage of consumables & disinfection of cleanrooms. Hygiene and safety measures are paramount in GMP environments to prevent contamination and ensure product quality. The focus on maintaining clean and sterile conditions will continue to drive the demand for gloves, wipes, and disinfectants.

The demand for gloves in GMP environments is expected to remain high. Gloves are essential for maintaining aseptic conditions, preventing contamination, and protecting both workers and products. The ongoing emphasis on hygiene and safety, particularly in the pharmaceutical, biopharmaceutical, and healthcare sectors, will drive the demand for high-quality, sterile, and disposable gloves that meet regulatory requirements.

Other Drivers Propelling the Demand for GMP Consumables include:

  • The pharmaceutical and healthcare industries place a strong emphasis on quality control and product safety. GMP consumables play a vital role in maintaining sterile and controlled manufacturing environments, preventing contamination, and ensuring product integrity. The demand for high-quality consumables, such as sterile gloves, wipes, and disinfectants, is driven by the need to uphold product quality and safety standards.
  • Environmental sustainability is gaining importance in the pharmaceutical industry. There is a growing demand for eco-friendly and sustainable GMP consumables, including biodegradable packaging materials, recyclable single-use systems, and energy-efficient manufacturing processes. Companies that provide sustainable GMP consumables aligned with environmental objectives are well-positioned to capitalize on this market driver.
  • Technological advancements such as automation, robotics, data analytics, and digitalization, are transforming the pharmaceutical manufacturing landscape. These advancements improve efficiency, process control, and quality assurance in GMP environments. GMP consumables that integrate with advanced technologies, such as smart sensors, monitoring systems, and data management solutions, are in demand, driving market growth.

Challenges for Companies /Manufacturers in the GMP Consumables:

  • Maintaining consistent quality and reliability of GMP consumables is crucial. Variability in product performance, contamination risks, and inconsistencies in manufacturing processes can impact the overall quality of pharmaceutical products. GMP consumables manufacturers must implement rigorous quality control measures, including raw material testing, process validation, and traceability, to ensure product integrity.
  • The GMP consumables market operates under strict regulatory requirements to ensure product quality and safety. Compliance with these regulations, set by agencies such as the FDA (Food and Drug Administration) and EMA (European Medicines Agency), can be complex and time-consuming. Navigating the ever-evolving regulatory landscape poses a significant challenge for GMP consumables suppliers.
  • The cost of GMP consumables, including gloves, wipes, and disinfectants, can pose a challenge to manufacturers. The need for high-quality materials, compliance with regulatory standards, and the ongoing demand for cost-effective solutions can create cost pressures. Balancing product quality, affordability, and profitability is a constant challenge in the GMP consumables market.

Opportunities in the GMP Consumables Industry:

  • The demand for sterile gloves is expected to rise due to the growing emphasis on maintaining aseptic conditions in GMP environments. Manufacturers that provide high-quality, sterile gloves that meet regulatory requirements have the opportunity to cater to this demand.
  • There is an increasing demand for environmentally friendly wipes made from biodegradable or recycled materials. Manufacturers that develop sustainable wipes and promote their eco-friendly attributes have the opportunity to tap into the growing market of environmentally conscious customers.
  • There is an opportunity for manufacturers to innovate and develop advanced disinfectant formulations and delivery systems. This includes technologies such as aerosols, foams, or long-lasting surface coatings that provide prolonged antimicrobial activity.

Latest Trends in the GMP Consumables:

  • The demand for customized and personalized GMP consumables is on the rise. Manufacturers are offering tailored solutions to meet specific customer requirements. Customized packaging, labeling, and design of consumables are being provided to enhance user experience, meet branding needs, and streamline workflow processes.
  • Automation and robotics are transforming the GMP manufacturing landscape. GMP consumables manufacturers are incorporating automation and robotics in their production processes to improve efficiency, reduce human error, and enhance product quality. Automated systems for packaging, labeling, and quality control of consumables are becoming more prevalent.
  • The COVID-19 pandemic has heightened the focus on personal protective equipment (PPE) in GMP manufacturing environments. GMP consumables manufacturers are experiencing increased demand for PPE, including gloves, masks, and protective clothing. This trend is driven by the need to ensure employee safety and maintain aseptic conditions.
Attributes Details
GMP Consumables Size (2023) US$ 2.17 Billion
GMP Consumables Projected Size (2033) US$ 4.33 Billion
Value CAGR (2023 to 2033) 6.5%

Don't pay for what you don't need

Customize your report by selecting specific countries or regions and save 30%!

2017 to 2022 GMP Consumables Demand Outlook Compared to 2023 to 2033 Forecast

From 2017 to 2022, the global GMP consumables experienced a CAGR of 5.9%, reaching a market size of US$ 2.17 billion in 2023.

From 2017 to 2022, the global GMP consumables industry has been driven by various factors, including the expansion of the pharmaceutical and biotechnology industries, increasing regulatory requirements, advancements in manufacturing technologies, and the growing emphasis on quality and safety. While specific historical growth rates can vary over time and across regions, the overall trend has been positive.

The industry's focus on quality and safety has led to increased investments in GMP consumables that help maintain clean and controlled manufacturing environments. The use of specialized gloves, wipes, and disinfectants designed for GMP applications has become essential to meet the strict hygiene and contamination control requirements.

Future Forecast for GMP Consumables Industry:

Looking ahead, the global GMP consumables industry is expected to rise at a CAGR of 6.5% from 2023 to 2033. During the forecast period, the market size is expected to reach US$ 4.33 Billion by 2033.

The GMP consumables industry is expected to continue its growth trajectory from 2023 to 2033, driven by increasingly incorporating sustainable practices into their operations to reduce waste, conserve energy, and minimize the environmental impact of their products. This trend creates opportunities for the development of eco-friendly GMP consumables made from biodegradable materials and utilizing energy-efficient manufacturing processes.

Comparative View of the GMP Consumables

GMP Consumables Market:

Attributes GMP Consumables Market
CAGR (2023 to 2033) 6.5%
Market Value (2033) US$ 4.33 billion
Opportunity Regulatory agencies impose strict guidelines on the manufacturing and quality control processes of pharmaceutical products. Compliance with GMP regulations is crucial to ensure product safety and efficacy. This creates opportunities for GMP consumables manufacturers to provide validated cleaning agents, environmental monitoring systems, and packaging materials that meet regulatory requirements.
Key Trends Environmental sustainability is gaining prominence in the pharmaceutical industry. There is a growing trend for eco-friendly and recyclable GMP consumables, as well as packaging materials.

Cleanroom Technologies Market:

Attributes Cleanroom Technologies Market
CAGR (2023 to 2033) 6.2%
Market Value (2033) US$ 13.9 billion
Opportunity Contamination control is a critical aspect of cleanroom operations. Cleanroom technologies providers can capitalize on this opportunity by offering state-of-art solutions for effective contamination control. /p>
Key Trends With the heightened awareness of airborne pathogens, there is likely a greater emphasis on air quality control within cleanroom environments. There is increase trend of integration of advanced air filters such as HEPA filters & UVGI systems.

Pharmaceutical Cleaning Validation Market:

Attributes Pharmaceutical Cleaning Validation Market
CAGR (2023 to 2033) 6.8%
Market Value (2033) US$ 34.4 billion
Opportunity Regulatory agencies such as FDA, EMA have stringent guidelines & regulations in place regarding cleaning validation in pharmaceutical manufacturing. This presents an opportunity for cleaning validation services providers to offer implementing effective cleaning validation strategies.
Key Trends The adoption of risk-based approaches in cleaning validation is gaining trend which emphasizes the importance of identifying & controlling the highest risk in cleaning processes.
Sabyasachi Ghosh
Sabyasachi Ghosh

Principal Consultant

Talk to Analyst

Find your sweet spots for generating winning opportunities in this market.

Country-Wise Insights

GMP Consumables to Surge in the United States Due to Stringent Regulatory Standards

Country The United States
Market Size (US$ billion) by End of Forecast Period (2033) US$ 1.6 billion
CAGR % 2023 to End of Forecast (2033) 5.6%

The GMP consumables industry in the United States is expected to reach a market size of US$ 1.6 billion by 2033, expanding at a CAGR of 5.6%. The United States has strict regulatory standards set by regulatory bodies such as the Food and Drug Administration (FDA) to ensure the safety, efficacy, and quality of pharmaceutical products. Compliance with these regulations requires the use of GMP-compliant consumables to maintain clean and controlled manufacturing environments. The adherence to these standards drives the demand for GMP consumables in the country.

Rise in Pharmaceutical & Biotechnology Industry has Propelled the United Kingdom Market Growth

Country The United Kingdom
Market Size (US$ million) by End of Forecast Period (2033) US$ 217.9 million
CAGR % 2023 to End of Forecast (2033) 5.0%

The GMP consumables industry in the United Kingdom is expected to reach a market size of US$ 217.9 million, expanding at a CAGR of 5.0% during the forecast period. The United Kingdom has a strong pharmaceutical and biotechnology sector, with a significant presence of research institutions, pharmaceutical companies, and contract manufacturing organizations. The continuous growth and investments in these industries drive the demand for GMP consumables, including gloves, wipes, disinfectants, and cleanroom apparel.

Notable Growth Expected in China's GMP Consumables due to Favorable Government Policies

Country China
Market Size (US$ million) by End of Forecast Period (2033) US$ 241.7 million
CAGR % 2023 to End of Forecast (2033) 7.2%

The GMP consumables industry in China is anticipated to reach a market size of US$ 241.7 million, moving at a CAGR of 7.2% during the forecast period. The Chinese government has implemented policies to promote the development of the pharmaceutical industry and improve healthcare infrastructure. Initiatives such as the Healthy China 2030 plan and the Made in China 2025 strategy aim to enhance domestic pharmaceutical manufacturing capabilities and ensure product quality and safety. These policies create a conducive environment for the growth of the GMP consumables market.
Strong Pharmaceutical Industry is Driving Market Growth in Japan for GMP Consumables

Country Japan
Market Size (US$ million) by End of Forecast Period (2033) US$ 180.4 million
CAGR % 2023 to End of Forecast (2033) 6.3%

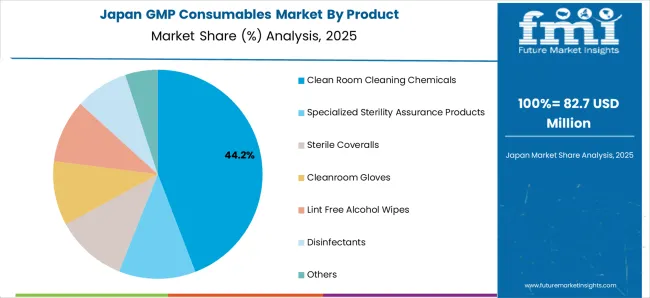
The GMP consumables industry in Japan is estimated to reach a market size of US$ 180.4 million by 2033, thriving at a CAGR of 6.3%. Japan has a well-established and thriving pharmaceutical industry. The country is known for its advanced research and development capabilities, innovative drug discovery, and a strong focus on healthcare. The growth of the pharmaceutical industry in Japan drives the demand for GMP consumables.

Demand GMP Consumables is Rising Due to Adoption of Innovative Cleaning Solutions

Country South Korea
Market Size (US$ million) by End of Forecast Period (2033) US$ 55.9 million
CAGR % 2023 to End of Forecast (2033) 8.1%

The GMP consumables industry in South Korea is expected to reach a market size of US$ 55.9 million, expanding at a CAGR of 8.1% during the forecast period. South Korea is known for its technological advancements and automation in various industries, including pharmaceutical manufacturing. The adoption of advanced manufacturing technologies, robotics, and digitalization in GMP processes improves efficiency, precision, and product quality. The integration of these technologies requires the use of specialized GMP consumables, driving market growth.

Category-Wise Insights

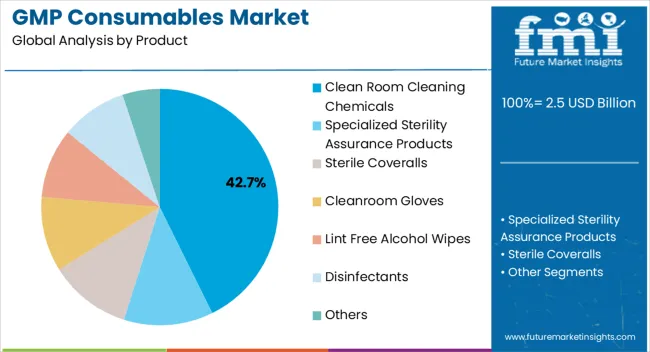
Clean Room Cleaning Chemicals to Dominate GMP Consumables with 6.1% CAGR through 2033

Cleanroom cleaning chemicals is expected to dominate the GMP consumables industry with a CAGR of 6.1% from 2023 to 2033. This segment captures a significant market share in 2023 due to its comphrehensive cleaning chemical & cleaning action.

Clean room cleaning chemicals are specifically formulated to meet the stringent cleanliness and disinfection requirements of controlled environments, such as clean rooms. They are designed to remove contaminants, including particles, microorganisms, and residues, from surfaces and equipment within the clean room. These chemicals help ensure compliance with GMP regulations and maintain the integrity of the manufacturing process and the quality of the final product.

Which End User is Widely Adopted the GMP Consumables?

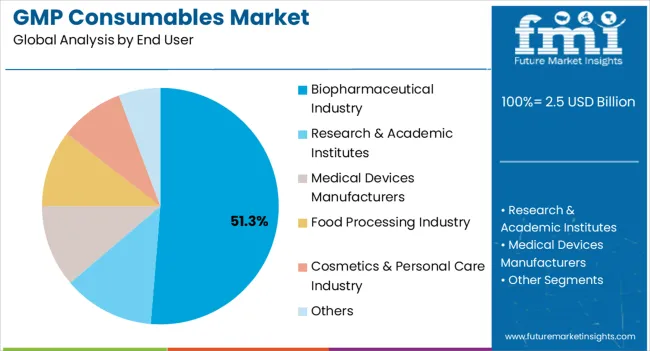
Biopharmaceutical industry is expected to dominate the GMP consumables industry with a CAGR of 6.5% from 2023 to 2033. GMP guidelines are crucial in the biopharmaceutical industry to ensure the consistent production of safe, pure, and effective biopharmaceutical products. GMP encompasses a set of quality standards and regulatory requirements that govern various aspects of manufacturing, including facility design, equipment, processes, personnel, and consumables. Compliance with GMP regulations is essential to meet regulatory approval, maintain product quality, and protect patient safety.

Get the data you need at a Fraction of the cost

Personalize your report by choosing insights you need
and save 40%!

How Key Players Stay Competitive in the GMP consumables Industry?

The GMP consumables is fiercely competitive, with many companies fighting for market dominance. To stay ahead of the competition in such a circumstance, essential players must develop effective cleaning techniques.

Key Strategies Used by the Participants

  • Product Development

Companies invest heavily in research and development to deliver novel products that improve efficiency, dependability, and cost-effectiveness. Product innovation allows businesses to differentiate themselves from their competition while also catering to the changing demands of their cleanrooms.

  • Strategic Alliances & Collaborations

Key industry leaders frequently develop strategic partnerships and collaborations with other companies in order to harness their strengths and increase their market reach. Companies might also gain access to new technology and markets through such agreements.

  • Expansion into Emerging Markets

The GMP Consumables is expanding rapidly in emerging regions such as China and India. Key firms are enhancing their distribution networks and developing local manufacturing facilities to increase their presence in these areas.

  • Acquisitions and mergers

Mergers and acquisitions are frequently used by key players in the GMP consumables business to consolidate their market position, extend their product range, and gain access to new markets.
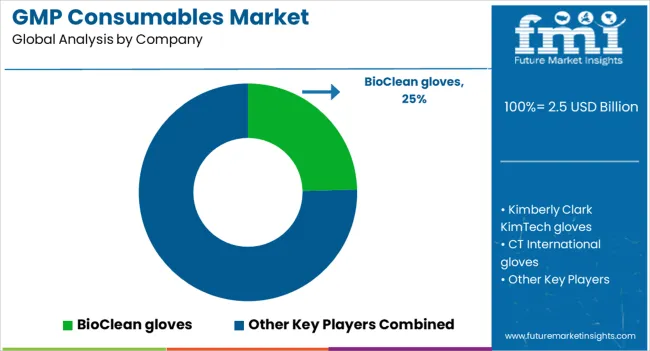
Key Players in the GMP Consumables Industry

  • BioClean gloves
  • Kimberly Clark KimTech gloves
  • CT International gloves
  • QRP gloves Inc.
  • Merck Millipore
  • Thermo Fisher Scientific
  • Saint-Gobain Performance Plastics
  • EMD Millipore
  • VWR International
  • GE Healthcare Life Sciences

Key Developments in the GMP Consumables:

  • In August 2022, Thermo Fisher Scientific Inc. to increase the size of its local medical device assembly facility and add more than 100 local employments, aims to invest $40 million.

Segmentation Analysis of the GMP Consumables

By Product:

  • Clean Room Cleaning Chemicals
  • Specialized Sterility Assurance Products
  • Sterile Coveralls
  • Cleanroom Gloves
  • Lint Free Alcohol Wipes
  • Disinfectants
  • Others

By End User:

  • Biopharmaceutical Industry
  • Research & Academic Institutes
  • Medical Devices Manufacturers
  • Food Processing Industry
  • Cosmetics & Personal Care Industry
  • Others

By Region:

  • North America
  • Latin America
  • Europe
  • East Asia
  • South Asia
  • Oceania
  • The Middle East & Africa

Frequently Asked Questions

How big is the GMP Consumables Market by 2033?

The projected revenue of the market by 2033 is US$ 4.33 billion.

What is the GMP Consumables Market CAGR for 2033?

The market CAGR for 2033 is projected to be 6.5%.

How Big is the GMP Consumables Market?

The market is valued at US$ 2.17 billion in 2023.

Which Region Holds a Significant Share of the GMP Consumables Market?

North America holds the largest market share.

Why is consumable management important in the pharmaceutical industry?

Consumable management is important in the pharmaceutical industry because it ensures the quality of pharmaceutical products.

Table of Content

1. Executive Summary

    1.1. Global Market Outlook

    1.2. Demand Side Trends

    1.3. Supply Side Trends

    1.4. Analysis and Recommendations

2. Market Overview

    2.1. Market Coverage / Taxonomy

    2.2. Market Definition / Scope / Limitations

    2.3. Inclusions and Exclusions

3. Key Market Trends

    3.1. Key Trends Impacting the Market

    3.2. Product Innovation / Development Trends

4. Value Added Insights

    4.1. Product Adoption/ Usage Analysis

    4.2. Product USPs/ Features

    4.3. Regulatory Landscape

    4.4. PESTEL Analysis

    4.5. Porter’s Analysis

5. Market Background

    5.1. Macro-Economic Factors

        5.1.1. Global GDP Growth Outlook

        5.1.2. Global Healthcare Expenditure Outlook

    5.2. Forecast Factors - Relevance & Impact

        5.2.1. Key Player’s Historic Growth

        5.2.2. Cost of GMP Consumables

        5.2.3. Favourable Government Regulations

        5.2.4. Rising Demand for Cleaning Solutions

        5.2.5. Technological Advancement in GMP Consumables

        5.2.6. Industry Consolidation and Partnerships

        5.2.7. Advancement in Cleanroom Gloves

    5.3. Dynamics

        5.3.1. Drivers

        5.3.2. Restraints

        5.3.3. Opportunity Analysis

6. Global Market Demand (in Value or Size in US$ Mn) Analysis 2017 to 2022 and Forecast, 2023 to 2033

    6.1. Historical Market Value (US$ Million) Analysis, 2017 to 2022

    6.2. Current and Future Market Value (US$ Million) Projections, 2023 to 2033

        6.2.1. Y-o-Y Growth Trend Analysis

        6.2.2. Absolute $ Opportunity Analysis

7. Global Market Analysis 2017 to 2022 and Forecast 2023 to 2033, By Product

    7.1. Introduction / Key Findings

    7.2. Historical Market Size (US$ Million) Analysis By Product, 2017 to 2022

    7.3. Current and Future Market Size (US$ Million) Analysis and Forecast By Product, 2023 to 2033

        7.3.1. Clean Room Cleaning Chemicals

        7.3.2. Specialized Sterility Assurance Products

        7.3.3. Sterile Coveralls

        7.3.4. Cleanroom Gloves

        7.3.5. Lint Free Alcohol Wipes

        7.3.6. Disinfectants

        7.3.7. Others

    7.4. Market Attractiveness Analysis By Product

8. Global Market Analysis 2017 to 2022 and Forecast 2023 to 2033, By End User

    8.1. Introduction / Key Findings

    8.2. Historical Market Size (US$ Million) Analysis By End User, 2017 to 2022

    8.3. Current and Future Market Size (US$ Million) Analysis and Forecast By End User, 2023 to 2033

        8.3.1. Biopharmaceutical Industry

        8.3.2. Research & Academic Institutes

        8.3.3. Medical Devices Manufacturers

        8.3.4. Food Processing Industry

        8.3.5. Cosmetics & Personal Care Industry

        8.3.6. Others

    8.4. Market Attractiveness Analysis By End User

9. Global Market Analysis 2017 to 2022 and Forecast 2023 to 2033, by Region

    9.1. Introduction

    9.2. Historical Market Size (US$ Million)  Analysis By Region, 2017 to 2022

    9.3. Current and Future Market Size (US$ Million)  Analysis and Forecast By Region, 2023 to 2033

        9.3.1. North America

        9.3.2. Latin America

        9.3.3. Europe

        9.3.4. South Asia

        9.3.5. East Asia

        9.3.6. Oceania

        9.3.7. Middle East and Africa (Middle East & Africa)

    9.4. Market Attractiveness Analysis By Region

10. North America Market Analysis 2017 to 2022 and Forecast 2023 to 2033

    10.1. Introduction

    10.2. Historical Market Size (US$ Million) Analysis By Market Taxonomy, 2017 to 2022

    10.3. Current and Future Market Size (US$ Million) Analysis and Forecast By Market Taxonomy, 2023 to 2033

        10.3.1. By Country

            10.3.1.1. USA

            10.3.1.2. Canada

        10.3.2. By Product

        10.3.3. By End User

    10.4. Market Attractiveness Analysis

        10.4.1. By Country

        10.4.2. By Product

        10.4.3. By End User

    10.5. Country Level Analysis & Forecast

        10.5.1. USA Market Analysis

            10.5.1.1. Introduction

            10.5.1.2. Market Analysis and Forecast by Market Taxonomy

                10.5.1.2.1. By Product

                10.5.1.2.2. By End User

        10.5.2. Canada Market Analysis

            10.5.2.1. Introduction

            10.5.2.2. Market Analysis and Forecast by Market Taxonomy

                10.5.2.2.1. By Product

                10.5.2.2.2. By End User

    10.6. Market Trends

    10.7. Key Market Participants - Intensity Mapping

    10.8. Drivers and Restraints - Impact Analysis

11. Latin America Market Analysis 2017 to 2022 and Forecast 2023 to 2033

    11.1. Introduction

    11.2. Historical Market Size (US$ Million) Analysis By Market Taxonomy, 2017 to 2022

    11.3. Current and Future Market Size (US$ Million) Analysis and Forecast By Market Taxonomy, 2023 to 2033

        11.3.1. By Country

            11.3.1.1. Brazil

            11.3.1.2. Mexico

            11.3.1.3. Argentina

            11.3.1.4. Rest of Latin America

        11.3.2. By Product

        11.3.3. By End User

    11.4. Market Attractiveness Analysis

        11.4.1. By Country

        11.4.2. By Product

        11.4.3. By End User

    11.5. Country Level Analysis & Forecast

        11.5.1. Brazil Market Analysis

            11.5.1.1. Introduction

            11.5.1.2. Market Analysis and Forecast by Market Taxonomy

                11.5.1.2.1. By Product

                11.5.1.2.2. By End User

        11.5.2. Mexico Market Analysis

            11.5.2.1. Introduction

            11.5.2.2. Market Analysis and Forecast by Market Taxonomy

                11.5.2.2.1. By Product

                11.5.2.2.2. By End User

        11.5.3. Argentina Market Analysis

            11.5.3.1. Introduction

            11.5.3.2. Market Analysis and Forecast by Market Taxonomy

                11.5.3.2.1. By Product

                11.5.3.2.2. By End User

    11.6. Market Trends

    11.7. Key Market Participants - Intensity Mapping

    11.8. Drivers and Restraints - Impact Analysis

12. Europe Market Analysis 2017 to 2022 and Forecast 2023 to 2033

    12.1. Introduction

    12.2. Historical Market Size (US$ Million) Analysis By Market Taxonomy, 2017 to 2022

    12.3. Current and Future Market Size (US$ Million) Analysis and Forecast By Market Taxonomy, 2023 to 2033

        12.3.1. By Country

            12.3.1.1. Germany

            12.3.1.2. France

            12.3.1.3. Italy

            12.3.1.4. UK

            12.3.1.5. Spain

            12.3.1.6. Russia

            12.3.1.7. BENELUX

            12.3.1.8. Rest of Europe

        12.3.2. By Product

        12.3.3. By End User

    12.4. Market Attractiveness Analysis

        12.4.1. By Country

        12.4.2. By Product

        12.4.3. By End User

    12.5. Country Level Analysis & Forecast

        12.5.1. Germany Market Analysis

            12.5.1.1. Introduction

            12.5.1.2. Market Analysis and Forecast by Market Taxonomy

                12.5.1.2.1. By Product

                12.5.1.2.2. By End User

        12.5.2. France Market Analysis

            12.5.2.1. Introduction

            12.5.2.2. Market Analysis and Forecast by Market Taxonomy

                12.5.2.2.1. By Product

                12.5.2.2.2. By End User

        12.5.3. Italy Market Analysis

            12.5.3.1. Introduction

            12.5.3.2. Market Analysis and Forecast by Market Taxonomy

                12.5.3.2.1. By Product

                12.5.3.2.2. By End User

        12.5.4. UK Market Analysis

            12.5.4.1. Introduction

            12.5.4.2. Market Analysis and Forecast by Market Taxonomy

                12.5.4.2.1. By Product

                12.5.4.2.2. By End User

        12.5.5. Spain Market Analysis

            12.5.5.1. Introduction

            12.5.5.2. Market Analysis and Forecast by Market Taxonomy

                12.5.5.2.1. By Product

                12.5.5.2.2. By End User

        12.5.6. Russia Market Analysis

            12.5.6.1. Introduction

            12.5.6.2. Market Analysis and Forecast by Market Taxonomy

                12.5.6.2.1. By Product

                12.5.6.2.2. By End User

        12.5.7. BENELUX Market Analysis

            12.5.7.1. Introduction

            12.5.7.2. Market Analysis and Forecast by Market Taxonomy

                12.5.7.2.1. By Product

                12.5.7.2.2. By End User

    12.6. Market Trends

    12.7. Key Market Participants - Intensity Mapping

    12.8. Drivers and Restraints - Impact Analysis

13. South Asia Market Analysis 2017 to 2022 and Forecast 2023 to 2033

    13.1. Introduction

    13.2. Historical Market Size (US$ Million) Analysis By Market Taxonomy, 2017 to 2022

    13.3. Current and Future Market Size (US$ Million) Analysis and Forecast By Market Taxonomy, 2023 to 2033

        13.3.1. By Country

            13.3.1.1. India

            13.3.1.2. Thailand

            13.3.1.3. Indonesia

            13.3.1.4. Malaysia

            13.3.1.5. Rest of South Asia

        13.3.2. By Product

        13.3.3. By End User

    13.4. Market Attractiveness Analysis

        13.4.1. By Country

        13.4.2. By Product

        13.4.3. By End User

    13.5. Country Level Analysis & Forecast

        13.5.1. India Market Analysis

            13.5.1.1. Introduction

            13.5.1.2. Market Analysis and Forecast by Market Taxonomy

                13.5.1.2.1. By Product

                13.5.1.2.2. By End User

        13.5.2. Thailand Market Analysis

            13.5.2.1. Introduction

            13.5.2.2. Market Analysis and Forecast by Market Taxonomy

                13.5.2.2.1. By Product

                13.5.2.2.2. By End User

        13.5.3. Indonesia Market Analysis

            13.5.3.1. Introduction

            13.5.3.2. Market Analysis and Forecast by Market Taxonomy

                13.5.3.2.1. By Product

                13.5.3.2.2. By End User

        13.5.4. Malaysia Market Analysis

            13.5.4.1. Introduction

            13.5.4.2. Market Analysis and Forecast by Market Taxonomy

                13.5.4.2.1. By Product

                13.5.4.2.2. By End User

    13.6. Market Trends

    13.7. Key Market Participants - Intensity Mapping

    13.8. Drivers and Restraints - Impact Analysis

14. East Asia Market Analysis 2017 to 2022 and Forecast 2023 to 2033

    14.1. Introduction

    14.2. Historical Market Size (US$ Million) Analysis By Market Taxonomy, 2017 to 2022

    14.3. Current and Future Market Size (US$ Million) Analysis and Forecast By Market Taxonomy, 2023 to 2033

        14.3.1. By Country

            14.3.1.1. China

            14.3.1.2. Japan

            14.3.1.3. South Korea

        14.3.2. By Product

        14.3.3. By End User

    14.4. Market Attractiveness Analysis

        14.4.1. By Country

        14.4.2. By Product

        14.4.3. By End User

    14.5. Country Level Analysis & Forecast

        14.5.1. China Market Analysis

            14.5.1.1. Introduction

            14.5.1.2. Market Analysis and Forecast by Market Taxonomy

                14.5.1.2.1. By Product

                14.5.1.2.2. By End User

        14.5.2. Japan Market Analysis

            14.5.2.1. Introduction

            14.5.2.2. Market Analysis and Forecast by Market Taxonomy

                14.5.2.2.1. By Product

                14.5.2.2.2. By End User

        14.5.3. South Korea Market Analysis

            14.5.3.1. Introduction

            14.5.3.2. Market Analysis and Forecast by Market Taxonomy

                14.5.3.2.1. By Product

                14.5.3.2.2. By End User

    14.6. Market Trends

    14.7. Key Market Participants - Intensity Mapping

    14.8. Drivers and Restraints - Impact Analysis

15. Oceania Market Analysis 2017 to 2022 and Forecast 2023 to 2033

    15.1. Introduction

    15.2. Historical Market Size (US$ Million) Analysis By Market Taxonomy, 2017 to 2022

    15.3. Current and Future Market Size (US$ Million) Analysis and Forecast By Market Taxonomy, 2023 to 2033

        15.3.1. By Country

            15.3.1.1. Australia

            15.3.1.2. New Zealand

        15.3.2. By Product

        15.3.3. By Application

        15.3.4. By End User

    15.4. Market Attractiveness Analysis

        15.4.1. By Country

        15.4.2. By Product

        15.4.3. By End User

    15.5. Country Level Analysis & Forecast

        15.5.1. Australia Market Analysis

            15.5.1.1. Introduction

            15.5.1.2. Market Analysis and Forecast by Market Taxonomy

                15.5.1.2.1. By Product

                15.5.1.2.2. By End User

        15.5.2. New Zealand Market Analysis

            15.5.2.1. Introduction

            15.5.2.2. Market Analysis and Forecast by Market Taxonomy

                15.5.2.2.1. By Product

                15.5.2.2.2. By End User

    15.6. Market Trends

    15.7. Key Market Participants - Intensity Mapping

    15.8. Drivers and Restraints - Impact Analysis

16. Middle East and Africa Market Analysis 2017 to 2022 and Forecast 2023 to 2033

    16.1. Introduction

    16.2. Historical Market Size (US$ Million) Analysis By Market Taxonomy, 2017 to 2022

    16.3. Current and Future Market Size (US$ Million) Analysis and Forecast By Market Taxonomy, 2023 to 2033

        16.3.1. By Country

            16.3.1.1. GCC Countries

            16.3.1.2. Türkiye

            16.3.1.3. Northern Africa

            16.3.1.4. South Africa

            16.3.1.5. Rest of Middle East and Africa

        16.3.2. By Product

        16.3.3. By End User

    16.4. Market Attractiveness Analysis

        16.4.1. By Country

        16.4.2. By Product

        16.4.3. By End User

    16.5. Country Level Analysis & Forecast

        16.5.1. GCC Countries Market Analysis

            16.5.1.1. Introduction

            16.5.1.2. Market Analysis and Forecast by Market Taxonomy

                16.5.1.2.1. By Product

                16.5.1.2.2. By End User

        16.5.2. Türkiye Market Analysis

            16.5.2.1. Introduction

            16.5.2.2. Market Analysis and Forecast by Market Taxonomy

                16.5.2.2.1. By Product

                16.5.2.2.2. By End User

        16.5.3. Northern Africa Market Analysis

            16.5.3.1. Introduction

            16.5.3.2. Market Analysis and Forecast by Market Taxonomy

                16.5.3.2.1. By Product

                16.5.3.2.2. By End User

        16.5.4. South Africa Market Analysis

            16.5.4.1. Introduction

            16.5.4.2. Market Analysis and Forecast by Market Taxonomy

                16.5.4.2.1. By Product

                16.5.4.2.2. By End User

    16.6. Market Trends

    16.7. Key Market Participants - Intensity Mapping

    16.8. Drivers and Restraints - Impact Analysis

17. Market Structure Analysis

    17.1. Market Analysis by Tier of Companies

    17.2. Market Share Analysis of Top Players

    17.3. Market Presence Analysis

18. Competition Analysis

    18.1. Competition Dashboard

    18.2. Branding and Promotional Strategies, By Key Players

    18.3. Key Development Analysis

    18.4. Competition Deep Dive

        18.4.1. BioClean gloves

            18.4.1.1. Overview

            18.4.1.2. Product Portfolio

            18.4.1.3. Key Financials

            18.4.1.4. Sales Footprint

            18.4.1.5. SWOT Analysis

            18.4.1.6. Strategy Overview

                18.4.1.6.1. Marketing Strategy

                18.4.1.6.2. Product Strategy

                18.4.1.6.3. Channel Strategy

        18.4.2. Kimberly Clark KimTech gloves

            18.4.2.1. Overview

            18.4.2.2. Product Portfolio

            18.4.2.3. Key Financials

            18.4.2.4. Sales Footprint

            18.4.2.5. SWOT Analysis

            18.4.2.6. Strategy Overview

                18.4.2.6.1. Marketing Strategy

                18.4.2.6.2. Product Strategy

                18.4.2.6.3. Channel Strategy

        18.4.3. CT International gloves

            18.4.3.1. Overview

            18.4.3.2. Product Portfolio

            18.4.3.3. Key Financials

            18.4.3.4. Sales Footprint

            18.4.3.5. SWOT Analysis

            18.4.3.6. Strategy Overview

                18.4.3.6.1. Marketing Strategy

                18.4.3.6.2. Product Strategy

                18.4.3.6.3. Channel Strategy

        18.4.4. QRP gloves Inc.

            18.4.4.1. Overview

            18.4.4.2. Product Portfolio

            18.4.4.3. Key Financials

            18.4.4.4. Sales Footprint

            18.4.4.5. SWOT Analysis

            18.4.4.6. Strategy Overview

                18.4.4.6.1. Marketing Strategy

                18.4.4.6.2. Product Strategy

                18.4.4.6.3. Channel Strategy

        18.4.5. Merck Millipore

            18.4.5.1. Overview

            18.4.5.2. Product Portfolio

            18.4.5.3. Key Financials

            18.4.5.4. Sales Footprint

            18.4.5.5. SWOT Analysis

            18.4.5.6. Strategy Overview

                18.4.5.6.1. Marketing Strategy

                18.4.5.6.2. Product Strategy

                18.4.5.6.3. Channel Strategy

        18.4.6. Thermo Fisher Scientific

            18.4.6.1. Overview

            18.4.6.2. Product Portfolio

            18.4.6.3. Key Financials

            18.4.6.4. Sales Footprint

            18.4.6.5. SWOT Analysis

            18.4.6.6. Strategy Overview

                18.4.6.6.1. Marketing Strategy

                18.4.6.6.2. Product Strategy

                18.4.6.6.3. Channel Strategy

        18.4.7. Saint-Gobain Performance Plastics

            18.4.7.1. Overview

            18.4.7.2. Product Portfolio

            18.4.7.3. Key Financials

            18.4.7.4. Sales Footprint

            18.4.7.5. SWOT Analysis

            18.4.7.6. Strategy Overview

                18.4.7.6.1. Marketing Strategy

                18.4.7.6.2. Product Strategy

                18.4.7.6.3. Channel Strategy

        18.4.8. EMD Millipore

            18.4.8.1. Overview

            18.4.8.2. Product Portfolio

            18.4.8.3. Key Financials

            18.4.8.4. Sales Footprint

            18.4.8.5. SWOT Analysis

            18.4.8.6. Strategy Overview

                18.4.8.6.1. Marketing Strategy

                18.4.8.6.2. Product Strategy

                18.4.8.6.3. Channel Strategy

        18.4.9. VWR International

            18.4.9.1. Overview

            18.4.9.2. Product Portfolio

            18.4.9.3. Key Financials

            18.4.9.4. Sales Footprint

            18.4.9.5. SWOT Analysis

            18.4.9.6. Strategy Overview

                18.4.9.6.1. Marketing Strategy

                18.4.9.6.2. Product Strategy

                18.4.9.6.3. Channel Strategy

        18.4.10. GE Healthcare Life Sciences

            18.4.10.1. Overview

            18.4.10.2. Product Portfolio

            18.4.10.3. Key Financials

            18.4.10.4. Sales Footprint

            18.4.10.5. SWOT Analysis

            18.4.10.6. Strategy Overview

                18.4.10.6.1. Marketing Strategy

                18.4.10.6.2. Product Strategy

                18.4.10.6.3. Channel Strategy

19. Assumptions and Acronyms Used

20. Research Methodology

List of Tables

Table 01: Global Market Value (US$ Million) Analysis and Forecast 2017 to 2033, by Product

Table 02: Global Market Value (US$ Million) Analysis and Forecast 2017 to 2033, by End User

Table 03: Global Market Value (US$ Million) Analysis and Forecast 2017 to 2033, by Region

Table 04: North America Market Value (US$ Million) Analysis 2017 to 2022 and Forecast 2023 to 2033, by Country

Table 05: North America Market Value (US$ Million) Analysis and Forecast 2017 to 2033, by Product

Table 06: North America Market Value (US$ Million) Analysis and Forecast 2017 to 2033, by End User

Table 07: Latin America Market Value (US$ Million) Analysis 2017 to 2022 and Forecast 2023 to 2033, by Country

Table 08: Latin America Market Value (US$ Million) Analysis and Forecast 2017 to 2033, by Product

Table 09: Latin America Market Value (US$ Million) Analysis and Forecast 2017 to 2033, by End User

Table 10: Europe Market Value (US$ Million) Analysis 2017 to 2022 and Forecast 2023 to 2033, by Country

Table 11: Europe Market Value (US$ Million) Analysis and Forecast 2017 to 2033, by Product

Table 12: Europe Market Value (US$ Million) Analysis and Forecast 2017 to 2033, by End User

Table 13: South Asia Market Value (US$ Million) Analysis 2017 to 2022 and Forecast 2023 to 2033, by Country

Table 14: South Asia Market Value (US$ Million) Analysis and Forecast 2017 to 2033, by Product

Table 15: South Asia Market Value (US$ Million) Analysis and Forecast 2017 to 2033, by End User

Table 16: East Asia Market Value (US$ Million) Analysis 2017 to 2022 and Forecast 2023 to 2033, by Country

Table 17: East Asia Market Value (US$ Million) Analysis and Forecast 2017 to 2033, by Product

Table 18: East Asia Market Value (US$ Million) Analysis and Forecast 2017 to 2033, by End User

Table 19: Oceania Market Value (US$ Million) Analysis 2017 to 2022 and Forecast 2023 to 2033, by Country

Table 20: Oceania Market Value (US$ Million) Analysis and Forecast 2017 to 2033, by Product

Table 21: Oceania Market Value (US$ Million) Analysis and Forecast 2017 to 2033, by End User

Table 22: Middle East & Africa Market Value (US$ Million) Analysis 2017 to 2022 and Forecast 2023 to 2033, by Country

Table 23: Middle East & Africa Market Value (US$ Million) Analysis and Forecast 2017 to 2033, by Product

Table 24: Middle East & Africa Market Value (US$ Million) Analysis and Forecast 2017 to 2033, by End User

List of Charts

Figure 01: Global Market Value (US$ Million) Analysis, 2017 to 2022

Figure 02: Global Market Forecast & Y-o-Y Growth, 2023 to 2033

Figure 03: Global Market Absolute $ Opportunity (US$ Million) Analysis, 2023 to 2033

Figure 04: Global Market Value Share (%) Analysis 2023 and 2033, by Product

Figure 05: Global Market Y-o-Y Growth (%) Analysis 2023 to 2033, by Product

Figure 06: Global Market Attractiveness Analysis 2023 to 2033, by Product

Figure 07: Global Market Value Share (%) Analysis 2023 and 2033, by End User

Figure 08: Global Market Y-o-Y Growth (%) Analysis 2023 to 2033, by End User

Figure 09: Global Market Attractiveness Analysis 2023 to 2033, by End User

Figure 10: Global Market Value Share (%) Analysis 2023 and 2033, by Region

Figure 11: Global Market Y-o-Y Growth (%) Analysis 2023 to 2033, by Region

Figure 12: Global Market Attractiveness Analysis 2023 to 2033, by Region

Figure 13: North America Market Value (US$ Million) Analysis, 2017 to 2022

Figure 14: North America Market Value (US$ Million) Forecast, 2023 to 2033

Figure 15: North America Market Value Share, by Product (2023 E)

Figure 16: North America Market Value Share, by End User (2023 E)

Figure 17: North America Market Value Share, by Country (2023 E)

Figure 18: North America Market Attractiveness Analysis by Product, 2023 to 2033

Figure 19: North America Market Attractiveness Analysis by End User, 2023 to 2033

Figure 20: North America Market Attractiveness Analysis by Country, 2023 to 2033

Figure 21: USA Market Value Proportion Analysis, 2022

Figure 22: Global Vs. USA Growth Comparison

Figure 23: USA Market Share Analysis (%) by Product, 2022 & 2033

Figure 24: USA Market Share Analysis (%) by End User, 2022 & 2033

Figure 25: Canada Market Value Proportion Analysis, 2022

Figure 26: Global Vs. Canada. Growth Comparison

Figure 27: Canada Market Share Analysis (%) by Product, 2023 & 2033

Figure 28: Canada Market Share Analysis (%) by End User, 2023 & 2033

Figure 29: Latin America Market Value (US$ Million) Analysis, 2017 to 2022

Figure 30: Latin America Market Value (US$ Million) Forecast, 2023 to 2033

Figure 31: Latin America Market Value Share, by Product (2023 E)

Figure 32: Latin America Market Value Share, by End User (2023 E)

Figure 33: Latin America Market Value Share, by Country (2023 E)

Figure 34: Latin America Market Attractiveness Analysis by Product, 2023 to 2033

Figure 35: Latin America Market Attractiveness Analysis by End User, 2023 to 2033

Figure 36: Latin America Market Attractiveness Analysis by Country, 2023 to 2033

Figure 37: Mexico Market Value Proportion Analysis, 2022

Figure 38: Global Vs Mexico Growth Comparison

Figure 39: Mexico Market Share Analysis (%) by Product, 2023 & 2033

Figure 40: Mexico Market Share Analysis (%) by End User, 2023 & 2033

Figure 41: Brazil Market Value Proportion Analysis, 2022

Figure 42: Global Vs. Brazil. Growth Comparison

Figure 43: Brazil Market Share Analysis (%) by Product, 2023 & 2033

Figure 44: Brazil Market Share Analysis (%) by End User, 2023 & 2033

Figure 45: Argentina Market Value Proportion Analysis, 2022

Figure 46: Global Vs Argentina Growth Comparison

Figure 47: Argentina Market Share Analysis (%) by Product, 2023 & 2033

Figure 48: Argentina Market Share Analysis (%) by End User, 2023 & 2033

Figure 49: Europe Market Value (US$ Million) Analysis, 2017 to 2022

Figure 50: Europe Market Value (US$ Million) Forecast, 2023 to 2033

Figure 51: Europe Market Value Share, by Product (2023 E)

Figure 52: Europe Market Value Share, by End User (2023 E)

Figure 53: Europe Market Value Share, by Country (2023 E)

Figure 54: Europe Market Attractiveness Analysis by Product, 2023 to 2033

Figure 55: Europe Market Attractiveness Analysis by End User, 2023 to 2033

Figure 56: Europe Market Attractiveness Analysis by Country, 2023 to 2033

Figure 57: UK Market Value Proportion Analysis, 2022

Figure 58: Global Vs. UK Growth Comparison

Figure 59: UK Market Share Analysis (%) by Product, 2023 & 2033

Figure 60: UK Market Share Analysis (%) by End User, 2023 & 2033

Figure 61: Germany Market Value Proportion Analysis, 2022

Figure 62: Global Vs. Germany Growth Comparison

Figure 63: Germany Market Share Analysis (%) by Product, 2023 & 2033

Figure 64: Germany Market Share Analysis (%) by End User, 2023 & 2033

Figure 65: Italy Market Value Proportion Analysis, 2022

Figure 66: Global Vs. Italy Growth Comparison

Figure 67: Italy Market Share Analysis (%) by Product, 2023 & 2033

Figure 68: Italy Market Share Analysis (%) by End User, 2023 & 2033

Figure 69: France Market Value Proportion Analysis, 2022

Figure 70: Global Vs France Growth Comparison

Figure 71: France Market Share Analysis (%) by Product, 2023 & 2033

Figure 72: France Market Share Analysis (%) by End User, 2023 & 2033

Figure 73: Spain Market Value Proportion Analysis, 2022

Figure 74: Global Vs Spain Growth Comparison

Figure 75: Spain Market Share Analysis (%) by Product, 2023 & 2033

Figure 76: Spain Market Share Analysis (%) by End User, 2023 & 2033

Figure 77: Russia Market Value Proportion Analysis, 2022

Figure 78: Global Vs Russia Growth Comparison

Figure 79: Russia Market Share Analysis (%) by Product, 2023 & 2033

Figure 80: Russia Market Share Analysis (%) by End User, 2023 & 2033

Figure 81: BENELUX Market Value Proportion Analysis, 2022

Figure 82: Global Vs BENELUX Growth Comparison

Figure 83: BENELUX Market Share Analysis (%) by Product, 2023 & 2033

Figure 84: BENELUX Market Share Analysis (%) by End User, 2023 & 2033

Figure 85: East Asia Market Value (US$ Million) Analysis, 2017 to 2022

Figure 86: East Asia Market Value (US$ Million) Forecast, 2023 to 2033

Figure 87: East Asia Market Value Share, by Product (2023 E)

Figure 88: East Asia Market Value Share, by End User (2023 E)

Figure 89: East Asia Market Value Share, by Country (2023 E)

Figure 90: East Asia Market Attractiveness Analysis by Product, 2023 to 2033

Figure 91: East Asia Market Attractiveness Analysis by End User, 2023 to 2033

Figure 92: East Asia Market Attractiveness Analysis by Country, 2023 to 2033

Figure 93: China Market Value Proportion Analysis, 2022

Figure 94: Global Vs. China Growth Comparison

Figure 95: China Market Share Analysis (%) by Product, 2023 & 2033

Figure 96: China Market Share Analysis (%) by End User, 2023 & 2033

Figure 97: Japan Market Value Proportion Analysis, 2022

Figure 98: Global Vs. Japan Growth Comparison

Figure 99: Japan Market Share Analysis (%) by Product, 2023 & 2033

Figure 100: Japan Market Share Analysis (%) by End User, 2023 & 2033

Figure 101: South Korea Market Value Proportion Analysis, 2022

Figure 102: Global Vs South Korea Growth Comparison

Figure 103: South Korea Market Share Analysis (%) by Product, 2023 & 2033

Figure 104: South Korea Market Share Analysis (%) by End User, 2023 & 2033

Figure 105: South Asia Market Value (US$ Million) Analysis, 2017 to 2022

Figure 106: South Asia Market Value (US$ Million) Forecast, 2023 to 2033

Figure 107: South Asia Market Value Share, by Product (2023 E)

Figure 108: South Asia Market Value Share, by End User (2023 E)

Figure 109: South Asia Market Value Share, by Country (2023 E)

Figure 110: South Asia Market Attractiveness Analysis by Product, 2023 to 2033

Figure 111: South Asia Market Attractiveness Analysis by End User, 2023 to 2033

Figure 112: South Asia Market Attractiveness Analysis by Country, 2023 to 2033

Figure 113: India Market Value Proportion Analysis, 2022

Figure 114: Global Vs. India Growth Comparison

Figure 115: India Market Share Analysis (%) by Product, 2023 & 2033

Figure 116: India Market Share Analysis (%) by End User, 2023 & 2033

Figure 117: Indonesia Market Value Proportion Analysis, 2022

Figure 118: Global Vs. Indonesia Growth Comparison

Figure 119: Indonesia Market Share Analysis (%) by Product, 2023 & 2033

Figure 120: Indonesia Market Share Analysis (%) by End User, 2023 & 2033

Figure 121: Malaysia Market Value Proportion Analysis, 2022

Figure 122: Global Vs. Malaysia Growth Comparison

Figure 123: Malaysia Market Share Analysis (%) by Product, 2023 & 2033

Figure 124: Malaysia Market Share Analysis (%) by End User, 2023 & 2033

Figure 125: Thailand Market Value Proportion Analysis, 2022

Figure 126: Global Vs. Thailand Growth Comparison

Figure 127: Thailand Market Share Analysis (%) by Product, 2023 & 2033

Figure 128: Thailand Market Share Analysis (%) by End User, 2023 & 2033

Figure 129: Oceania Market Value (US$ Million) Analysis, 2017 to 2022

Figure 130: Oceania Market Value (US$ Million) Forecast, 2023 to 2033

Figure 131: Oceania Market Value Share, by Product (2023 E)

Figure 132: Oceania Market Value Share, by End User (2023 E)

Figure 133: Oceania Market Value Share, by Country (2023 E)

Figure 134: Oceania Market Attractiveness Analysis by Product, 2023 to 2033

Figure 135: Oceania Market Attractiveness Analysis by End User, 2023 to 2033

Figure 136: Oceania Market Attractiveness Analysis by Country, 2023 to 2033

Figure 137: Australia Market Value Proportion Analysis, 2022

Figure 138: Global Vs. Australia Growth Comparison

Figure 139: Australia Market Share Analysis (%) by Product, 2023 & 2033

Figure 140: Australia Market Share Analysis (%) by End User, 2023 & 2033

Figure 141: New Zealand Market Value Proportion Analysis, 2022

Figure 142: Global Vs New Zealand Growth Comparison

Figure 143: New Zealand Market Share Analysis (%) by Product, 2023 & 2033

Figure 144: New Zealand Market Share Analysis (%) by End User, 2023 & 2033

Figure 145: Middle East & Africa Market Value (US$ Million) Analysis, 2017 to 2022

Figure 146: Middle East & Africa Market Value (US$ Million) Forecast, 2023 to 2033

Figure 147: Middle East & Africa Market Value Share, by Product (2023 E)

Figure 148: Middle East & Africa Market Value Share, by End User (2023 E)

Figure 149: Middle East & Africa Market Value Share, by Country (2023 E)

Figure 150: Middle East & Africa Market Attractiveness Analysis by Product, 2023 to 2033

Figure 151: Middle East & Africa Market Attractiveness Analysis by End User, 2023 to 2033

Figure 152: Middle East & Africa Market Attractiveness Analysis by Country, 2023 to 2033

Figure 153: GCC Countries Market Value Proportion Analysis, 2022

Figure 154: Global Vs GCC Countries Growth Comparison

Figure 155: GCC Countries Market Share Analysis (%) by Product, 2023 & 2033

Figure 156: GCC Countries Market Share Analysis (%) by End User, 2023 & 2033

Figure 157: Türkiye Market Value Proportion Analysis, 2022

Figure 158: Global Vs. Türkiye Growth Comparison

Figure 159: Türkiye Market Share Analysis (%) by Product, 2023 & 2033

Figure 160: Türkiye Market Share Analysis (%) by End User, 2023 & 2033

Figure 161: South Africa Market Value Proportion Analysis, 2022

Figure 162: Global Vs. South Africa Growth Comparison

Figure 163: South Africa Market Share Analysis (%) by Product, 2023 & 2033

Figure 164: South Africa Market Share Analysis (%) by End User, 2023 & 2033

Figure 165: North Africa Market Value Proportion Analysis, 2022

Figure 166: Global Vs North Africa Growth Comparison

Figure 167: Northern Africa Market Share Analysis (%) by Product, 2023 & 2033

Figure 168: North Africa Market Share Analysis (%) by End User, 2023 & 2033

Explore Healthcare Insights

View Reports