GMP Cleaning Services Market Size and Share Forecast Outlook 2025 to 2035

The GMP cleaning services market is expected to record a valuation of USD 1,126.7 million in 2025 and USD 1,683.9 million in 2035, with reflecting a growth of USD 557.2 million across the ten-year span. The overall expansion represents a CAGR of 4.1%.
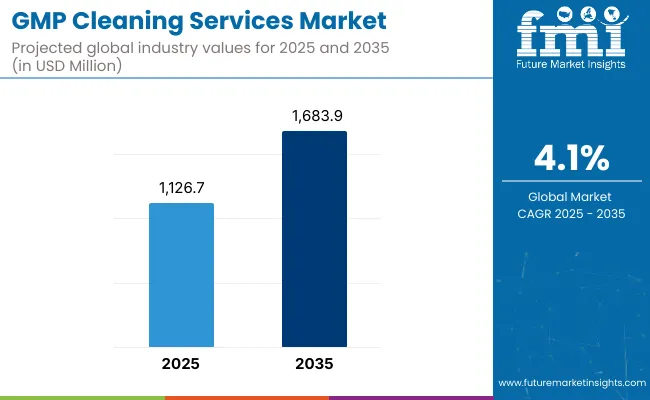
Quick Stats for GMP Cleaning Services Market

  • GMP Cleaning Services Market Value (2025): USD 1,126.7 million
  • GMP Cleaning Services Market Forecast Value (2035): USD 1,683.9 million
  • GMP Cleaning Services Market Forecast CAGR (2025 to 2035): 4.1%
  • Leading Segment in 2025 (Cleaning Method): Manual Cleaning (41.5%)
  • Key Growth Regions: North America, East Asia, and Europe
  • Top Key Players: ABM, The Budd Group, Servicon, OCS-Global Facilities Services Grp, SourceOne Building Maintenance, Advanced Cleanroom, GMPSOP, Atlantic Building Solutions, GMP Services inc., Diversified Maintenance, Pro-Pack Materials pte ltd, Cleanroom Facility Services and Allied Cleanrooms

Gmp Cleaning Services Market

Metric Value
GMP Cleaning Services Market in (2025E) USD 1,126.7 million
GMP Cleaning Services Market in (2035F) USD 1,683.9 million
Forecast CAGR (2025 to 2035) 4.1%

During the first five-year period from 2025 to 2030, the global GMP cleaning services market is projected to grow from USD 1,126.7 million to USD 1,377.4 million, adding USD 250.7 million in incremental revenue. This growth is primarily driven by pharmaceutical and biopharmaceutical manufacturers upgrading cleaning protocols in response to stricter FDA and EMA inspections. Onsite services remain dominant during this period with a 51.5% share, due to their alignment with GMP-compliant batch manufacturing, real-time validation needs, and risk-based cleaning strategies. Companies like Pfizer and Amgen continue to internalize cleaning of high-grade cleanrooms and aseptic fill lines due to contamination risk. However, a gradual shift toward contractual cleaning partnerships is observed in CDMOs and mid-sized biotech players, who prioritize scalability and cost control through third-party service providers.

From 2030 to 2035, the market is projected to expand from USD 1,377.4 million to USD 1,683.9 million, contributing an additional USD 306.5 million in revenue at a CAGR of 3.4%. Growth during this phase is propelled by the adoption of automation-based cleaning solutions, especially CIP and SIP systems, across new bio manufacturing facilities. Companies like Fujifilm Diosynth, WuXi Biologics, and Samsung Biologics are scaling large-scale biologics manufacturing sites where SIP integration becomes central to batch integrity and continuous production. Despite the rising adoption of managed services and remote GMP cleaning partnerships, Onsite services are projected to hold a ~45.6% market share by 2035, retaining dominance due to continued preference in high-risk sterile injectable plants and cell therapy units where in-house oversight is non-negotiable. The shift, however, marks growing maturity in hybrid cleaning models across CDMO infrastructure.

The GMP cleaning services market experienced steady expansion between 2020 and 2024, growing from USD 950.2 million to USD 1,095.2 million, driven by the rising regulatory stringency on cleaning validation and the expansion of GMP-compliant biologics facilities. The CAGR stood at 2.8%, higher than the upcoming decade due to the post-COVID spike in demand for cleanroom cleaning across vaccine and monoclonal antibody manufacturing plants.

During this phase, the Top manufacturers ABM, The Budd Group, Servicon collectively held ~25-26% of the global market. Their edge came from validated biocidal portfolios, global service coverage, and integration into CDMO cleaning protocols. Ultrasonic cleaning witnessed minimal traction during this time, holding around 6.6% share, due to limited compatibility with large-scale stainless-steel process equipment and closed-loop systems.

Why GMP Cleaning Services Market is Growing?

The GMP cleaning services market is growing due to a confluence of compliance-driven demand, biologics manufacturing scale-up, and CDMO outsourcing trends. Regulatory bodies such as the FDA, EMA, and PMDA have significantly tightened inspection norms around cleaning validation and aseptic contamination control, particularly after the surge in warning letters post-2020. This has compelled pharma and biotech manufacturers to invest in validated, traceable, and auditable cleaning workflows.

Apart from it the rapid expansion of biologics and cell/gene therapy facilities including high-throughput cleanroom zones, isolators, and modular aseptic suites has made manual cleaning operationally infeasible, accelerating adoption of CIP/SIP systems and contract cleaning services. Furthermore, CDMOs like Catalent, Samsung Biologics, and Lonza are outsourcing non-core services like general GMP cleaning to optimize batch lead times. The shift from product-based cleaning supplies to service-based delivery models, especially through multi-year managed service contracts, is creating a sticky, recurring revenue base amplifying market growth.

Segmental Analysis

Based on cleaning method the market is segmented into manual cleaning, automated cleaning, CIP (Clean-in‑Place), SIP (Steam‑in‑Place) and ultrasonic cleaning. Based on industry the market is segmented into pharmaceutical manufacturing, biotechnology & biopharma, medical device manufacturing, CMOs and CDMOs. Based on service deliver model the market is segregated into onsite services, centralized or shared facilities and managed / contractual services. Based on the region the market is segmented into North America, Latin America, East Asia, South Asia & Pacific, Western Europe and Middle East & Africa.
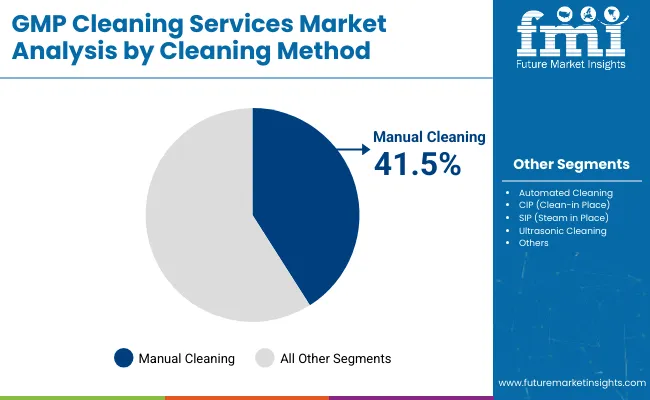
Insights on Segments Cleaning Method Segment with Dominance of Manual Cleaning Method

Gmp Cleaning Services Market By Cleaning Method

By Cleaning Method Market Value Share, 2025
Manual Cleaning 41.5%
Automated Cleaning 18.5%
CIP (Clean-in Place) 21.8%
SIP (Steam in Place) 11.5%
Ultrasonic Cleaning 6.6%

In 2025, Manual Cleaning holds the largest market share at 41.5%, retaining dominance despite growing industry interest in automated and CIP/SIP systems. This segment’s leadership is attributed to the widespread presence of legacy pharmaceutical manufacturing facilities, especially in developing markets and older sites in Europe and North America, where retrofitting automated systems is cost-prohibitive. Additionally, manual cleaning offers greater flexibility for complex or irregular equipment geometries that cannot be easily integrated into CIP systems.

The practice remains entrenched in oral solid dosage plants, compounding areas, and non-aseptic zones, where human-led visual inspection and cleaning remain viable and auditable. While automation is gaining traction in biologics, the manual approach persists due to its lower capital intensity, ease of validation, and the availability of GMP-trained cleaning personnel under SOP-driven frameworks.
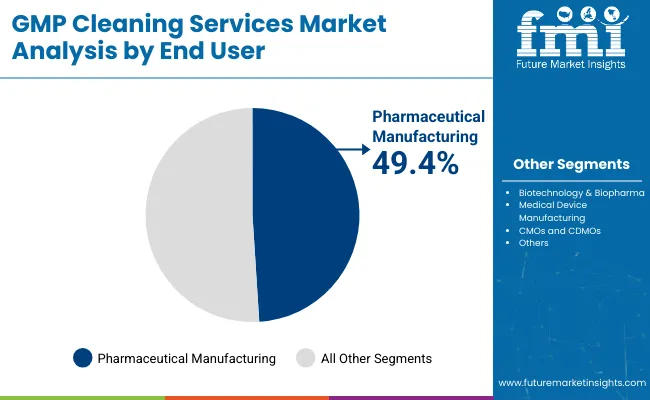
Insights on Segments Industry Segment with Dominance of Pharmaceutical Manufacturing

Gmp Cleaning Services Market By End User

By End User Market Value Share, 2025
Pharmaceutical Manufacturing 49.4%
Biotechnology & Biopharma 26.5%
Medical Device Manufacturing 16.1%
CMOs and CDMOs 7.9%

In 2025, Pharmaceutical Manufacturing accounts for the largest share at 49.4% of the sterile cleaning services market, making it the leading demand center. This dominance is rooted in the sheer volume of batch-based production across oral solids, injectables, and sterile APIs, all of which require validated cleaning between product changeovers. Regulatory agencies like the FDA and EMA have intensified scrutiny on cleaning validation failures in pharma plants, leading to heightened investment in SOP-driven, auditable cleaning protocols.

Additionally, many large-scale facilities still rely on manual and semi-automated systems, creating sustained demand for on-site, labor-intensive cleaning services. Major players like Pfizer, Novartis, and Sun Pharma continue to operate large, multi-product facilities globally, necessitating frequent cleaning to prevent cross-contamination. The expansion of generic production hubs in India and Southeast Asia further reinforces this segment’s leadership.
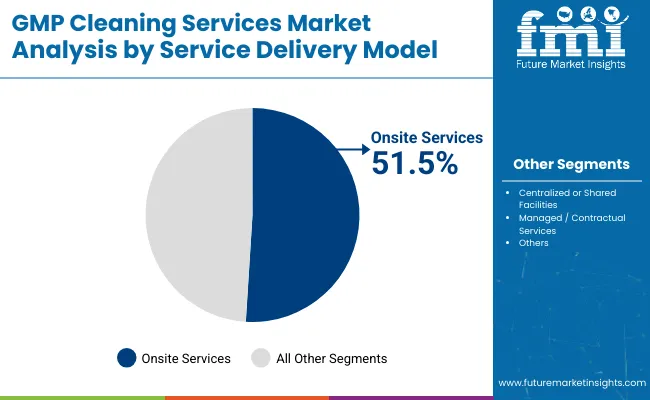
Insights on Service Delivery Model Segment with Dominance of Onsite Services

Gmp Cleaning Services Market By Service Delivery Model

By Service Delivery Model Market Value Share, 2025
Onsite Services 51.5%
Centralized or Shared Facilities 14.5%
Managed / Contractual Services 33.9%

In 2025, Onsite Services command the highest share at 51.5%, making them the preferred service delivery model across pharmaceutical and biologics manufacturing facilities. This dominance is driven by the need for immediate, traceable, and compliant cleaning interventions within GMP-regulated environments. Onsite cleaning enables real-time documentation, deviation tracking, and QA oversight, which are critical in sterile injectable and vaccine production.

Companies like AstraZeneca, Merck, and Lonza maintain dedicated in-house cleaning teams or contract specialists embedded on-site to support their 24/7 manufacturing operations. Onsite models also allow for rapid turnaround between batches and integration with digital cleaning logs, essential for passing FDA and EMA audits. As aseptic processing lines become increasingly sensitive to microbial contamination, manufacturers prioritize on-premise control over shared or offsite alternatives. While managed services are growing, onsite services remain indispensable for high-risk production zones.

What are Key Driver, Restraint, and Trend Shaping GMP Cleaning Services Market Growth?

Growth is restrained by infrastructure lock-in and the high cost of retrofitting legacy systems for automated cleaning or transitioning to outsourced models, which also require SOP realignment and revalidation. A key trend is the adoption of hybrid cleaning models in CDMO campuses, combining in-house teams for critical zones with outsourced providers for routine tasks, enabling flexibility and cost efficiency.

Stringent GMP Enforcement and Audit Activity

The surge in FDA 483 observations and EMA warning letters related to inadequate cleaning validation has become a major growth catalyst. Between 2020 to 2024, over 30% of sterile drug manufacturing violations cited deficiencies in cleaning protocols. This has compelled pharma and biologics firms to strengthen documentation, adopt validated cleaning agents, and engage professional service providers. Regulatory pressure is especially high for injectables, biosimilars, and high-potency APIs, where cross-contamination can impact patient safety.

As companies face increasing pressure to meet these standards, the need for specialized GMP cleaning services that adhere to detailed protocols has risen, ensuring compliance with hygiene, sterilization, and contamination control requirements.

Infrastructure Lock-In and High Capital Cost

The shift to automated CIP/SIP systems or outsourced cleaning models is slowed by infrastructure lock-in. Many manufacturers-particularly in emerging markets-operate legacy equipment that is not CIP-compatible, making retrofits expensive. Additionally, cleaning service outsourcing involves retraining, SOP alignment, and regulatory revalidation, further deterring transition.

Hybrid Cleaning Models in CDMO Campuses

A notable trend in the GMP cleaning services market is the adoption of hybrid cleaning models in Contract Development and Manufacturing Organizations (CDMOs) and multi-tenant biomanufacturing facilities. In these settings, operators maintain in-house cleaning teams for critical aseptic zones that require strict control over contamination. For routine GMP cleaning tasks, however, they increasingly outsource these services to specialized providers under long-term service level agreements (SLAs). This hybrid approach allows companies to enhance operational agility, reduce overhead costs, and scale cleaning services in line with fluctuating production demands, all while ensuring compliance with stringent GMP standards and improving efficiency.
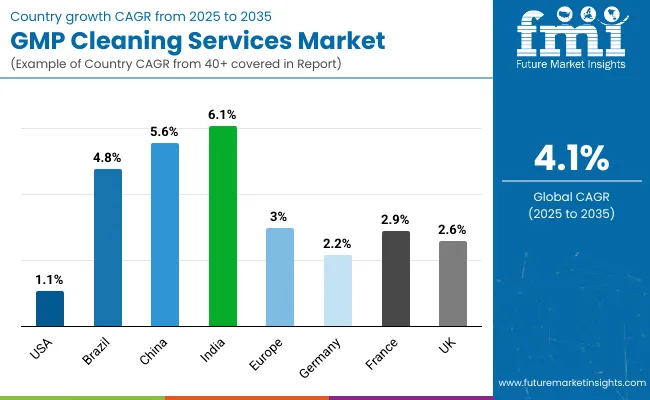
Analysis of GMP Cleaning Services Key Countries

Country Wise Analysis Of Gmp Cleaning Services Market

Country CAGR (%)
USA 1.1%
Brazil 4.8%
China 5.6%
India 6.1%
Europe 3.0%
Germany 2.2%
France 2.9%
UK 2.6%

Asia Pacific is emerging as the fastest-growing region in the sterile cleaning services market, projected to expand at a CAGR of 5.8%. Within the region, India (CAGR: 6.1%) and China (CAGR: 5.6%) are the two standout performers. India’s growth is driven by its expanding generic pharmaceutical manufacturing base, with over 3,000 WHO-GMP-certified facilities requiring compliance-grade cleaning services. The rise of domestic CDMOs and exports to regulated markets also mandates higher cleaning validation standards. China’s growth stems from the government-backed scale-up of biologics and vaccine manufacturing under initiatives like “Healthy China 2030.” Companies like WuXi Biologics and BeiGene are commissioning new GMP cleanroom facilities, creating demand for SIP/CIP-based cleaning systems and hybrid cleaning models.

Europe is showing stable growth over the forecast period, led by Germany (2.2%), France (2.9%), and the UK (2.6%). These countries have strict GMP enforcement via EMA and national health authorities, driving consistent investment in cleaning protocols and audit-readiness. Germany leads in biotech innovation, while France and the UK house numerous multi-product pharma facilities, necessitating high-frequency validated cleaning cycles.

North America, led by the USA, continues to hold the largest market share, with the USA projected to grow at a CAGR of 1.1% through 2030. Growth is driven by stringent FDA oversight, adoption of digital cleaning validation systems, and expansion in high-potency sterile manufacturing. Major players like Pfizer, Catalent, and Thermo Fisher are investing in both in-house and outsourced cleaning strategies to support biologics and mRNA facilities, reinforcing demand.

Sales Outlook of GMP Cleaning Services in United States

Year USA GMP Cleaning Services Market (USD Million)
2025 1126.7
2026 1171.3
2027 1218.1
2028 1267.5
2029 1319.2
2030 1373.3
2031 1429.4
2032 1488.5
2033 1550.8
2034 1616.1
2035 1683.8

The United States industry is projected to grow at a CAGR of 1.1% between 2025 and 2035, reaching a mature plateau compared to emerging markets. The modest growth reflects the USA market’s already high baseline adoption of validated GMP cleaning protocols and digitalized SOPs. Most large-scale manufacturer ssuch as Pfizer, Bristol Myers Squibb, and Eli Lilly already operate with embedded in-house cleaning teams, validated CIP/SIP systems, and digitized documentation platforms compliant with 21 CFR Part 11.

However, sustained sales are expected due to the expansion of cell and gene therapy facilities, contract manufacturing of sterile injectables, and the need to retrofit aging facilities with validated cleaning solutions. In fact, recent FDA Form 483 findings (2022 to 2024) show cleaning validation gaps in mid-sized injectable drug makers, prompting renewed spending on documentation-compliant sterile cleaning SOPs.

  • Eli Lilly's injectable manufacturing site includes isolator-based aseptic lines where Grade A cleaning protocols are executed every shift, supported by a hybrid cleaning model-internal QA-monitored teams for critical zones, and external vendors for low-risk corridors.
  • The Novartis AveXis site produces gene therapies under multi-product conditions, necessitating validated cleaning cycles between batches. The company partners with service providers for external room cleaning while internal teams manage equipment-level disinfection.
  • Thermo Fisher’s expansion for mRNA production includes both CIP systems and dedicated GMP cleaning staff, with digital cleaning validation records. The cleaning protocol is linked directly to the QMS system and triggers batch release conditions.

Growth and Expansion Outlook of GMP Cleaning Services in United Kingdom

The GMP cleaning services market in the United Kingdom is expected to grow at a CAGR of 2.6% between 2025 and 2035, supported by the restructuring of local manufacturing operations, expansion in biopharmaceuticals, and post-Brexit regulatory alignment efforts. While the UK represents a mature pharmaceutical market, the adoption of outsourced and hybrid cleaning models is increasing, particularly among mid-sized manufacturers and advanced therapy companies (ATMP developers).

The Medicines and Healthcare Products Regulatory Agency (MHRA) has increased audits of cleaning validation documentation, especially for facilities manufacturing sterile injectable products and novel biologics. Moreover, several NHS-linked hospital compounding units and clinical trial supply centers have adopted third-party GMP cleaning providers to reduce cross-contamination risks and maintain compliance with MHRA and EU GMP Annex 1 updates. The UK’s biocluster activity, especially around Cambridge, Steven age, and Oxford, is further boosting demand for facility-specific cleaning SOPs.

  • Oxford Biomedica maintains in-house QA staff for viral vector production zones but outsources cleanroom cleaning in support areas. SOPs are aligned with both UK GMP and EU Annex 1, requiring specialist training for third-party staff.
  • The CGT Catapult’s multi-tenant manufacturing facility provides shared GMP cleanrooms to early-stage biotech companies. Cleaning services for general and transitional zones are outsourced to firms with experience in high-containment biologics environments.
  • This hospital compounding center uses external GMP cleaning providers for non-critical areas, allowing internal pharmacists and QA teams to focus on sterile drug preparation under MHRA guidelines.

Growth and Expansion Outlook of GMP Cleaning Services in India

India's market for GMP cleaning services is projected to grow at a CAGR of 6.1% from 2025 to 2035, making it the fastest-growing national market globally. This accelerated growth is fueled by India's rise as the largest global supplier of generic drugs, with over 3,000 WHO-GMP-certified manufacturing facilities and more than 1,400 US FDA-approved plants. These facilities are under intensified scrutiny from USA, European, and WHO regulators, which is creating strong demand for validated, audit-ready cleaning processes.

Furthermore, with increased investments in injectables, sterile APIs, and biologics, companies like Biocon Biologics, Sun Pharma, and Cipla are expanding their aseptic fill-finish and biologics plants-demanding sterile cleaning SOPs that meet international compliance. Domestic CDMOs such as Syngene and Gland Pharma are also driving service adoption by outsourcing cleaning of low-risk areas while retaining internal QA oversight for critical equipment and zones.

  • Biocon’s aseptic facilities for monoclonal antibody production require Grade B/C cleanroom sanitation and CIP integration in bioreactor loops. Manual cleaning is retained for hard-to-reach zones, but CIP/SIP adoption is expanding rapidly.
  • Gland Pharma outsources external corridor and support zone cleaning while internal QA-monitored teams handle isolators and Class 100 zones. This hybrid cleaning model improves traceability and reduces downtime between sterile batches.
  • Syngene's multi-client facility implements onsite cleaning staff for high-risk rooms while using cleaning service vendors under SLA-based contracts for controlled and general access areas, creating an agile cleaning infrastructure for varied client demands.

Growth and Expansion Outlook of GMP Cleaning Services in China

China’s GMP cleaning services market is projected to grow at a CAGR of 5.6% between 2025 and 2035, fueled by the rapid expansion of domestic biologics manufacturing, rising compliance with international GMP standards, and aggressive government investment in vaccine and API capacity. The country’s pharmaceutical industry is undergoing a transition from volume-based production to quality-focused exports, especially to Europe and the USA, pushing manufacturers to adopt audit-ready cleaning protocols and third-party service partnerships.

The National Medical Products Administration (NMPA) has aligned China’s GMP regulations more closely with EU and WHO standards, making validated cleaning processes mandatory for sterile production facilities. Local giants like WuXi Biologics, BeiGene, and Fosun Pharma are building multi-product sites where hybrid and outsourced cleaning models are gaining traction. Moreover, with government-driven consolidation in the generics industry, mid-tier manufacturers are upgrading infrastructure and outsourcing cleaning functions to meet regulatory expectations without internal overhead.

  • WuXi operates a multi-product biomanufacturing facility where CIP/SIP systems are used for upstream operations, while external GMP-certified vendors clean Grade C/D rooms, warehouses, and support corridors under SLA contracts.
  • Fosun’s vaccine division utilizes onsite cleaning teams for aseptic production lines, with outsourced cleaning services used for gowning areas, HVAC duct exteriors, and cleanroom transit corridors. Cleaning validation reports are directly submitted during NMPA and WHO prequalification audits.
  • At its Lianyungang site, Hengrui employs manual GMP cleaning protocols supported by validated disinfectants and residues testing kits. The firm is transitioning select areas to outsourced models, particularly in warehouses and auxiliary packaging zones, to reduce non-core labor overhead.

Growth and Expansion Outlook of GMP Cleaning Services in Germany

Germany’s GMP cleaning services market is projected to grow at a CAGR of 2.2% from 2025 to 2035, driven by sustained investments in biopharmaceutical innovation, compliance with EU Annex 1, and the aging of manufacturing infrastructure in legacy sites across Bavaria, Baden-Württemberg, and North Rhine-Westphalia. Despite its status as a mature market, Germany is witnessing a gradual transition from fully in-house cleaning toward hybrid models that integrate external service providers for non-aseptic zones.

The German pharmaceutical ecosystem hosts high-value biologics manufacturing and sterile injectable production, including operations from Boehringer Ingelheim, Bayer, Merck KGaA, and BioNTech. These firms operate under strict EMA oversight, where traceable, validated, and risk-based cleaning protocols are non-negotiable. Additionally, the industry’s push toward automation and digital validation under EU GMP Annex 11 is creating demand for cleaning partners capable of integrating cleaning logs with MES and eQMS platforms.

  • BioNTech’s high-speed mRNA vaccine plant uses onsite GMP cleaning personnel for isolators and Grade A zones, while Grade C/D cleanrooms and external warehouses are cleaned by trained external vendors under Annex 1-compliant SOPs.
  • Merck has implemented digital cleaning validation integrated with its MES system. External contractors manage cleaning of material transfer zones and gowning rooms, ensuring alignment with the company’s global eQMS protocols.
  • The site retains in-house cleaning for aseptic formulation areas but uses third-party cleaning vendors for corridor sanitation and HVAC maintenance. The shift was driven by increased EM non-conformities flagged during internal audits, leading to revised risk-based cleaning zoning.

Europe Outlook of GMP Cleaning Services by Country

Europe Countries Share 2025 % Share
Germany 21.7%
UK 17.2%
France 14.1%
Italy 11.7%
Spain 8.5%
BENELUX 9.1%
Nordic Countries 7.1%
Rest of Western Europe 10.6%
Europe Countries Share 2035 % Share
Germany 21.3%
UK 16.9%
France 13.8%
Italy 11.5%
Spain 8.4%
BENELUX 8.9%
Nordic Countries 7.0%
Rest of Western Europe 12.3%

Growth Outlook of GMP Cleaning Services in Japan

Cleaning Method 2025 Share (%)
Japan Manual Cleaning 41.9%
Japan Automated Cleaning 18.7%
Japan CIP (Clean-in Place) 22.1%
Japan SIP (Steam in Place) 11.6%
Japan Ultrasonic Cleaning 5.7%

Japan’s GMP cleaning services market is characterized by steady institutional demand, driven by the country’s focus on quality assurance, regulatory discipline, and aging facility infrastructure. The market is dominated by Manual Cleaning, which accounts for the largest share within cleaning methods, due to Japan’s long-standing reliance on skilled QA-validated in-house teams and a cultural emphasis on meticulous, human-led processes. Although automation adoption is rising, most sterile injectable and biologic facilities still use manual or semi-automated protocols validated under PMDA guidelines.

Japan’s pharmaceutical industry consists of both domestic giants (e.g., Takeda, Daiichi Sankyo) and hospital-linked compounding units, all of which maintain rigorous batch-level cleaning validation. The market’s moderate CAGR (~2.5%) is supported by high regulatory compliance costs, extended facility life cycles, and limited outsourcing.

  • Market for Japan holds 3.9% share in 2025 in the global market
  • Manual Cleaning holds 41.5% share Over rest of the method
  • Growth is supported by high demand for quality assurance across end user industry

Growth Outlook of GMP Cleaning Services in South Korea

End User 2025 Share (%)
Pharmaceutical Manufacturing 47.4%
Biotechnology & Biopharma 25.5%
Medical Device Manufacturing 14.1%
CMOs and CDMOs 12.9%

South Korea’s GMP cleaning services market is experiencing robust growth, fueled by the expansion of biopharmaceutical manufacturing and aggressive investment in cell and gene therapy infrastructure. The Biotechnology & Biopharma segment leads in market share, driven by major players like Samsung Biologics, Celltrion, and SK Bioscience, which are operating large-scale biologics and vaccine facilities requiring high-frequency cleaning in aseptic environments. These facilities often involve multi-product, high-throughput operations, where validated cleaning is critical for avoiding cross-contamination and maintaining international GMP compliance.

The Korean MFDS and international partners (e.g., WHO PQ and EMA) have heightened compliance expectations, pushing biopharma manufacturers to adopt hybrid cleaning models involving in-house QA teams and third-party service providers. The market is forecasted to grow steadily at a CAGR of ~4.2% through 2035.
  • Market size for South Korea in 2025 is USD 31.5million
  • Global market share is approximately 2.8%
  • Pharmaceutical Manufacturing lead the segment with 48.4%

Competitive Landscape

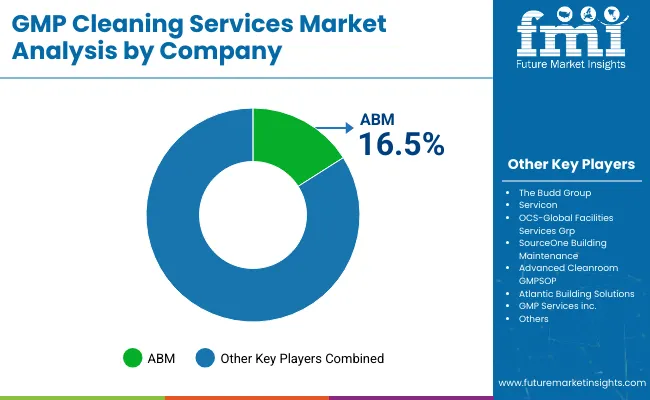
Gmp Cleaning Services Market By Company

Key Players Global Value Share (%) 2025
ABM 16.5%
Other Players 83.5%

The GMP cleaning services market is moderately fragmented, with ABM positioned as the top player due to its nationwide reach, regulated facility expertise, and integration with digital facility management platforms. ABM’s strategic focus includes bundled GMP environmental services, investment in electrostatic disinfection systems, and leveraging AI-driven building data to optimize cleaning efficiency-particularly in biopharma and life sciences campuses.

Emerging and mid-sized players like The Budd Group, Servicon, and OCS Global focus on sector specialization, offering tailored SOPs for FDA-regulated manufacturing, validated cleanrooms, and USP compliant environments. Advanced Cleanroom and GMP Services Inc. have gained traction by offering cGMP-trained personnel, residue monitoring systems, and hybrid cleaning partnerships with CDMOs.

GMPSOP differentiates itself via GMP compliance consulting bundled with cleaning protocols, while Pro-Pack Materials and Allied Cleanrooms focus on cleanroom construction and end-to-end cleaning integration, including materials compatibility.

The market is seeing a shift toward digital validation, audit traceability, and multi-year SLAs, as large-scale bio manufacturing becomes the dominant client base.

Key Developments

  • In May 2025 the Lonza signed agreement with TRU Global Solutions for cleanroom services. The TRU Global Solutions has engaged a with new client Lonza for cleanroom services.
  • In July 2024 the Shinryo Corporation announced that they are acquiring GMP Technical Solutions Private Limited - India’s 2nd largest player in Cleanroom business, owned by Vascon Engineers Limited

Scope of Report

Item Value
Quantitative Units USD 1,683.9 million
Cleaning Method Manual Cleaning, Automated Cleaning, CIP (Clean-in ‑ Place), SIP (Steam ‑ in ‑ Place) and Ultrasonic Cleaning
Industry Pharmaceutical Manufacturing, Biotechnology & Biopharma, Medical Device Manufacturing and CMOs and CDMOs
End User Onsite Services, Centralized or Shared Facilities and Managed / Contractual Services
Regions Covered North America, Latin America, Western & Eastern Europe, East Asia, South Asia & Pacific, Middle East & Africa
Countries Covered USA, Brazil, China, India, Germany, France, UK etc.
Key Companies Profiled ABM, The Budd Group, Servicon, OCS-Global Facilities Services Grp, SourceOne Building Maintenance, Advanced Cleanroom GMPSOP, Atlantic Building Solutions, GMP Services inc., Diversified Maintenance, Pro-Pack Materials pte ltd, Cleanroom Facility Services and Allied Cleanrooms
Additional Attributes Dollar sales By End User verticals and global regions show pharmaceutical manufacturing leading total sales, with Asia Pacific and North America accounting for the largest revenue contributions through 2030. The adoption trends of hybrid GMP cleaning models, combining in-house QA teams for aseptic zones with outsourced services for general cleanroom environments, are accelerating in bio manufacturing campuses an d multi-tenant CDMO facilities.

Key Segmentation

By Cleaning Method:

  • Manual Cleaning
  • Automated Cleaning
  • CIP (Clean-in Place)
  • SIP (Steam in Place)
  • Ultrasonic Cleaning

By Industry:

  • Pharmaceutical Manufacturing
  • Biotechnology & Biopharma
  • Medical Device Manufacturing
  • CMOs and CDMOs

By Service Delivery Model:

  • Onsite Services
  • Centralized or Shared Facilities
  • Managed / Contractual Services

By Region:

  • North America
  • Latin America
  • East Asia
  • South Asia
  • Western Europe
  • Eastern Europe
  • Middle East & Africa

Table of Content

  1. Executive Summary
    • Global Market Outlook
    • Demand-side Trends
    • Supply-side Trends
    • Technology Roadmap Analysis
    • Analysis and Recommendations
  2. Market Overview
    • Market Coverage / Taxonomy
    • Market Definition / Scope / Limitations
  3. Market Background
    • Market Dynamics
      • Drivers
      • Restraints
      • Opportunity
      • Trends
    • Scenario Forecast
      • Demand in Optimistic Scenario
      • Demand in Likely Scenario
      • Demand in Conservative Scenario
    • Opportunity Map Analysis
    • Supply Chain Analysis
    • Investment Feasibility Matrix
    • Investment Feasibility Matrix
    • Value Chain Analysis
    • PESTLE and Porter’s Analysis
    • Regulatory Landscape
      • By Key Regions
      • By Key Countries
    • Regional Parent Market Outlook
  4. Global Market Analysis 2020 to 2024 and Forecast, 2025 to 2035
    • Historical Market Size Value (USD Million) Analysis, 2020 to 2024
    • Current and Future Market Size Value (USD Million) Projections, 2025 to 2035
      • Y-o-Y Growth Trend Analysis
      • Absolute $ Opportunity Analysis
  5. Global Market Analysis 2020 to 2024 and Forecast 2025 to 2035, By Cleaning Method
    • Introduction / Key Findings
    • Historical Market Size Value (USD Million) Analysis By Cleaning Method, 2020 to 2024
    • Current and Future Market Size Value (USD Million) Analysis and Forecast By Cleaning Method, 2025 to 2035
      • Manual Cleaning
      • Automated Cleaning
      • CIP (Clean-in Place)
      • SIP (Steam in Place)
      • Ultrasonic Cleaning
    • Y-o-Y Growth Trend Analysis By Cleaning Method, 2020 to 2024
    • Absolute $ Opportunity Analysis By Cleaning Method, 2025 to 2035
  6. Global Market Analysis 2020 to 2024 and Forecast 2025 to 2035, By Industry
    • Introduction / Key Findings
    • Historical Market Size Value (USD Million) Analysis By Industry, 2020 to 2024
    • Current and Future Market Size Value (USD Million) Analysis and Forecast By Industry, 2025 to 2035
      • Pharmaceutical Manufacturing
      • Biotechnology & Biopharma
      • Medical Device Manufacturing
      • CMOs and CDMOs
    • Y-o-Y Growth Trend Analysis By Industry, 2020 to 2024
    • Absolute $ Opportunity Analysis By Industry, 2025 to 2035
  7. Global Market Analysis 2020 to 2024 and Forecast 2025 to 2035, By Service Delivery Model
    • Introduction / Key Findings
    • Historical Market Size Value (USD Million) Analysis By Service Delivery Model, 2020 to 2024
    • Current and Future Market Size Value (USD Million) Analysis and Forecast By Service Delivery Model, 2025 to 2035
      • Onsite Services
      • Centralized or Shared Facilities
      • Managed / Contractual Services
    • Y-o-Y Growth Trend Analysis By Service Delivery Model, 2020 to 2024
    • Absolute $ Opportunity Analysis By Service Delivery Model, 2025 to 2035
  8. Global Market Analysis 2020 to 2024 and Forecast 2025 to 2035, By Region
    • Introduction
    • Historical Market Size Value (USD Million) Analysis By Region, 2020 to 2024
    • Current Market Size Value (USD Million) Analysis and Forecast By Region, 2025 to 2035
      • North America
      • Latin America
      • East Asia
      • South Asia
      • Western Europe
      • Eastern Europe
      • Middle East & Africa
    • Market Attractiveness Analysis By Region
  9. North America Market Analysis 2020 to 2024 and Forecast 2025 to 2035, By Country
    • Historical Market Size Value (USD Million) Trend Analysis By Market Taxonomy, 2020 to 2024
    • Market Size Value (USD Million) Forecast By Market Taxonomy, 2025 to 2035
      • By Country
        • USA
        • Canada
        • Mexico
      • By Cleaning Method
      • By Industry
      • By Service Delivery Model
    • Market Attractiveness Analysis
      • By Country
      • By Cleaning Method
      • By Industry
      • By Service Delivery Model
    • Key Takeaways
  10. Latin America Market Analysis 2020 to 2024 and Forecast 2025 to 2035, By Country
    • Historical Market Size Value (USD Million) Trend Analysis By Market Taxonomy, 2020 to 2024
    • Market Size Value (USD Million) Forecast By Market Taxonomy, 2025 to 2035
      • By Country
        • Brazil
        • Argentina
        • Rest of Latin America
      • By Cleaning Method
      • By Industry
      • By Service Delivery Model
    • Market Attractiveness Analysis
      • By Country
      • By Cleaning Method
      • By Industry
      • By Service Delivery Model
    • Key Takeaways
  11. East Asia Market Analysis 2020 to 2024 and Forecast 2025 to 2035, By Country
    • Historical Market Size Value (USD Million) Trend Analysis By Market Taxonomy, 2020 to 2024
    • Market Size Value (USD Million) Forecast By Market Taxonomy, 2025 to 2035
      • By Country
        • China
        • Japan
        • South Korea
      • By Cleaning Method
      • By Industry
      • By Service Delivery Model
    • Market Attractiveness Analysis
      • By Country
      • By Cleaning Method
      • By Industry
      • By Service Delivery Model
    • Key Takeaways
  12. South Asia Market Analysis 2020 to 2024 and Forecast 2025 to 2035, By Country
    • Historical Market Size Value (USD Million) Trend Analysis By Market Taxonomy, 2020 to 2024
    • Market Size Value (USD Million) Forecast By Market Taxonomy, 2025 to 2035
      • By Country
        • India
        • ASEAN Countries
        • Australia & New Zealand
        • Rest of South Asia
      • By Cleaning Method
      • By Industry
      • By Service Delivery Model
    • Market Attractiveness Analysis
      • By Country
      • By Cleaning Method
      • By Industry
      • By Service Delivery Model
    • Key Takeaways
  13. Western Europe Market Analysis 2020 to 2024 and Forecast 2025 to 2035, By Country
    • Historical Market Size Value (USD Million) Trend Analysis By Market Taxonomy, 2020 to 2024
    • Market Size Value (USD Million) Forecast By Market Taxonomy, 2025 to 2035
      • By Country
        • Germany
        • UK
        • France
        • Italy
        • Spain
        • BENELUX
        • Nordic Countries
        • Rest of Western Europe
      • By Cleaning Method
      • By Industry
      • By Service Delivery Model
    • Market Attractiveness Analysis
      • By Country
      • By Cleaning Method
      • By Industry
      • By Service Delivery Model
    • Key Takeaways
  14. Eastern Europe Market Analysis 2020 to 2024 and Forecast 2025 to 2035, By Country
    • Historical Market Size Value (USD Million) Trend Analysis By Market Taxonomy, 2020 to 2024
    • Market Size Value (USD Million) Forecast By Market Taxonomy, 2025 to 2035
      • By Country
        • Russia
        • Hungary
        • Poland
        • Rest of Eastern Europe
      • By Cleaning Method
      • By Industry
      • By Service Delivery Model
    • Market Attractiveness Analysis
      • By Country
      • By Cleaning Method
      • By Industry
      • By Service Delivery Model
    • Key Takeaways
  15. Middle East & Africa Market Analysis 2020 to 2024 and Forecast 2025 to 2035, By Country
    • Historical Market Size Value (USD Million) Trend Analysis By Market Taxonomy, 2020 to 2024
    • Market Size Value (USD Million) Forecast By Market Taxonomy, 2025 to 2035
      • By Country
        • Saudi Arabia
        • Other GCC Countries
        • Türkiye
        • South Africa
        • Rest of MEA
      • By Cleaning Method
      • By Industry
      • By Service Delivery Model
    • Market Attractiveness Analysis
      • By Country
      • By Cleaning Method
      • By Industry
      • By Service Delivery Model
    • Key Takeaways
  16. Key Countries Market Analysis
    • USA
      • Pricing Analysis
      • Market Share Analysis, 2024
        • By Cleaning Method
        • By Industry
        • By Service Delivery Model
    • Brazil
      • Pricing Analysis
      • Market Share Analysis, 2024
        • By Cleaning Method
        • By Industry
        • By Service Delivery Model
    • China
      • Pricing Analysis
      • Market Share Analysis, 2024
        • By Cleaning Method
        • By Industry
        • By Service Delivery Model
    • India
      • Pricing Analysis
      • Market Share Analysis, 2024
        • By Cleaning Method
        • By Industry
        • By Service Delivery Model
    • Europe
      • Pricing Analysis
      • Market Share Analysis, 2024
        • By Cleaning Method
        • By Industry
        • By Service Delivery Model
    • Germany
      • Pricing Analysis
      • Market Share Analysis, 2024
        • By Cleaning Method
        • By Industry
        • By Service Delivery Model
    • France
      • Pricing Analysis
      • Market Share Analysis, 2024
        • By Cleaning Method
        • By Industry
        • By Service Delivery Model
    • UK
      • Pricing Analysis
      • Market Share Analysis, 2024
        • By Cleaning Method
        • By Industry
        • By Service Delivery Model
  17. Market Structure Analysis
    • Competition Dashboard
    • Competition Benchmarking
    • Market Share Analysis of Top Players
      • By Regional
      • By Cleaning Method
      • By Industry
      • By Service Delivery Model
  18. Competition Analysis
    • Competition Deep Dive
      • ABM
        • Overview
        • Product Portfolio
        • Profitability by Market Segments (Product/Age /Sales Channel/Region)
        • Sales Footprint
        • Strategy Overview
          • Marketing Strategy
          • Product Strategy
          • Channel Strategy
      • The Budd Group
        • Overview
        • Product Portfolio
        • Profitability by Market Segments (Product/Age /Sales Channel/Region)
        • Sales Footprint
        • Strategy Overview
          • Marketing Strategy
          • Product Strategy
          • Channel Strategy
      • Servicon
        • Overview
        • Product Portfolio
        • Profitability by Market Segments (Product/Age /Sales Channel/Region)
        • Sales Footprint
        • Strategy Overview
          • Marketing Strategy
          • Product Strategy
          • Channel Strategy
      • OCS-Global Facilities Services Grp
        • Overview
        • Product Portfolio
        • Profitability by Market Segments (Product/Age /Sales Channel/Region)
        • Sales Footprint
        • Strategy Overview
          • Marketing Strategy
          • Product Strategy
          • Channel Strategy
      • SourceOne Building Maintenance
        • Overview
        • Product Portfolio
        • Profitability by Market Segments (Product/Age /Sales Channel/Region)
        • Sales Footprint
        • Strategy Overview
          • Marketing Strategy
          • Product Strategy
          • Channel Strategy
      • Advanced Cleanroom
        • Overview
        • Product Portfolio
        • Profitability by Market Segments (Product/Age /Sales Channel/Region)
        • Sales Footprint
        • Strategy Overview
          • Marketing Strategy
          • Product Strategy
          • Channel Strategy
      • GMPSOP
        • Overview
        • Product Portfolio
        • Profitability by Market Segments (Product/Age /Sales Channel/Region)
        • Sales Footprint
        • Strategy Overview
          • Marketing Strategy
          • Product Strategy
          • Channel Strategy
      • Atlantic Building Solutions
        • Overview
        • Product Portfolio
        • Profitability by Market Segments (Product/Age /Sales Channel/Region)
        • Sales Footprint
        • Strategy Overview
          • Marketing Strategy
          • Product Strategy
          • Channel Strategy
      • GMP Services inc.
        • Overview
        • Product Portfolio
        • Profitability by Market Segments (Product/Age /Sales Channel/Region)
        • Sales Footprint
        • Strategy Overview
          • Marketing Strategy
          • Product Strategy
          • Channel Strategy
      • Diversified Maintenance
        • Overview
        • Product Portfolio
        • Profitability by Market Segments (Product/Age /Sales Channel/Region)
        • Sales Footprint
        • Strategy Overview
          • Marketing Strategy
          • Product Strategy
          • Channel Strategy
      • Pro-Pack Materials pte ltd
        • Overview
        • Product Portfolio
        • Profitability by Market Segments (Product/Age /Sales Channel/Region)
        • Sales Footprint
        • Strategy Overview
          • Marketing Strategy
          • Product Strategy
          • Channel Strategy
      • Cleanroom Facilitye Services
        • Overview
        • Product Portfolio
        • Profitability by Market Segments (Product/Age /Sales Channel/Region)
        • Sales Footprint
        • Strategy Overview
          • Marketing Strategy
          • Product Strategy
          • Channel Strategy
      • Allied Cleanrooms
        • Overview
        • Product Portfolio
        • Profitability by Market Segments (Product/Age /Sales Channel/Region)
        • Sales Footprint
        • Strategy Overview
          • Marketing Strategy
          • Product Strategy
          • Channel Strategy
  19. Assumptions & Acronyms Used
  20. Research Methodology

List of Tables

  • Table 1: Global Market Value (USD Million) Forecast by Region, 2020-2035
  • Table 2: Global Market Value (USD Million) Forecast by Cleaning Method, 2020-2035
  • Table 3: Global Market Value (USD Million) Forecast by Industry, 2020-2035
  • Table 4: Global Market Value (USD Million) Forecast by Service Delivery Model, 2020-2035
  • Table 5: North America Market Value (USD Million) Forecast by Country, 2020-2035
  • Table 6: North America Market Value (USD Million) Forecast by Cleaning Method, 2020-2035
  • Table 7: North America Market Value (USD Million) Forecast by Industry, 2020-2035
  • Table 8: North America Market Value (USD Million) Forecast by Service Delivery Model, 2020-2035
  • Table 9: Latin America Market Value (USD Million) Forecast by Country, 2020-2035
  • Table 10: Latin America Market Value (USD Million) Forecast by Cleaning Method, 2020-2035
  • Table 11: Latin America Market Value (USD Million) Forecast by Industry, 2020-2035
  • Table 12: Latin America Market Value (USD Million) Forecast by Service Delivery Model, 2020-2035
  • Table 13: East Asia Market Value (USD Million) Forecast by Country, 2020-2035
  • Table 14: East Asia Market Value (USD Million) Forecast by Cleaning Method, 2020-2035
  • Table 15: East Asia Market Value (USD Million) Forecast by Industry, 2020-2035
  • Table 16: East Asia Market Value (USD Million) Forecast by Service Delivery Model, 2020-2035
  • Table 17: South Asia Market Value (USD Million) Forecast by Country, 2020-2035
  • Table 18: South Asia Market Value (USD Million) Forecast by Cleaning Method, 2020-2035
  • Table 19: South Asia Market Value (USD Million) Forecast by Industry, 2020-2035
  • Table 20: South Asia Market Value (USD Million) Forecast by Service Delivery Model, 2020-2035
  • Table 21: Western Europe Market Value (USD Million) Forecast by Country, 2020-2035
  • Table 22: Western Europe Market Value (USD Million) Forecast by Cleaning Method, 2020-2035
  • Table 23: Western Europe Market Value (USD Million) Forecast by Industry, 2020-2035
  • Table 24: Western Europe Market Value (USD Million) Forecast by Service Delivery Model, 2020-2035
  • Table 25: Eastern Europe Market Value (USD Million) Forecast by Country, 2020-2035
  • Table 26: Eastern Europe Market Value (USD Million) Forecast by Cleaning Method, 2020-2035
  • Table 27: Eastern Europe Market Value (USD Million) Forecast by Industry, 2020-2035
  • Table 28: Eastern Europe Market Value (USD Million) Forecast by Service Delivery Model, 2020-2035
  • Table 29: Middle East & Africa Market Value (USD Million) Forecast by Country, 2020-2035
  • Table 30: Middle East & Africa Market Value (USD Million) Forecast by Cleaning Method, 2020-2035
  • Table 31: Middle East & Africa Market Value (USD Million) Forecast by Industry, 2020-2035
  • Table 32: Middle East & Africa Market Value (USD Million) Forecast by Service Delivery Model, 2020-2035

List of Figures

  • Figure 1: Global Market Value (USD Million) by Cleaning Method, 2025-2035
  • Figure 2: Global Market Value (USD Million) by Industry, 2025-2035
  • Figure 3: Global Market Value (USD Million) by Service Delivery Model, 2025-2035
  • Figure 4: Global Market Value (USD Million) by Region, 2025-2035
  • Figure 5: Global Market Value (USD Million) Analysis by Region, 2020-2035
  • Figure 6: Global Market Value Share (%) and BPS Analysis by Region, 2025-2035
  • Figure 7: Global Market Y-o-Y Growth (%) Projections by Region, 2025-2035
  • Figure 8: Global Market Value (USD Million) Analysis by Cleaning Method, 2020-2035
  • Figure 9: Global Market Value Share (%) and BPS Analysis by Cleaning Method, 2025-2035
  • Figure 10: Global Market Y-o-Y Growth (%) Projections by Cleaning Method, 2025-2035
  • Figure 11: Global Market Value (USD Million) Analysis by Industry, 2020-2035
  • Figure 12: Global Market Value Share (%) and BPS Analysis by Industry, 2025-2035
  • Figure 13: Global Market Y-o-Y Growth (%) Projections by Industry, 2025-2035
  • Figure 14: Global Market Value (USD Million) Analysis by Service Delivery Model, 2020-2035
  • Figure 15: Global Market Value Share (%) and BPS Analysis by Service Delivery Model, 2025-2035
  • Figure 16: Global Market Y-o-Y Growth (%) Projections by Service Delivery Model, 2025-2035
  • Figure 17: Global Market Attractiveness by Cleaning Method, 2025-2035
  • Figure 18: Global Market Attractiveness by Industry, 2025-2035
  • Figure 19: Global Market Attractiveness by Service Delivery Model, 2025-2035
  • Figure 20: Global Market Attractiveness by Region, 2025-2035
  • Figure 21: North America Market Value (USD Million) by Cleaning Method, 2025-2035
  • Figure 22: North America Market Value (USD Million) by Industry, 2025-2035
  • Figure 23: North America Market Value (USD Million) by Service Delivery Model, 2025-2035
  • Figure 24: North America Market Value (USD Million) by Country, 2025-2035
  • Figure 25: North America Market Value (USD Million) Analysis by Country, 2020-2035
  • Figure 26: North America Market Value Share (%) and BPS Analysis by Country, 2025-2035
  • Figure 27: North America Market Y-o-Y Growth (%) Projections by Country, 2025-2035
  • Figure 28: North America Market Value (USD Million) Analysis by Cleaning Method, 2020-2035
  • Figure 29: North America Market Value Share (%) and BPS Analysis by Cleaning Method, 2025-2035
  • Figure 30: North America Market Y-o-Y Growth (%) Projections by Cleaning Method, 2025-2035
  • Figure 31: North America Market Value (USD Million) Analysis by Industry, 2020-2035
  • Figure 32: North America Market Value Share (%) and BPS Analysis by Industry, 2025-2035
  • Figure 33: North America Market Y-o-Y Growth (%) Projections by Industry, 2025-2035
  • Figure 34: North America Market Value (USD Million) Analysis by Service Delivery Model, 2020-2035
  • Figure 35: North America Market Value Share (%) and BPS Analysis by Service Delivery Model, 2025-2035
  • Figure 36: North America Market Y-o-Y Growth (%) Projections by Service Delivery Model, 2025-2035
  • Figure 37: North America Market Attractiveness by Cleaning Method, 2025-2035
  • Figure 38: North America Market Attractiveness by Industry, 2025-2035
  • Figure 39: North America Market Attractiveness by Service Delivery Model, 2025-2035
  • Figure 40: North America Market Attractiveness by Country, 2025-2035
  • Figure 41: Latin America Market Value (USD Million) by Cleaning Method, 2025-2035
  • Figure 42: Latin America Market Value (USD Million) by Industry, 2025-2035
  • Figure 43: Latin America Market Value (USD Million) by Service Delivery Model, 2025-2035
  • Figure 44: Latin America Market Value (USD Million) by Country, 2025-2035
  • Figure 45: Latin America Market Value (USD Million) Analysis by Country, 2020-2035
  • Figure 46: Latin America Market Value Share (%) and BPS Analysis by Country, 2025-2035
  • Figure 47: Latin America Market Y-o-Y Growth (%) Projections by Country, 2025-2035
  • Figure 48: Latin America Market Value (USD Million) Analysis by Cleaning Method, 2020-2035
  • Figure 49: Latin America Market Value Share (%) and BPS Analysis by Cleaning Method, 2025-2035
  • Figure 50: Latin America Market Y-o-Y Growth (%) Projections by Cleaning Method, 2025-2035
  • Figure 51: Latin America Market Value (USD Million) Analysis by Industry, 2020-2035
  • Figure 52: Latin America Market Value Share (%) and BPS Analysis by Industry, 2025-2035
  • Figure 53: Latin America Market Y-o-Y Growth (%) Projections by Industry, 2025-2035
  • Figure 54: Latin America Market Value (USD Million) Analysis by Service Delivery Model, 2020-2035
  • Figure 55: Latin America Market Value Share (%) and BPS Analysis by Service Delivery Model, 2025-2035
  • Figure 56: Latin America Market Y-o-Y Growth (%) Projections by Service Delivery Model, 2025-2035
  • Figure 57: Latin America Market Attractiveness by Cleaning Method, 2025-2035
  • Figure 58: Latin America Market Attractiveness by Industry, 2025-2035
  • Figure 59: Latin America Market Attractiveness by Service Delivery Model, 2025-2035
  • Figure 60: Latin America Market Attractiveness by Country, 2025-2035
  • Figure 61: East Asia Market Value (USD Million) by Cleaning Method, 2025-2035
  • Figure 62: East Asia Market Value (USD Million) by Industry, 2025-2035
  • Figure 63: East Asia Market Value (USD Million) by Service Delivery Model, 2025-2035
  • Figure 64: East Asia Market Value (USD Million) by Country, 2025-2035
  • Figure 65: East Asia Market Value (USD Million) Analysis by Country, 2020-2035
  • Figure 66: East Asia Market Value Share (%) and BPS Analysis by Country, 2025-2035
  • Figure 67: East Asia Market Y-o-Y Growth (%) Projections by Country, 2025-2035
  • Figure 68: East Asia Market Value (USD Million) Analysis by Cleaning Method, 2020-2035
  • Figure 69: East Asia Market Value Share (%) and BPS Analysis by Cleaning Method, 2025-2035
  • Figure 70: East Asia Market Y-o-Y Growth (%) Projections by Cleaning Method, 2025-2035
  • Figure 71: East Asia Market Value (USD Million) Analysis by Industry, 2020-2035
  • Figure 72: East Asia Market Value Share (%) and BPS Analysis by Industry, 2025-2035
  • Figure 73: East Asia Market Y-o-Y Growth (%) Projections by Industry, 2025-2035
  • Figure 74: East Asia Market Value (USD Million) Analysis by Service Delivery Model, 2020-2035
  • Figure 75: East Asia Market Value Share (%) and BPS Analysis by Service Delivery Model, 2025-2035
  • Figure 76: East Asia Market Y-o-Y Growth (%) Projections by Service Delivery Model, 2025-2035
  • Figure 77: East Asia Market Attractiveness by Cleaning Method, 2025-2035
  • Figure 78: East Asia Market Attractiveness by Industry, 2025-2035
  • Figure 79: East Asia Market Attractiveness by Service Delivery Model, 2025-2035
  • Figure 80: East Asia Market Attractiveness by Country, 2025-2035
  • Figure 81: South Asia Market Value (USD Million) by Cleaning Method, 2025-2035
  • Figure 82: South Asia Market Value (USD Million) by Industry, 2025-2035
  • Figure 83: South Asia Market Value (USD Million) by Service Delivery Model, 2025-2035
  • Figure 84: South Asia Market Value (USD Million) by Country, 2025-2035
  • Figure 85: South Asia Market Value (USD Million) Analysis by Country, 2020-2035
  • Figure 86: South Asia Market Value Share (%) and BPS Analysis by Country, 2025-2035
  • Figure 87: South Asia Market Y-o-Y Growth (%) Projections by Country, 2025-2035
  • Figure 88: South Asia Market Value (USD Million) Analysis by Cleaning Method, 2020-2035
  • Figure 89: South Asia Market Value Share (%) and BPS Analysis by Cleaning Method, 2025-2035
  • Figure 90: South Asia Market Y-o-Y Growth (%) Projections by Cleaning Method, 2025-2035
  • Figure 91: South Asia Market Value (USD Million) Analysis by Industry, 2020-2035
  • Figure 92: South Asia Market Value Share (%) and BPS Analysis by Industry, 2025-2035
  • Figure 93: South Asia Market Y-o-Y Growth (%) Projections by Industry, 2025-2035
  • Figure 94: South Asia Market Value (USD Million) Analysis by Service Delivery Model, 2020-2035
  • Figure 95: South Asia Market Value Share (%) and BPS Analysis by Service Delivery Model, 2025-2035
  • Figure 96: South Asia Market Y-o-Y Growth (%) Projections by Service Delivery Model, 2025-2035
  • Figure 97: South Asia Market Attractiveness by Cleaning Method, 2025-2035
  • Figure 98: South Asia Market Attractiveness by Industry, 2025-2035
  • Figure 99: South Asia Market Attractiveness by Service Delivery Model, 2025-2035
  • Figure 100: South Asia Market Attractiveness by Country, 2025-2035
  • Figure 101: Western Europe Market Value (USD Million) by Cleaning Method, 2025-2035
  • Figure 102: Western Europe Market Value (USD Million) by Industry, 2025-2035
  • Figure 103: Western Europe Market Value (USD Million) by Service Delivery Model, 2025-2035
  • Figure 104: Western Europe Market Value (USD Million) by Country, 2025-2035
  • Figure 105: Western Europe Market Value (USD Million) Analysis by Country, 2020-2035
  • Figure 106: Western Europe Market Value Share (%) and BPS Analysis by Country, 2025-2035
  • Figure 107: Western Europe Market Y-o-Y Growth (%) Projections by Country, 2025-2035
  • Figure 108: Western Europe Market Value (USD Million) Analysis by Cleaning Method, 2020-2035
  • Figure 109: Western Europe Market Value Share (%) and BPS Analysis by Cleaning Method, 2025-2035
  • Figure 110: Western Europe Market Y-o-Y Growth (%) Projections by Cleaning Method, 2025-2035
  • Figure 111: Western Europe Market Value (USD Million) Analysis by Industry, 2020-2035
  • Figure 112: Western Europe Market Value Share (%) and BPS Analysis by Industry, 2025-2035
  • Figure 113: Western Europe Market Y-o-Y Growth (%) Projections by Industry, 2025-2035
  • Figure 114: Western Europe Market Value (USD Million) Analysis by Service Delivery Model, 2020-2035
  • Figure 115: Western Europe Market Value Share (%) and BPS Analysis by Service Delivery Model, 2025-2035
  • Figure 116: Western Europe Market Y-o-Y Growth (%) Projections by Service Delivery Model, 2025-2035
  • Figure 117: Western Europe Market Attractiveness by Cleaning Method, 2025-2035
  • Figure 118: Western Europe Market Attractiveness by Industry, 2025-2035
  • Figure 119: Western Europe Market Attractiveness by Service Delivery Model, 2025-2035
  • Figure 120: Western Europe Market Attractiveness by Country, 2025-2035
  • Figure 121: Eastern Europe Market Value (USD Million) by Cleaning Method, 2025-2035
  • Figure 122: Eastern Europe Market Value (USD Million) by Industry, 2025-2035
  • Figure 123: Eastern Europe Market Value (USD Million) by Service Delivery Model, 2025-2035
  • Figure 124: Eastern Europe Market Value (USD Million) by Country, 2025-2035
  • Figure 125: Eastern Europe Market Value (USD Million) Analysis by Country, 2020-2035
  • Figure 126: Eastern Europe Market Value Share (%) and BPS Analysis by Country, 2025-2035
  • Figure 127: Eastern Europe Market Y-o-Y Growth (%) Projections by Country, 2025-2035
  • Figure 128: Eastern Europe Market Value (USD Million) Analysis by Cleaning Method, 2020-2035
  • Figure 129: Eastern Europe Market Value Share (%) and BPS Analysis by Cleaning Method, 2025-2035
  • Figure 130: Eastern Europe Market Y-o-Y Growth (%) Projections by Cleaning Method, 2025-2035
  • Figure 131: Eastern Europe Market Value (USD Million) Analysis by Industry, 2020-2035
  • Figure 132: Eastern Europe Market Value Share (%) and BPS Analysis by Industry, 2025-2035
  • Figure 133: Eastern Europe Market Y-o-Y Growth (%) Projections by Industry, 2025-2035
  • Figure 134: Eastern Europe Market Value (USD Million) Analysis by Service Delivery Model, 2020-2035
  • Figure 135: Eastern Europe Market Value Share (%) and BPS Analysis by Service Delivery Model, 2025-2035
  • Figure 136: Eastern Europe Market Y-o-Y Growth (%) Projections by Service Delivery Model, 2025-2035
  • Figure 137: Eastern Europe Market Attractiveness by Cleaning Method, 2025-2035
  • Figure 138: Eastern Europe Market Attractiveness by Industry, 2025-2035
  • Figure 139: Eastern Europe Market Attractiveness by Service Delivery Model, 2025-2035
  • Figure 140: Eastern Europe Market Attractiveness by Country, 2025-2035
  • Figure 141: Middle East & Africa Market Value (USD Million) by Cleaning Method, 2025-2035
  • Figure 142: Middle East & Africa Market Value (USD Million) by Industry, 2025-2035
  • Figure 143: Middle East & Africa Market Value (USD Million) by Service Delivery Model, 2025-2035
  • Figure 144: Middle East & Africa Market Value (USD Million) by Country, 2025-2035
  • Figure 145: Middle East & Africa Market Value (USD Million) Analysis by Country, 2020-2035
  • Figure 146: Middle East & Africa Market Value Share (%) and BPS Analysis by Country, 2025-2035
  • Figure 147: Middle East & Africa Market Y-o-Y Growth (%) Projections by Country, 2025-2035
  • Figure 148: Middle East & Africa Market Value (USD Million) Analysis by Cleaning Method, 2020-2035
  • Figure 149: Middle East & Africa Market Value Share (%) and BPS Analysis by Cleaning Method, 2025-2035
  • Figure 150: Middle East & Africa Market Y-o-Y Growth (%) Projections by Cleaning Method, 2025-2035
  • Figure 151: Middle East & Africa Market Value (USD Million) Analysis by Industry, 2020-2035
  • Figure 152: Middle East & Africa Market Value Share (%) and BPS Analysis by Industry, 2025-2035
  • Figure 153: Middle East & Africa Market Y-o-Y Growth (%) Projections by Industry, 2025-2035
  • Figure 154: Middle East & Africa Market Value (USD Million) Analysis by Service Delivery Model, 2020-2035
  • Figure 155: Middle East & Africa Market Value Share (%) and BPS Analysis by Service Delivery Model, 2025-2035
  • Figure 156: Middle East & Africa Market Y-o-Y Growth (%) Projections by Service Delivery Model, 2025-2035
  • Figure 157: Middle East & Africa Market Attractiveness by Cleaning Method, 2025-2035
  • Figure 158: Middle East & Africa Market Attractiveness by Industry, 2025-2035
  • Figure 159: Middle East & Africa Market Attractiveness by Service Delivery Model, 2025-2035
  • Figure 160: Middle East & Africa Market Attractiveness by Country, 2025-2035

Frequently Asked Questions

How big is the GMP cleaning services market in 2025?

The global GMP cleaning services market is estimated to be valued at USD 1,126.7 million in 2025.

What will be the size of the GMP cleaning services market in 2035?

The market size for the GMP cleaning services market is projected to reach approximately USD 1,683.9 million by 2035.

How much will the GMP cleaning services market grow between 2025 and 2035?

The GMP cleaning services market is expected to grow at a CAGR of 4.1% between 2025 and 2035.

What are the key cleaning methods in the GMP cleaning services market?

The cleaning methods in the GMP cleaning services market include Manual Cleaning, Automated Cleaning, CIP (Clean-in‑Place), SIP (Steam‑in‑Place) and Ultrasonic Cleaning.

Which service delivery model segment will contribute a significant share in the GMP cleaning services market in 2025?

In terms of service delivery model, the onsite services segment is projected to command the highest share at 51.5% in the GMP cleaning services market in 2025.

Explore Similar Insights

Future Market Insights

GMP Cleaning Services Market