The Floor Cleaning and Mopping Machine Market is estimated to be valued at USD 6.4 billion in 2025 and is projected to reach USD 10.5 billion by 2035, registering a compound annual growth rate (CAGR) of 5.1% over the forecast period.
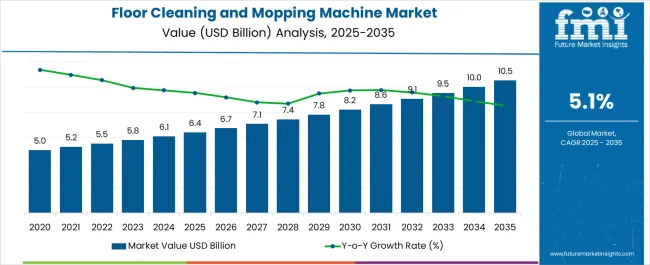
| Metric | Value |
|---|---|
| Floor Cleaning and Mopping Machine Market Estimated Value in (2025 E) | USD 6.4 billion |
| Floor Cleaning and Mopping Machine Market Forecast Value in (2035 F) | USD 10.5 billion |
| Forecast CAGR (2025 to 2035) | 5.1% |
The floor cleaning and mopping machine market is experiencing consistent growth. Rising urbanization, expansion of commercial infrastructure, and heightened focus on hygiene standards are driving product adoption. Current dynamics are being shaped by strong demand from industrial, institutional, and household sectors where efficiency and labor cost reduction are prioritized.
Manufacturers are introducing advanced machines with improved ergonomics, automation, and energy efficiency to meet user expectations. Increasing health and safety regulations are further accelerating deployment of mechanized cleaning solutions over traditional manual methods. The future outlook is supported by rapid adoption of smart and robotic cleaning equipment, expansion of organized retail, and rising penetration in emerging economies.
Growth rationale is also anchored on sustainability initiatives as water-saving and eco-friendly cleaning technologies are gaining prominence Overall, the market is poised for steady expansion as demand shifts toward high-performance, reliable, and automated cleaning solutions across end-user industries.
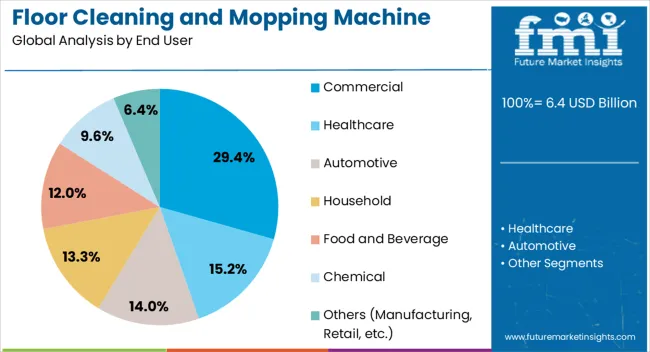
The commercial segment, holding 29.40% of the end user category, has been leading the market owing to its extensive adoption across offices, malls, airports, hospitals, and hospitality facilities. Increasing emphasis on hygiene compliance and maintaining high footfall areas has reinforced demand in this segment.
Investment in automated cleaning equipment has been prioritized by businesses seeking to enhance operational efficiency and reduce labor costs. Strategic procurement by facilities management firms has ensured consistent adoption.
Growth has been further supported by integration of advanced technologies such as IoT-enabled monitoring and battery-operated systems Expanding global retail and commercial real estate construction is expected to drive sustained growth, keeping the commercial segment at the forefront of demand in the floor cleaning and mopping machine market.
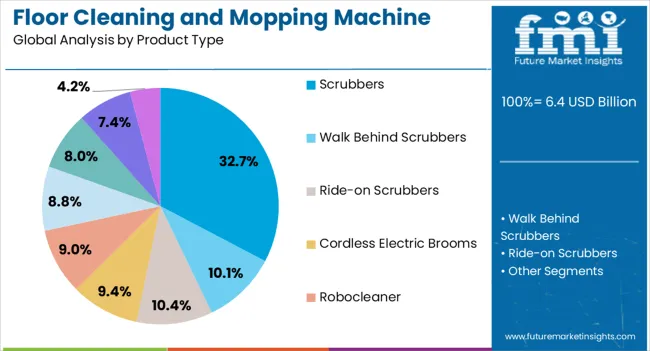
The scrubbers segment, accounting for 32.70% of the product type category, has emerged as the dominant product due to its strong performance in large-area cleaning and capability to deliver superior results compared to conventional methods. Demand has been reinforced by high adoption in industrial and commercial facilities where efficiency and time savings are critical.
Continuous technological advancements such as ride-on models, compact designs, and automated features have enhanced usability and market acceptance. Lifecycle cost benefits, including reduced water and detergent usage, have further supported its preference among facility operators.
Expansion of service-based models and rental services is strengthening accessibility to scrubber machines The segment’s leadership is expected to remain strong as demand for high-performance, durable, and sustainable cleaning equipment continues to grow across both developed and emerging markets.
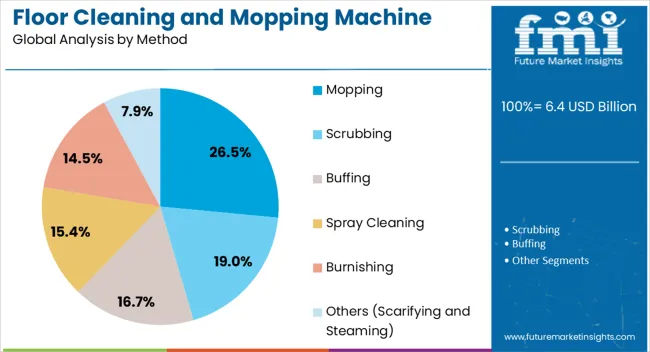
The mopping method, representing 26.50% of the method category, has maintained its position due to widespread use in commercial and residential environments where quick and flexible cleaning solutions are required. Adoption has been supported by product innovations such as automatic wringers, microfiber technology, and robotic mopping systems, which enhance efficiency and ease of use.
Cost-effectiveness compared to advanced mechanized options has ensured resilience in price-sensitive markets. The method’s market share is also reinforced by versatility across floor types and ease of deployment in small to medium-sized spaces.
Growing preference for hygienic and contactless cleaning methods is influencing innovation in automated mopping solutions With expanding consumer demand for smart and convenient cleaning options, the mopping method segment is expected to sustain its contribution to overall market growth while gradually evolving toward more advanced automated variants.
Growing Hygiene Awareness: Increasing consumer awareness of sanitation and clean spaces are surging the demand for floor cleaning and mopping machine. Rising demand for adequate, clean, and breathable surrounding are increasing the adoption of floor cleaning and mopping machine.
Reduce Labor Work:Industries and businesses are operating floor cleaning and mopping machines for practical work and to reduce labor costs. They minimize time and energy and enhance cleaning processes to drive market growth.
Technological Advancements:Ongoing technologies are developing automated, efficient, and time-saving floor cleaning and mopping machines to attract consumers' desires. These technologies, including features such as remote control and sensors, are surging the demand for floor cleaning and mopping machines.
Environment Sustainability:The increasing manufacturers' focus on environmental corrosion are raising the demand for floor cleaning and mopping machine. They are developing eco-friendly, sustainable, and energy-efficient floor cleaning and mopping devices to promote green solutions.
Urbanization and Commercial Growth:Rapidly growing urbanization and commercial spaces, including industries, offices, malls, and the public sector, raise the demand for floor cleaning and mopping machines. These spaces require effective and efficient cleaning to maintain a safe environment.
Healthcare Settings:Cleaning and hygiene among hospitals, schools, offices, and other institutions to maintain high cleanliness levels are increasing the demand for floor cleaning and mopping machines.
Government Regulations:Rising standardized regulations are surging the adoption of floor cleaning and mopping machines for safe workplaces. These machines are preferred among diverse industries such as manufacturing, chemical, and healthcare to drive the global market revenue.
Expanding E-commerce Industry:Increasing consumer demand for cleaning and mopping machines is a rapidly growing e-commerce sector. E-commerce offers a wide range of washing machines with customization, increasing the demand for floor cleaning and mopping machines.
Investment Cost: Small businesses faced challenges in raising the adoption of floor cleaning and mopping due to high costs may decline the market growth. These business vendors are looking for affordable mopping machines to save costs.
Maintenance and Repairs: Increasing costs on maintenance and repair of cleaning and mopping machines are declining the market growth. These machines may disrupt cleaning timing during repair.
Technological Complexity: Ongoing technological advancements are developing automated cleaning machines. It may be challenging to operate these machines for training staff, which may decline the market growth.
Charging Infrastructure: Manufacturers developing floor cleaning and mopping machines that heavily rely on charging infrastructure may restrain the market growth.
Competition: The market is highly competitive, and critical players offer unique and improved products to stay ahead of competitors. Manufacturers need help marketing profit margins, which may decline the market growth.
The global floor cleaning and mopping machine market grew steadily, with a valuation of USD 5,965.20 million in 2025. Increasing end-use industries' demand for effective, safe, and versatile cleaning processes is surging the adoption of floor cleaning and mopping machines. These machines are suitable for industrial, household, and commercial spaces for quick cleaning and are gaining vast popularity in the market.
Growing advanced technologies are bringing new automated machines for sweeping and cleaning in diverse industries to promote green solutions, driving market revenue. Manufacturers look forward to offering sustainable solutions to reduce carbon emissions and enhance breathable surroundings by increasing the sales of floor cleaning and mopping machines.
Increasing demand for efficient, safe, and reliable cleaning processes are surging the adoption of floor cleaning and mopping machine. These machines are integrated with artificial intelligence and automation technologies to drive market growth.
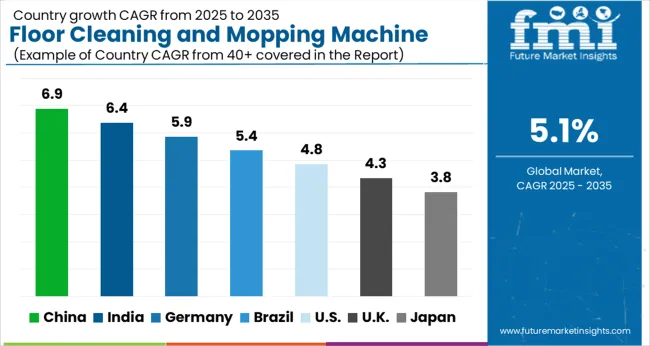
| Countries | Forecast CAGR Between 2025 to 2035 |
|---|---|
| United States | 5.30% |
| Canada | 3.60% |
| Germany | 6.10% |
| United Kingdom | 3.40% |
| Italy | 5.30% |
| France | 4.20% |
| Spain | 5.0% |
| China | 6.40% |
| India | 8.70% |
| Japan | 4.80% |
| South Korea | 6.0% |
| Thailand | 6.10% |
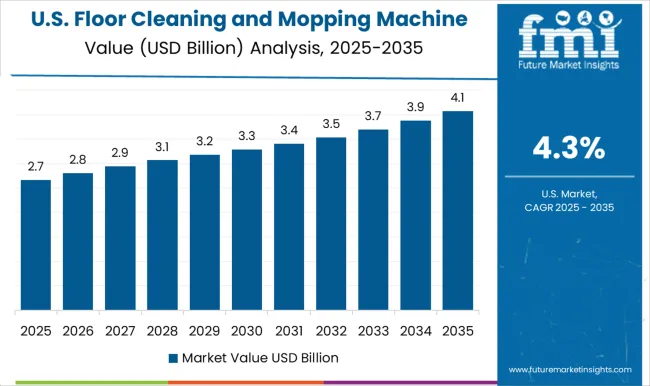
The United States is estimated to secure a CAGR of 5.30% in the global market during the forecast period. Increasing industries, vast infrastructure, and commercial sectors such as offices, malls, and warehouses are surging the adoption of floor cleaning and mopping machines in the country. The rising residential industry is increasing the demand for floor cleaning and mopping devices, including stem mops, vacuum cleaners, and simple cleaning processes in the United States.
Growing environmental concerns are increasing the adoption of floor cleaning and mopping machines for an eco-friendly environment, which upsurges the country's revenue. Manufacturers are developing green cleaning solutions to maintain proper hygiene, and cost-effective cleaning drives the United States floor cleaning and mopping machine market.
The United Kingdom is anticipated to secure a CAGR of 3.40% in the global market during the forecast period. Increasing consumer demand for safe, efficient, and clean surroundings are surging the adoption of floor clean mopping machine in the country. The rising commercial spaces such as hotels, offices, and shopping malls drive the United Kingdom floor cleaning and mopping machine market.
Increasing employee health concerns in offices and workplaces is a significant rise in the adoption of floor cleaning and mopping machines in the country. Growing urban areas, buildings, healthcare, and food sectors are rapidly increasing the demand for floor cleaning and mopping devices in the country. Manufacturers offering a diverse range of customized engines for cleaning purposes in the country are gaining vast popularity among consumers.
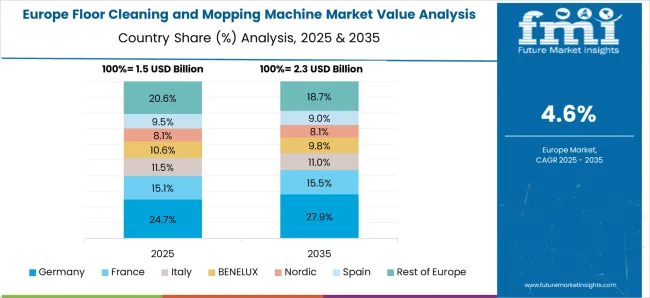
France is anticipated to capture a CAGR of 4.20% in the global market during the forecast period. Increasing focus on sustainable practices to reduce energy consumption raises the demand for eco-friendly floor cleaning and mopping machines in France. Rapidly growing high priority towards effective cleaning and enhanced environmental regulations fuel France's floor cleaning and mopping machine market.
Manufacturers design different types and sizes of floor cleaning and mopping machines for reliable and energy-efficient cleaning, a rising consumer demand. Growing pollution and toxicity are increasing consumers' demand for advanced cleaning machines such as vacuum cleaners and mops in the country. Devices maintain proper and convenient cleanliness in urban areas and small enterprises for flexible access.
India is estimated to capture a CAGR of 8.70% in the global market during the forecast period. The increasing demand for proper floor cleaning, brilliant hygiene solutions, and cost-effective cleaning is gaining popularity in India's floor cleaning and mopping machine market. In 2014, the government of India launched new programs like ‘Swachh Bharat Mission’ to reduce wastage and enhance cleaning.
Increasing end users' demand for automated floor cleaning and mopping machines to maintain proper cleaning methods is fueling the market growth in India. Rising population, urbanization, and industries are rapidly increasing the adoption of these machines while ensuring safety and hygiene. Consumers prefer robotic vacuum cleaners to reduce workload and improve cleanliness in household activities.
Thailand is estimated to capture a CAGR of 6.10% in the global market during the forecast period. Increasingly vast hotels, complexes, buildings, and resorts are surging the demand for floor cleaning and mopping machines to set clean environments to attract tourists. Manufacturers are introducing innovative green solution cleaning devices to gain popularity among end users in the country.
Rising demand for a diverse variety of floor cleaning machines is contributing a significant role in Thailand's floor cleaning and mopping machine market. Growing urban lifestyles and disposable incomes are accelerating the demand for these machines in the country.
Based on product type, scrubbers are widely used for cleaning and mopping floors globally. Scrubbers are securing a share of 18.80% worldwide during the forecast period. Consumers have increased the adoption of floor scrubbers for efficient dirt, dust, and stain cleaning in commercial and industrial sectors.
Consumers looking for deep cleaning are increasingly adopting versatile scrubbers with customized solutions. Manufacturers offer different sizes and types of scrubbers to reduce costs and save time to meet consumers' requirements. These scrubbers enhance cleaning capacity for wiping, sweeping, and vacuuming for broad industries.
Based on application, the commercial sector is likely to lead the global market by securing a share of 58.30% during the forecast period. Rising demand for floor cleaning and mopping machines in various spaces such as retail stores, hotels, offices, and restaurants are driving the market growth. Increasing effective clean solutions in commercial areas to maintain employees' hygiene, raising the adoption of mopping machines.
The government imposed strict regulations towards cleanliness with green solutions to enhance market growth. Commercial businesses are looking for standardized, time-saving, and reduced labor work, fueling the vast revenue in the market.
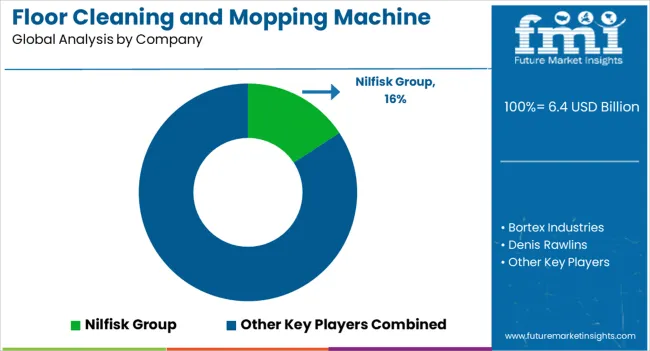
The global floor cleaning and mopping machine market is highly consolidated by the key players that develop versatile, eco-friendly, and high-quality products to attract consumers' requirements. They offer better products to gain consumers' trust with their product transparency.
Key players are enhancing their brand imaging at various events, such as exhibitions and trade shows, to meet relevant audiences, driving market growth. These players heavily invest in research and development to carry out new ideas to uplift the market reach.
Recent Developments in the Floor Cleaning and Mopping Machine Market
The global floor cleaning and mopping machine market is estimated to be valued at USD 6.4 billion in 2025.
The market size for the floor cleaning and mopping machine market is projected to reach USD 10.5 billion by 2035.
The floor cleaning and mopping machine market is expected to grow at a 5.1% CAGR between 2025 and 2035.
The key product types in floor cleaning and mopping machine market are commercial, healthcare, automotive, household, food and bEVerage, chemical and others (manufacturing, retAIl, etc.).
In terms of product type, scrubbers segment to command 32.7% share in the floor cleaning and mopping machine market in 2025.


Our Research Products

The "Full Research Suite" delivers actionable market intel, deep dives on markets or technologies, so clients act faster, cut risk, and unlock growth.

The Leaderboard benchmarks and ranks top vendors, classifying them as Established Leaders, Leading Challengers, or Disruptors & Challengers.

Locates where complements amplify value and substitutes erode it, forecasting net impact by horizon

We deliver granular, decision-grade intel: market sizing, 5-year forecasts, pricing, adoption, usage, revenue, and operational KPIs—plus competitor tracking, regulation, and value chains—across 60 countries broadly.

Spot the shifts before they hit your P&L. We track inflection points, adoption curves, pricing moves, and ecosystem plays to show where demand is heading, why it is changing, and what to do next across high-growth markets and disruptive tech

Real-time reads of user behavior. We track shifting priorities, perceptions of today’s and next-gen services, and provider experience, then pace how fast tech moves from trial to adoption, blending buyer, consumer, and channel inputs with social signals (#WhySwitch, #UX).

Partner with our analyst team to build a custom report designed around your business priorities. From analysing market trends to assessing competitors or crafting bespoke datasets, we tailor insights to your needs.
Supplier Intelligence
Discovery & Profiling
Capacity & Footprint
Performance & Risk
Compliance & Governance
Commercial Readiness
Who Supplies Whom
Scorecards & Shortlists
Playbooks & Docs
Category Intelligence
Definition & Scope
Demand & Use Cases
Cost Drivers
Market Structure
Supply Chain Map
Trade & Policy
Operating Norms
Deliverables
Buyer Intelligence
Account Basics
Spend & Scope
Procurement Model
Vendor Requirements
Terms & Policies
Entry Strategy
Pain Points & Triggers
Outputs
Pricing Analysis
Benchmarks
Trends
Should-Cost
Indexation
Landed Cost
Commercial Terms
Deliverables
Brand Analysis
Positioning & Value Prop
Share & Presence
Customer Evidence
Go-to-Market
Digital & Reputation
Compliance & Trust
KPIs & Gaps
Outputs
Full Research Suite comprises of:
Market outlook & trends analysis
Interviews & case studies
Strategic recommendations
Vendor profiles & capabilities analysis
5-year forecasts
8 regions and 60+ country-level data splits
Market segment data splits
12 months of continuous data updates
DELIVERED AS:
PDF EXCEL ONLINE
Floor Screed Market Size and Share Forecast Outlook 2025 to 2035
Floor Cleaner Market Size and Share Forecast Outlook 2025 to 2035
Floor Transition Strips Market Analysis - Size, Share, and Forecast Outlook 2025 to 2035
Floor Scales Market Size and Share Forecast Outlook 2025 to 2035
Floor Lamp Market Size and Share Forecast Outlook 2025 to 2035
Floor Marking Tape Market Analysis - Size and Share Forecast Outlook 2025 to 2035
Flooring Market Size and Share Forecast Outlook 2025 to 2035
Floor Displays Market Growth from 2025 to 2035
Floor Grinding Machine Market
Floor Standing Filtered Bottle Filling Stations Market Size and Share Forecast Outlook 2025 to 2035
Flooring and Carpets Market - Trends, Growth & Forecast 2025 to 2035
Bus Flooring Market Growth – Trends & Forecast 2025 to 2035
Eco Flooring Market Analysis - Growth, Demand & Forecast 2025 to 2035
Gas Floor Fryers Market
Underfloor Heating Market Size and Share Forecast Outlook 2025 to 2035
Underfloor Air Distribution Systems Market
Vinyl Flooring Market Growth - Trends & Forecast 2025 to 2035
Pelvic Floor Diagnostics Market - Demand & Forecast 2025 to 2035
Pelvic Floor Stimulators Market – Trends & Forecast 2025 to 2035
Pelvic Floor Diagnostic Testing Market

Thank you!
You will receive an email from our Business Development Manager. Please be sure to check your SPAM/JUNK folder too.
Chat With
MaRIA