Reports

- Global Locations -

Headquarters

Future Market Insights, Inc.

Christiana Corporate, 200
Continental Drive, Suite 401,
Newark, Delaware - 19713,
United States

T: +1-845-579-5705

Americas

Future Market Insights, Inc.

616 Corporate Way, Suite 2-9018,
Valley Cottage, NY 10989, United States

T: +1-347-918-3531

MEA

Future Market Insights

1602-6 Jumeirah Bay X2 Tower, Plot No: JLT-PH2-X2A,
Jumeirah Lakes Towers, Dubai,
United Arab Emirates

Europe

Future Market Insights

3rd Floor, 207 Regent Street,
W1B 3HH London
United Kingdom

T: + 44 (0) 20 8123 9659
D: +44 (0) 20 3287 4268

Asia Pacific

Future Market Insights

IndiaLand Global Tech Park, Unit UG-1, Behind Grand HighStreet, Phase 1, Hinjawadi, MH, Pune – 411057, India

Floor Lamp Market Outlook

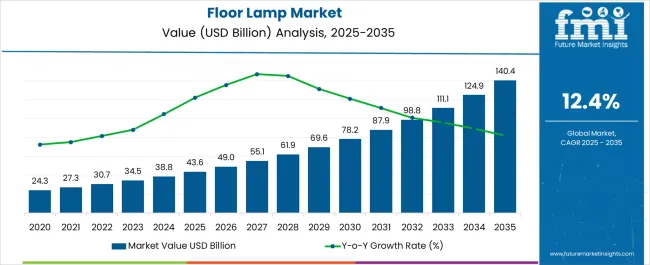
The global floor lamp market size is estimated to be US$ 34,516.70 million by 2023. The demand for floor lamps is expected to accelerate at a robust CAGR of 12.4% from 2023 to 2033. The market is projected to reach US$ 1,11,289.4 million by 2033.

As industries like hotels and residential construction and wiring evolve, the demand for floor lamps witnesses a boom in sales. Consumer interest in contemporary lighting options generates more light with less energy consumption.

Fluorescent and halogen bulbs use more energy and produce more heat. LED floor lamps use 90% less energy to make the same amount of light as conventional lamps. Typically, floor lamps increase the amount of light in the space. In emerging economies, it strengthens sales of floor lamps.

Attributes Details
Market Value for 2023 US$ 34,516.70 million
Market Value for 2033 US$ 1,11,289.4 million
Market CAGR from 2023 to 2033 12.4%

Don't pay for what you don't need

Customize your report by selecting specific countries or regions and save 30%!

Factors Driving Floor Lamp Market Growth

  • The main factor propelling the floor lamp market is shifting consumer tastes and preferences in home interior lighting solutions. When customers frequently seek after tastes in interior design change, floor lamps improve the visual appeal of their living areas.
  • A significant factor driving the floor lamp market is the increasing adoption of energy-efficient LED lighting technology. LED floor lamps reduce energy use and maintenance expenses, offering an appealing choice for customers.
  • Consumer preferences for styles, designs, and finishes influence the floor lamp market. Modern and minimalist designs, as well as traditional and classic designs, are highly preferred.
  • The steady demand for lighting solutions in residential, commercial, and industrial spaces is fueled by population growth and urbanization, contributing to market expansion for floor lamps.
  • Sustainable, energy-saving, and environmentally friendly lighting options are higher in demand, stimulating sales of floor lamps.
  • The need for illuminated home offices and the prevalence of remote work have raised the need for task-illuminating floor lamps that enhance the aesthetics of home offices.

Floor Lamp Market Outlook from 2018 to 2022 and Future Projections from 2023 to 2033

The floor lamp market developed steadily due to the rising demand for energy-efficient LED technology and interior lighting solutions. Conventional designs dominated the floor lamp market during the forecast period. The popularity of smart and adjustable floor lamps increased during the historical period.

Historical Market Valuation, 2022 US$ 33,425.70 million

The standing lamp market is expected to advance over the forecast period. Eco-friendliness and sustainability are essential, and increasing solar-powered and recyclable options are expected to stimulate market growth. The next generation of smart lamps intends to incorporate sophisticated AI and IoT features. Customers demand individualized designs and color options, so customization is a significant trend.

With an emphasis on customization, technology, and sustainability, sales of floor lamps have the potential for innovation and expansion from 2023 to 2033.

Sneha Verghese
Sneha Verghese

Principal Consultant

Talk to Analyst

Find your sweet spots for generating winning opportunities in this market.

Restraints in the Floor Lamp Market

  • The high cost of labor, materials, and production procedures restricts the floor lamp industry’s growth. Floor lamps have become more expensive for specific customers due to increased retail prices resulting from high manufacturing costs.
  • Consumers may find floor lamps less appealing due to this lack of creativity and development in the design and technology of floor-standing lamps.
  • Trends in home interior lighting solutions and consumer preferences are ever-changing. The floor lamp demand diminishes with the introduction of new designs, affecting the market negatively.
  • A variety of alternative lighting options compete with floor lamps, which may restrict floor lamp sales.

Comparative View of Adjacent Floor Lamp Market

The ultraviolet (UV) lamp market and the phototherapy lamp market have been discussed in conjunction with the floor lamp market. The data depicts the projected growth of the floor lamp market over the forecast period. It showcases the potential for revenue in the additional markets shown below.

Floor Lamp Market:

Attributes Floor Lamp Market
Value-based CAGR (2023 to 2033) 12.4%
Projected Market Value (2033) US$ 1,11,289.4 million
Market Trends
  • LED lighting that uses less energy is becoming increasingly common in floor lamps.
  • One significant market trend is smart floor lamps with voice activation and app control.
Growth Factors
  • Modern and minimalist designs propel the floor lamp demand.
  • Environmentally friendly options and sustainable materials are becoming more popular.

Ultra Violet (UV) Lamp Market:

Attributes Ultra Violet (UV) Lamp Market
Value-based CAGR (2023 to 2033) 11.4%
Projected Market Value (2033) US$ 1,139.2 million
Market Trends
  • Increasing need for UV lights in water purification.
  • In disinfection, UV-C technology is becoming more popular.
Growth Factors
  • UV curing in manufacturing drives the UV lamp market.
  • Advancing the use of UV lights for air purification.

Phototherapy Lamps Market:

Attributes Phototherapy Lamps Market
Value-based CAGR (2023 to 2033) 6.8%
Projected Market Value (2033) US$ 6,551.8 million
Market Trends
  • A booming older population is pushing up demand for dermatological care.
  • Increasing knowledge of phototherapy's advantages.
Growth Factors
  • Expanding interest in non-invasive therapy alternatives.

Get the data you need at a Fraction of the cost

Personalize your report by choosing insights you need
and save 40%!

Category-wise Insights

The subsequent section contains the floor lamp categorized market overview. In-depth analyses indicate that the household segment dominates the application category, and the modern floor lamp sector is leading the product type category.

Modern Floor Lamp Segment Illuminate the Path to Market Supremacy

Top Product Type Modern Floor Lamp
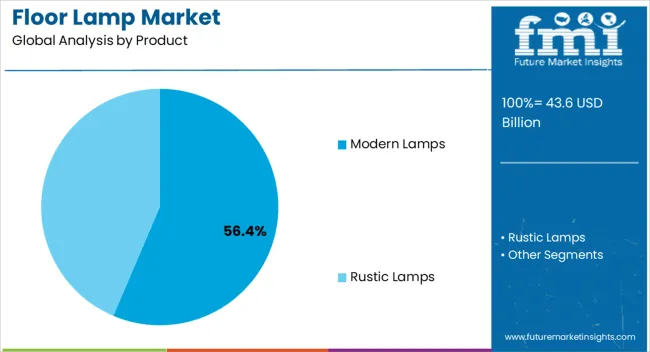
Segment Share in 2023 36.70%

The modern floor lamps category has taken the lead in floor lamp sales, demonstrating its dominance in the highly saturated market. It is explained by consumers' increasing inclination toward sleek, modern designs that go well with the aesthetics of contemporary interiors.

Contemporary LED floor lamps frequently incorporate sleek designs, cutting-edge materials, and modern lighting technologies to complement the changing preferences and way of life of today's consumers. The widespread appeal highlights its importance for the lighting industry to remain aware of design trends and customer needs, as the floor lamp industry is constantly changing to accommodate shifting tastes in interior design.

The Household Segment's Key Role in Rising Market Revenue

Top Application Household
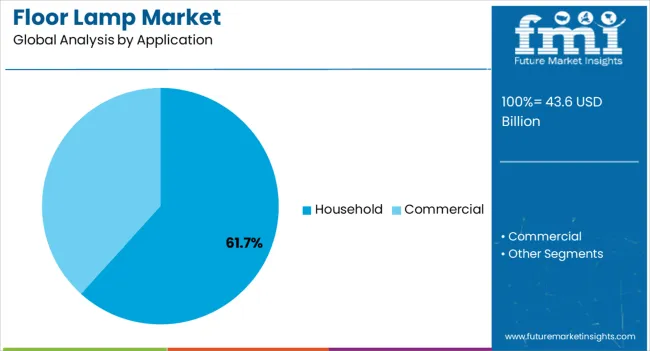
Segment Share in 2023 38.70%

Due to its widespread adoption for diverse residential lighting needs, the household segment leads the sales of floor lamps. The energy-efficient LED floor lamps are decorative and functional, adding depth to interior design and offering various lighting options for living areas.

Although the commercial segment holds significance of its own, the household segment is the primary determinant of floor lamp sales due to its more extensive consumer base and the personalization it offers for various domestic settings.
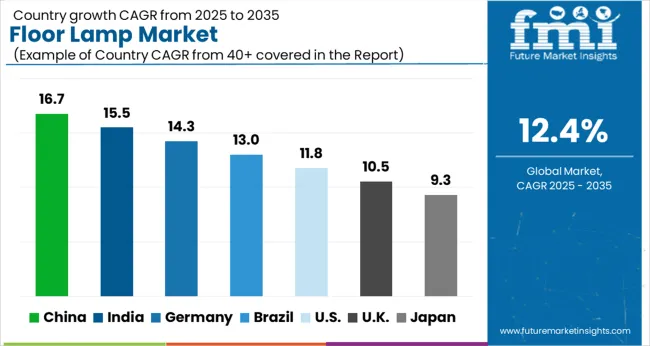
Country-wise Analysis

The following tables exhibit the floor lamp market growth based on the dominant economies in North America, Europe, and Asia Pacific. Upon extensive investigation, it is evident that Asia Pacific's manufacturers are incredibly resilient, providing numerous opportunities.

Attributes CAGR (2023 to 2033)
India 14.5%
Japan 14.1%
Australia 12.8%
Singapore 12.3%
China 11.9%

Shedding Light on the Asia Pacific Floor Lamp Market

Tradition Meets Modernity in India Floor Lamp Market

  • India floor lamp sales are expanding steadily due to rising middle-class demand and increasing living standards.
  • In India, traditional and ornamental floor lamps are widely used, indicative of the nation's rich cultural legacy.
  • The market in India is influenced by affordability and sustainability as important deciding factors.
  • The demand for handwoven floor lamps is rising locally, supporting traditional craftsmanship in the floor lamp industry.

Embracing Minimalism and Technology in the Japanese Market

  • In line with Japanese aesthetics, minimalist and space-saving designs are popular in the standing lamp market in Japan.
  • Durability and superior material quality are crucial attributes attracting consumers.
  • The consumers are shifting their preferences toward smart home integration and voice-activated floor lamps.

Coastal Aesthetics and Eco-Consciousness of the Australia Floor Lamp Industry

  • Australia's preference for floor lamps that blend in with the nation's natural and coastal design aesthetics is evident in the market for floor lamps.
  • Innovation in products and consumer preferences are driven by LED technology and energy efficiency.
  • Australian consumers now have access to a vast array of floor lamp options owing to the growing popularity of online retailing as a distribution channel.
  • In Australia's tech-savvy market, floor lamps with integrated wireless charging capabilities are increasing in popularity.

Sustainable Brilliance of The Floor Lamp Market in Singapore

  • Small living areas and a penchant for multipurpose designs influence the market in Singapore.
  • Floor lamps that are environmentally friendly and sustainable are higher in demand, supporting Singapore's green initiatives.
  • In Singapore's competitive market, luxury and designer floor lamps are becoming progressively popular among affluent consumers.

China's Booming Floor Lamp Market for Urbanization and Innovation
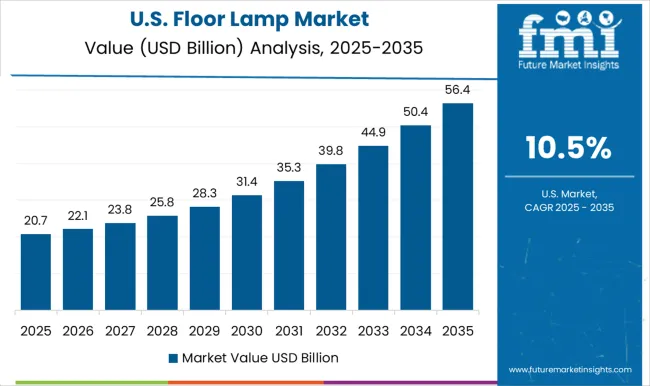
  • The rising need for interior lighting solutions and urbanization are stimulating the growth of the floor lamp market in China.
  • Environmental concerns and technological advancements have increased the popularity of energy-efficient and smart floor lamps in China.
  • Floor lamps are primarily distributed through eCommerce sites, as customers prefer this method of shopping.

Lighting Up the Future of the North American Market

Attributes CAGR (2023 to 2033)
Canada 9.6%
United States 8.1%

Evolving Trends in the United States Floor Lamp Market

  • The demand for fashionable and valuable lighting solutions is fueling the market growth for floor lamps in the United States.
  • Energy-efficient LED floor lamps are becoming prevalent among consumers in the United States, helping the market focus on sustainability.
  • The market's preferences are influenced by the United States design trends that favor minimalist and contemporary floor lamp styles.

Smart Lighting Solutions Gain Traction in Canada
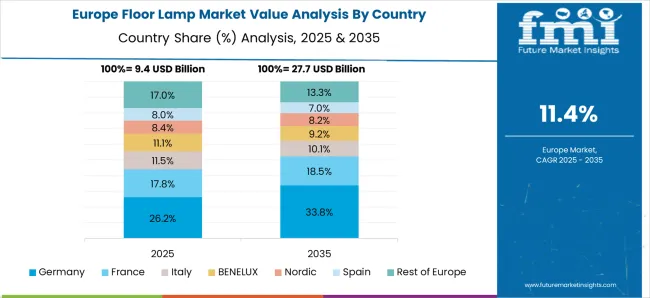
  • The Canada floor lamp demand is resilient, favoring floor lamps that blend with various interior design styles.
  • As they incorporate technology into their homes, Canadian consumers are increasingly interested in smart floor lamps.
  • Regional differences are seen in the Canada standing lamp industry, with rural areas preferring traditional styles and the urban regions highlighting modern designs.
  • In the Canada floor lamp industry, sustainability is a significant factor, and energy- and environmentally-conscious floor lamps are a growing trend.

Illuminating Opportunities in the European Market

Attributes CAGR (2023 to 2033)
France 9%
Spain 8.5%
United Kingdom 7.4%
Italy 7.2%
Germany 6.6%

Artistry and Creativity in Floor Lamps in France

  • Floor lamps in French interior design exhibit a harmony between traditional and contemporary aesthetics.
  • When choosing floor lamps, French buyers place a premium on aesthetics and creative components.
  • In the French floor lamp industry, sustainability and locally sourced materials are becoming more popular.

Market's Influence on Floor Lamp Designs in Spain

  • One of the characteristics of the Spain floor lamp market is the preference for vivid and colorful designs.
  • Floor lamps that are adjustable and energy-efficient are becoming popular in Spain.
  • While eCommerce is expanding, traditional retail establishments are still important.
  • Spanish buyers frequently look for floor lamps that complement the Mediterranean-style interior design.

Smart and Energy-Efficient Lighting Trends in the United Kingdom Floor Lamp Market

  • Combinations of modern and traditional designs impact the market in the United Kingdom.
  • British consumers are adopting energy-efficient and intelligent lighting technologies.
  • Trends in interior design and online shopping are shaping the distribution and design choices in the United Kingdom market.
  • Space-saving and multipurpose floor lamp designs are popular among British consumers.

Eco-Consciousness and Luxury Influences the Italy Floor Lamp Market

  • Italian floor lamp buyers place a high value on craftsmanship and design.
  • Italy is a country where floor lamps frequently combine traditional and modern design elements.
  • Sustainable materials and environmental consciousness are growing market share in Italy.

Sustainable Trends in the German Floor Lamp Industry
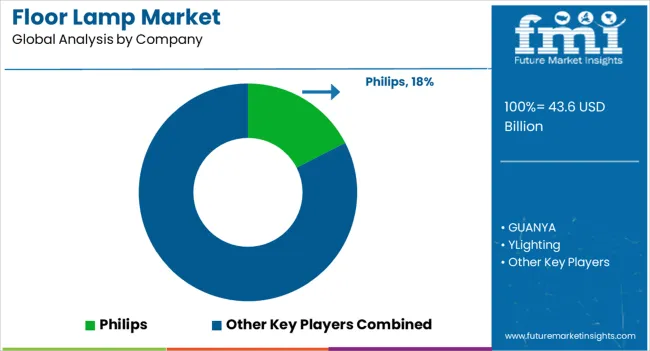
  • A desire for contemporary, energy-efficient lighting primarily compels Germany's floor lamp sales.
  • High-end options are rising in demand as German consumers prioritize durability and quality when selecting floor lamps.
  • The German market is experiencing increased demand for eco-friendly and sustainable designs.
  • The retail environment for floor lamp sales in Germany has changed due to the notable expansion of eCommerce channels.

Competitive Analysis

The emergence of energy-efficient floor lamps and shifting consumer preferences have intensified competition in the floor lamp market. To obtain a competitive advantage, significant floor lamp vendors use aggressive pricing tactics and creative designs.

The floor lamp manufacturers should spend on research and development to advance lamp technology and add intelligence. The floor lamp companies use eco-friendly and sustainable materials to make a statement. With their ability to provide direct-to-consumer sales channels and a wider reach, eCommerce platforms have become essential. Navigating the competitive landscape requires a focus on customer-centric approaches, branding, and timely monitoring of trends in interior lighting and floor-standing lamps.

Contemporary Developments

Company Details
Koninklijke Philips N.V. The functionality of Philips' floor lamps is going to be improved with the release of new smart lighting products in 2021 to be compatible with a variety of smart home ecosystems.
Osram GmbH Osram has been concentrating on energy-efficient lighting solutions and LED technology development. It added cutting-edge LED floor lamps to its growing product line.
IKEA Group IKEA has unveiled some innovative floor lamp designs emphasizing style and functionality and blending perfectly with its current furniture collections.
Artemide S.p.A. Artemide has been working with well-known designers to produce original floor lamp designs, upholding its reputation for producing modern lighting fixtures of the highest caliber.
Kichler Lighting To increase the accessibility of its floor lamps, Kichler Lighting has been aggressively growing its distribution networks and forming alliances with lighting retailers.

Key Floor Lamp Manufacturers

  • GUANYA
  • YLighting
  • Philips
  • AOZZO
  • Matsushita Electric (China) Co. Ltd
  • OPPLE
  • IKEA
  • Zhongshan Huayi Lighting
  • Guangdong PAK Corporation

Key Segments

By Product:

  • Modern Lamps
  • Rustic Lamps

By Application:

  • Household
  • Commercial

By Distribution Channel:

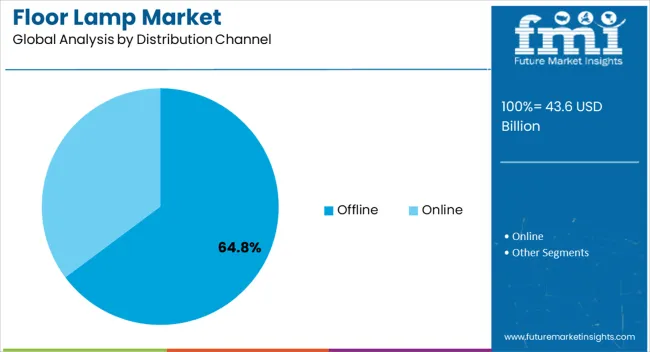
  • Online
  • Offline

By Region:

  • North America
  • Western Europe
  • Eastern Europe
  • Middle East and Africa
  • ASEAN
  • South Asia
  • Rest of Asia
  • Australia and New Zealand

Frequently Asked Questions

What is the Current Floor Lamp Market Valuation?

The floor lamp market size is US$ 34,516.70 million in 2023.

How Big will the Floor Lamp Market Be by 2033?

The market is expected to reach US$ 1,11,289.4 million by 2033.

What is the Growth Potential of the Floor Lamp Market?

Through 2033, the global market is anticipated to expand at a 12.4% CAGR.

What was the Floor Lamp Market Valuation in 2022?

The market secured a valuation of US$ 33,425.70 million in 2022.

Which Product Type Segment Dominates the Floor Lamp Market?

The modern floor lamp segment dominates the market with a share of 36.70%.

Which is the Leading Application Segment in the Floor Lamp Market?

The household segment is expected to account for 38.70% of the market share.

Table of Content

1. Executive Summary

    1.1. Global Market Outlook

    1.2. Demand-side Trends

    1.3. Supply-side Trends

    1.4. Technology Roadmap Analysis

    1.5. Analysis and Recommendations

2. Market Overview

    2.1. Market Coverage / Taxonomy

    2.2. Market Definition / Scope / Limitations

3. Market Background

    3.1. Market Dynamics

        3.1.1. Drivers

        3.1.2. Restraints

        3.1.3. Opportunity

        3.1.4. Trends

    3.2. Scenario Forecast

        3.2.1. Demand in Optimistic Scenario

        3.2.2. Demand in Likely Scenario

        3.2.3. Demand in Conservative Scenario

    3.3. Opportunity Map Analysis

    3.4. Product Life Cycle Analysis

    3.5. Supply Chain Analysis

        3.5.1. Supply Side Participants and their Roles

            3.5.1.1. Producers

            3.5.1.2. Mid-Level Participants (Traders/ Agents/ Brokers)

            3.5.1.3. Wholesalers and Distributors

        3.5.2. Value Added and Value Created at Node in the Supply Chain

        3.5.3. List of Raw Material Suppliers

        3.5.4. List of Existing and Potential Buyer’s

    3.6. Investment Feasibility Matrix

    3.7. Value Chain Analysis

        3.7.1. Profit Margin Analysis

        3.7.2. Wholesalers and Distributors

        3.7.3. Retailers

    3.8. PESTLE and Porter’s Analysis

    3.9. Regulatory Landscape

        3.9.1. By Key Regions

        3.9.2. By Key Countries

    3.10. Regional Parent Market Outlook

    3.11. Production and Consumption Statistics

    3.12. Import and Export Statistics

4. Global Market Analysis 2018 to 2022 and Forecast, 2023 to 2033

    4.1. Historical Market Size Value (US$ Million) & Volume (Units) Analysis, 2018 to 2022

    4.2. Current and Future Market Size Value (US$ Million) & Volume (Units) Projections, 2023 to 2033

        4.2.1. Y-o-Y Growth Trend Analysis

        4.2.2. Absolute $ Opportunity Analysis

5. Global Market Analysis 2018 to 2022 and Forecast 2023 to 2033, By Product Type

    5.1. Introduction / Key Findings

    5.2. Historical Market Size Value (US$ Million) & Volume (Units) Analysis By Product Type, 2018 to 2022

    5.3. Current and Future Market Size Value (US$ Million) & Volume (Units) Analysis and Forecast By Product Type, 2023 to 2033

        5.3.1. Modern Floor Lamps

        5.3.2. Rustic Floor Lamps

        5.3.3. Classic Floor Lamps

        5.3.4. Others

    5.4. Y-o-Y Growth Trend Analysis By Product Type, 2018 to 2022

    5.5. Absolute $ Opportunity Analysis By Product Type, 2023 to 2033

6. Global Market Analysis 2018 to 2022 and Forecast 2023 to 2033, By Application

    6.1. Introduction / Key Findings

    6.2. Historical Market Size Value (US$ Million) & Volume (Units) Analysis By Application, 2018 to 2022

    6.3. Current and Future Market Size Value (US$ Million) & Volume (Units) Analysis and Forecast By Application, 2023 to 2033

        6.3.1. Household

        6.3.2. Commercial

        6.3.3. Industrial

    6.4. Y-o-Y Growth Trend Analysis By Application, 2018 to 2022

    6.5. Absolute $ Opportunity Analysis By Application, 2023 to 2033

7. Global Market Analysis 2018 to 2022 and Forecast 2023 to 2033, By Sales Channels

    7.1. Introduction / Key Findings

    7.2. Historical Market Size Value (US$ Million) & Volume (Units) Analysis By Sales Channels, 2018 to 2022

    7.3. Current and Future Market Size Value (US$ Million) & Volume (Units) Analysis and Forecast By Sales Channels, 2023 to 2033

        7.3.1. Online

        7.3.2. Offline

    7.4. Y-o-Y Growth Trend Analysis By Sales Channels, 2018 to 2022

    7.5. Absolute $ Opportunity Analysis By Sales Channels, 2023 to 2033

8. Global Market Analysis 2018 to 2022 and Forecast 2023 to 2033, By Region

    8.1. Introduction

    8.2. Historical Market Size Value (US$ Million) & Volume (Units) Analysis By Region, 2018 to 2022

    8.3. Current Market Size Value (US$ Million) & Volume (Units) Analysis and Forecast By Region, 2023 to 2033

        8.3.1. North America

        8.3.2. Latin America

        8.3.3. Western Europe

        8.3.4. Eastern Europe

        8.3.5. South Asia and Pacific

        8.3.6. East Asia

        8.3.7. Middle East and Africa

    8.4. Market Attractiveness Analysis By Region

9. North America Market Analysis 2018 to 2022 and Forecast 2023 to 2033, By Country

    9.1. Historical Market Size Value (US$ Million) & Volume (Units) Trend Analysis By Market Taxonomy, 2018 to 2022

    9.2. Market Size Value (US$ Million) & Volume (Units) Forecast By Market Taxonomy, 2023 to 2033

        9.2.1. By Country

            9.2.1.1. USA

            9.2.1.2. Canada

        9.2.2. By Product Type

        9.2.3. By Application

        9.2.4. By Sales Channels

    9.3. Market Attractiveness Analysis

        9.3.1. By Country

        9.3.2. By Product Type

        9.3.3. By Application

        9.3.4. By Sales Channels

    9.4. Key Takeaways

10. Latin America Market Analysis 2018 to 2022 and Forecast 2023 to 2033, By Country

    10.1. Historical Market Size Value (US$ Million) & Volume (Units) Trend Analysis By Market Taxonomy, 2018 to 2022

    10.2. Market Size Value (US$ Million) & Volume (Units) Forecast By Market Taxonomy, 2023 to 2033

        10.2.1. By Country

            10.2.1.1. Brazil

            10.2.1.2. Mexico

            10.2.1.3. Rest of Latin America

        10.2.2. By Product Type

        10.2.3. By Application

        10.2.4. By Sales Channels

    10.3. Market Attractiveness Analysis

        10.3.1. By Country

        10.3.2. By Product Type

        10.3.3. By Application

        10.3.4. By Sales Channels

    10.4. Key Takeaways

11. Western Europe Market Analysis 2018 to 2022 and Forecast 2023 to 2033, By Country

    11.1. Historical Market Size Value (US$ Million) & Volume (Units) Trend Analysis By Market Taxonomy, 2018 to 2022

    11.2. Market Size Value (US$ Million) & Volume (Units) Forecast By Market Taxonomy, 2023 to 2033

        11.2.1. By Country

            11.2.1.1. Germany

            11.2.1.2. UK

            11.2.1.3. France

            11.2.1.4. Spain

            11.2.1.5. Italy

            11.2.1.6. Rest of Western Europe

        11.2.2. By Product Type

        11.2.3. By Application

        11.2.4. By Sales Channels

    11.3. Market Attractiveness Analysis

        11.3.1. By Country

        11.3.2. By Product Type

        11.3.3. By Application

        11.3.4. By Sales Channels

    11.4. Key Takeaways

12. Eastern Europe Market Analysis 2018 to 2022 and Forecast 2023 to 2033, By Country

    12.1. Historical Market Size Value (US$ Million) & Volume (Units) Trend Analysis By Market Taxonomy, 2018 to 2022

    12.2. Market Size Value (US$ Million) & Volume (Units) Forecast By Market Taxonomy, 2023 to 2033

        12.2.1. By Country

            12.2.1.1. Poland

            12.2.1.2. Russia

            12.2.1.3. Czech Republic

            12.2.1.4. Romania

            12.2.1.5. Rest of Eastern Europe

        12.2.2. By Product Type

        12.2.3. By Application

        12.2.4. By Sales Channels

    12.3. Market Attractiveness Analysis

        12.3.1. By Country

        12.3.2. By Product Type

        12.3.3. By Application

        12.3.4. By Sales Channels

    12.4. Key Takeaways

13. South Asia and Pacific Market Analysis 2018 to 2022 and Forecast 2023 to 2033, By Country

    13.1. Historical Market Size Value (US$ Million) & Volume (Units) Trend Analysis By Market Taxonomy, 2018 to 2022

    13.2. Market Size Value (US$ Million) & Volume (Units) Forecast By Market Taxonomy, 2023 to 2033

        13.2.1. By Country

            13.2.1.1. India

            13.2.1.2. Bangladesh

            13.2.1.3. Australia

            13.2.1.4. New Zealand

            13.2.1.5. Rest of South Asia and Pacific

        13.2.2. By Product Type

        13.2.3. By Application

        13.2.4. By Sales Channels

    13.3. Market Attractiveness Analysis

        13.3.1. By Country

        13.3.2. By Product Type

        13.3.3. By Application

        13.3.4. By Sales Channels

    13.4. Key Takeaways

14. East Asia Market Analysis 2018 to 2022 and Forecast 2023 to 2033, By Country

    14.1. Historical Market Size Value (US$ Million) & Volume (Units) Trend Analysis By Market Taxonomy, 2018 to 2022

    14.2. Market Size Value (US$ Million) & Volume (Units) Forecast By Market Taxonomy, 2023 to 2033

        14.2.1. By Country

            14.2.1.1. China

            14.2.1.2. Japan

            14.2.1.3. South Korea

        14.2.2. By Product Type

        14.2.3. By Application

        14.2.4. By Sales Channels

    14.3. Market Attractiveness Analysis

        14.3.1. By Country

        14.3.2. By Product Type

        14.3.3. By Application

        14.3.4. By Sales Channels

    14.4. Key Takeaways

15. Middle East and Africa Market Analysis 2018 to 2022 and Forecast 2023 to 2033, By Country

    15.1. Historical Market Size Value (US$ Million) & Volume (Units) Trend Analysis By Market Taxonomy, 2018 to 2022

    15.2. Market Size Value (US$ Million) & Volume (Units) Forecast By Market Taxonomy, 2023 to 2033

        15.2.1. By Country

            15.2.1.1. GCC Countries

            15.2.1.2. South Africa

            15.2.1.3. Israel

            15.2.1.4. Rest of MEA

        15.2.2. By Product Type

        15.2.3. By Application

        15.2.4. By Sales Channels

    15.3. Market Attractiveness Analysis

        15.3.1. By Country

        15.3.2. By Product Type

        15.3.3. By Application

        15.3.4. By Sales Channels

    15.4. Key Takeaways

16. Key Countries Market Analysis

    16.1. USA

        16.1.1. Pricing Analysis

        16.1.2. Market Share Analysis, 2022

            16.1.2.1. By Product Type

            16.1.2.2. By Application

            16.1.2.3. By Sales Channels

    16.2. Canada

        16.2.1. Pricing Analysis

        16.2.2. Market Share Analysis, 2022

            16.2.2.1. By Product Type

            16.2.2.2. By Application

            16.2.2.3. By Sales Channels

    16.3. Brazil

        16.3.1. Pricing Analysis

        16.3.2. Market Share Analysis, 2022

            16.3.2.1. By Product Type

            16.3.2.2. By Application

            16.3.2.3. By Sales Channels

    16.4. Mexico

        16.4.1. Pricing Analysis

        16.4.2. Market Share Analysis, 2022

            16.4.2.1. By Product Type

            16.4.2.2. By Application

            16.4.2.3. By Sales Channels

    16.5. Germany

        16.5.1. Pricing Analysis

        16.5.2. Market Share Analysis, 2022

            16.5.2.1. By Product Type

            16.5.2.2. By Application

            16.5.2.3. By Sales Channels

    16.6. UK

        16.6.1. Pricing Analysis

        16.6.2. Market Share Analysis, 2022

            16.6.2.1. By Product Type

            16.6.2.2. By Application

            16.6.2.3. By Sales Channels

    16.7. France

        16.7.1. Pricing Analysis

        16.7.2. Market Share Analysis, 2022

            16.7.2.1. By Product Type

            16.7.2.2. By Application

            16.7.2.3. By Sales Channels

    16.8. Spain

        16.8.1. Pricing Analysis

        16.8.2. Market Share Analysis, 2022

            16.8.2.1. By Product Type

            16.8.2.2. By Application

            16.8.2.3. By Sales Channels

    16.9. Italy

        16.9.1. Pricing Analysis

        16.9.2. Market Share Analysis, 2022

            16.9.2.1. By Product Type

            16.9.2.2. By Application

            16.9.2.3. By Sales Channels

    16.10. Poland

        16.10.1. Pricing Analysis

        16.10.2. Market Share Analysis, 2022

            16.10.2.1. By Product Type

            16.10.2.2. By Application

            16.10.2.3. By Sales Channels

    16.11. Russia

        16.11.1. Pricing Analysis

        16.11.2. Market Share Analysis, 2022

            16.11.2.1. By Product Type

            16.11.2.2. By Application

            16.11.2.3. By Sales Channels

    16.12. Czech Republic

        16.12.1. Pricing Analysis

        16.12.2. Market Share Analysis, 2022

            16.12.2.1. By Product Type

            16.12.2.2. By Application

            16.12.2.3. By Sales Channels

    16.13. Romania

        16.13.1. Pricing Analysis

        16.13.2. Market Share Analysis, 2022

            16.13.2.1. By Product Type

            16.13.2.2. By Application

            16.13.2.3. By Sales Channels

    16.14. India

        16.14.1. Pricing Analysis

        16.14.2. Market Share Analysis, 2022

            16.14.2.1. By Product Type

            16.14.2.2. By Application

            16.14.2.3. By Sales Channels

    16.15. Bangladesh

        16.15.1. Pricing Analysis

        16.15.2. Market Share Analysis, 2022

            16.15.2.1. By Product Type

            16.15.2.2. By Application

            16.15.2.3. By Sales Channels

    16.16. Australia

        16.16.1. Pricing Analysis

        16.16.2. Market Share Analysis, 2022

            16.16.2.1. By Product Type

            16.16.2.2. By Application

            16.16.2.3. By Sales Channels

    16.17. New Zealand

        16.17.1. Pricing Analysis

        16.17.2. Market Share Analysis, 2022

            16.17.2.1. By Product Type

            16.17.2.2. By Application

            16.17.2.3. By Sales Channels

    16.18. China

        16.18.1. Pricing Analysis

        16.18.2. Market Share Analysis, 2022

            16.18.2.1. By Product Type

            16.18.2.2. By Application

            16.18.2.3. By Sales Channels

    16.19. Japan

        16.19.1. Pricing Analysis

        16.19.2. Market Share Analysis, 2022

            16.19.2.1. By Product Type

            16.19.2.2. By Application

            16.19.2.3. By Sales Channels

    16.20. South Korea

        16.20.1. Pricing Analysis

        16.20.2. Market Share Analysis, 2022

            16.20.2.1. By Product Type

            16.20.2.2. By Application

            16.20.2.3. By Sales Channels

    16.21. GCC Countries

        16.21.1. Pricing Analysis

        16.21.2. Market Share Analysis, 2022

            16.21.2.1. By Product Type

            16.21.2.2. By Application

            16.21.2.3. By Sales Channels

    16.22. South Africa

        16.22.1. Pricing Analysis

        16.22.2. Market Share Analysis, 2022

            16.22.2.1. By Product Type

            16.22.2.2. By Application

            16.22.2.3. By Sales Channels

    16.23. Israel

        16.23.1. Pricing Analysis

        16.23.2. Market Share Analysis, 2022

            16.23.2.1. By Product Type

            16.23.2.2. By Application

            16.23.2.3. By Sales Channels

17. Market Structure Analysis

    17.1. Competition Dashboard

    17.2. Competition Benchmarking

    17.3. Market Share Analysis of Top Players

        17.3.1. By Regional

        17.3.2. By Product Type

        17.3.3. By Application

        17.3.4. By Sales Channels

18. Competition Analysis

    18.1. Competition Deep Dive

        18.1.1. IKEA

            18.1.1.1. Overview

            18.1.1.2. Product Portfolio

            18.1.1.3. Profitability by Market Segments

            18.1.1.4. Sales Footprint

            18.1.1.5. Strategy Overview

                18.1.1.5.1. Marketing Strategy

                18.1.1.5.2. Product Strategy

                18.1.1.5.3. Channel Strategy

        18.1.2. Zhongshan Huayi Lighting

            18.1.2.1. Overview

            18.1.2.2. Product Portfolio

            18.1.2.3. Profitability by Market Segments

            18.1.2.4. Sales Footprint

            18.1.2.5. Strategy Overview

                18.1.2.5.1. Marketing Strategy

                18.1.2.5.2. Product Strategy

                18.1.2.5.3. Channel Strategy

        18.1.3. Venini

            18.1.3.1. Overview

            18.1.3.2. Product Portfolio

            18.1.3.3. Profitability by Market Segments

            18.1.3.4. Sales Footprint

            18.1.3.5. Strategy Overview

                18.1.3.5.1. Marketing Strategy

                18.1.3.5.2. Product Strategy

                18.1.3.5.3. Channel Strategy

        18.1.4. AOZZO

            18.1.4.1. Overview

            18.1.4.2. Product Portfolio

            18.1.4.3. Profitability by Market Segments

            18.1.4.4. Sales Footprint

            18.1.4.5. Strategy Overview

                18.1.4.5.1. Marketing Strategy

                18.1.4.5.2. Product Strategy

                18.1.4.5.3. Channel Strategy

        18.1.5. YLighting

            18.1.5.1. Overview

            18.1.5.2. Product Portfolio

            18.1.5.3. Profitability by Market Segments

            18.1.5.4. Sales Footprint

            18.1.5.5. Strategy Overview

                18.1.5.5.1. Marketing Strategy

                18.1.5.5.2. Product Strategy

                18.1.5.5.3. Channel Strategy

        18.1.6. GUANYA

            18.1.6.1. Overview

            18.1.6.2. Product Portfolio

            18.1.6.3. Profitability by Market Segments

            18.1.6.4. Sales Footprint

            18.1.6.5. Strategy Overview

                18.1.6.5.1. Marketing Strategy

                18.1.6.5.2. Product Strategy

                18.1.6.5.3. Channel Strategy

        18.1.7. Philips

            18.1.7.1. Overview

            18.1.7.2. Product Portfolio

            18.1.7.3. Profitability by Market Segments

            18.1.7.4. Sales Footprint

            18.1.7.5. Strategy Overview

                18.1.7.5.1. Marketing Strategy

                18.1.7.5.2. Product Strategy

                18.1.7.5.3. Channel Strategy

        18.1.8. Baulmann Leuchten

            18.1.8.1. Overview

            18.1.8.2. Product Portfolio

            18.1.8.3. Profitability by Market Segments

            18.1.8.4. Sales Footprint

            18.1.8.5. Strategy Overview

                18.1.8.5.1. Marketing Strategy

                18.1.8.5.2. Product Strategy

                18.1.8.5.3. Channel Strategy

        18.1.9. OPPLE

            18.1.9.1. Overview

            18.1.9.2. Product Portfolio

            18.1.9.3. Profitability by Market Segments

            18.1.9.4. Sales Footprint

            18.1.9.5. Strategy Overview

                18.1.9.5.1. Marketing Strategy

                18.1.9.5.2. Product Strategy

                18.1.9.5.3. Channel Strategy

        18.1.10. Anta Leuchten

            18.1.10.1. Overview

            18.1.10.2. Product Portfolio

            18.1.10.3. Profitability by Market Segments

            18.1.10.4. Sales Footprint

            18.1.10.5. Strategy Overview

                18.1.10.5.1. Marketing Strategy

                18.1.10.5.2. Product Strategy

                18.1.10.5.3. Channel Strategy

        18.1.11. Matsushita Electric (China) Co. Ltd

            18.1.11.1. Overview

            18.1.11.2. Product Portfolio

            18.1.11.3. Profitability by Market Segments

            18.1.11.4. Sales Footprint

            18.1.11.5. Strategy Overview

                18.1.11.5.1. Marketing Strategy

                18.1.11.5.2. Product Strategy

                18.1.11.5.3. Channel Strategy

19. Assumptions & Acronyms Used

20. Research Methodology

Don't pay for what you don't need

Customize your report by selecting specific countries or regions and save 30%!

List of Tables

Table 1: Global Market Value (US$ Million) Forecast by Region, 2018 to 2033

Table 2: Global Market Volume (Units) Forecast by Region, 2018 to 2033

Table 3: Global Market Value (US$ Million) Forecast by Product Type, 2018 to 2033

Table 4: Global Market Volume (Units) Forecast by Product Type, 2018 to 2033

Table 5: Global Market Value (US$ Million) Forecast by Application, 2018 to 2033

Table 6: Global Market Volume (Units) Forecast by Application, 2018 to 2033

Table 7: Global Market Value (US$ Million) Forecast by Sales Channels, 2018 to 2033

Table 8: Global Market Volume (Units) Forecast by Sales Channels, 2018 to 2033

Table 9: North America Market Value (US$ Million) Forecast by Country, 2018 to 2033

Table 10: North America Market Volume (Units) Forecast by Country, 2018 to 2033

Table 11: North America Market Value (US$ Million) Forecast by Product Type, 2018 to 2033

Table 12: North America Market Volume (Units) Forecast by Product Type, 2018 to 2033

Table 13: North America Market Value (US$ Million) Forecast by Application, 2018 to 2033

Table 14: North America Market Volume (Units) Forecast by Application, 2018 to 2033

Table 15: North America Market Value (US$ Million) Forecast by Sales Channels, 2018 to 2033

Table 16: North America Market Volume (Units) Forecast by Sales Channels, 2018 to 2033

Table 17: Latin America Market Value (US$ Million) Forecast by Country, 2018 to 2033

Table 18: Latin America Market Volume (Units) Forecast by Country, 2018 to 2033

Table 19: Latin America Market Value (US$ Million) Forecast by Product Type, 2018 to 2033

Table 20: Latin America Market Volume (Units) Forecast by Product Type, 2018 to 2033

Table 21: Latin America Market Value (US$ Million) Forecast by Application, 2018 to 2033

Table 22: Latin America Market Volume (Units) Forecast by Application, 2018 to 2033

Table 23: Latin America Market Value (US$ Million) Forecast by Sales Channels, 2018 to 2033

Table 24: Latin America Market Volume (Units) Forecast by Sales Channels, 2018 to 2033

Table 25: Western Europe Market Value (US$ Million) Forecast by Country, 2018 to 2033

Table 26: Western Europe Market Volume (Units) Forecast by Country, 2018 to 2033

Table 27: Western Europe Market Value (US$ Million) Forecast by Product Type, 2018 to 2033

Table 28: Western Europe Market Volume (Units) Forecast by Product Type, 2018 to 2033

Table 29: Western Europe Market Value (US$ Million) Forecast by Application, 2018 to 2033

Table 30: Western Europe Market Volume (Units) Forecast by Application, 2018 to 2033

Table 31: Western Europe Market Value (US$ Million) Forecast by Sales Channels, 2018 to 2033

Table 32: Western Europe Market Volume (Units) Forecast by Sales Channels, 2018 to 2033

Table 33: Eastern Europe Market Value (US$ Million) Forecast by Country, 2018 to 2033

Table 34: Eastern Europe Market Volume (Units) Forecast by Country, 2018 to 2033

Table 35: Eastern Europe Market Value (US$ Million) Forecast by Product Type, 2018 to 2033

Table 36: Eastern Europe Market Volume (Units) Forecast by Product Type, 2018 to 2033

Table 37: Eastern Europe Market Value (US$ Million) Forecast by Application, 2018 to 2033

Table 38: Eastern Europe Market Volume (Units) Forecast by Application, 2018 to 2033

Table 39: Eastern Europe Market Value (US$ Million) Forecast by Sales Channels, 2018 to 2033

Table 40: Eastern Europe Market Volume (Units) Forecast by Sales Channels, 2018 to 2033

Table 41: South Asia and Pacific Market Value (US$ Million) Forecast by Country, 2018 to 2033

Table 42: South Asia and Pacific Market Volume (Units) Forecast by Country, 2018 to 2033

Table 43: South Asia and Pacific Market Value (US$ Million) Forecast by Product Type, 2018 to 2033

Table 44: South Asia and Pacific Market Volume (Units) Forecast by Product Type, 2018 to 2033

Table 45: South Asia and Pacific Market Value (US$ Million) Forecast by Application, 2018 to 2033

Table 46: South Asia and Pacific Market Volume (Units) Forecast by Application, 2018 to 2033

Table 47: South Asia and Pacific Market Value (US$ Million) Forecast by Sales Channels, 2018 to 2033

Table 48: South Asia and Pacific Market Volume (Units) Forecast by Sales Channels, 2018 to 2033

Table 49: East Asia Market Value (US$ Million) Forecast by Country, 2018 to 2033

Table 50: East Asia Market Volume (Units) Forecast by Country, 2018 to 2033

Table 51: East Asia Market Value (US$ Million) Forecast by Product Type, 2018 to 2033

Table 52: East Asia Market Volume (Units) Forecast by Product Type, 2018 to 2033

Table 53: East Asia Market Value (US$ Million) Forecast by Application, 2018 to 2033

Table 54: East Asia Market Volume (Units) Forecast by Application, 2018 to 2033

Table 55: East Asia Market Value (US$ Million) Forecast by Sales Channels, 2018 to 2033

Table 56: East Asia Market Volume (Units) Forecast by Sales Channels, 2018 to 2033

Table 57: Middle East and Africa Market Value (US$ Million) Forecast by Country, 2018 to 2033

Table 58: Middle East and Africa Market Volume (Units) Forecast by Country, 2018 to 2033

Table 59: Middle East and Africa Market Value (US$ Million) Forecast by Product Type, 2018 to 2033

Table 60: Middle East and Africa Market Volume (Units) Forecast by Product Type, 2018 to 2033

Table 61: Middle East and Africa Market Value (US$ Million) Forecast by Application, 2018 to 2033

Table 62: Middle East and Africa Market Volume (Units) Forecast by Application, 2018 to 2033

Table 63: Middle East and Africa Market Value (US$ Million) Forecast by Sales Channels, 2018 to 2033

Table 64: Middle East and Africa Market Volume (Units) Forecast by Sales Channels, 2018 to 2033
Sneha Verghese
Sneha Verghese

Principal Consultant

Talk to Analyst

Find your sweet spots for generating winning opportunities in this market.

List of Charts

Figure 1: Global Market Value (US$ Million) by Product Type, 2023 to 2033

Figure 2: Global Market Value (US$ Million) by Application, 2023 to 2033

Figure 3: Global Market Value (US$ Million) by Sales Channels, 2023 to 2033

Figure 4: Global Market Value (US$ Million) by Region, 2023 to 2033

Figure 5: Global Market Value (US$ Million) Analysis by Region, 2018 to 2033

Figure 6: Global Market Volume (Units) Analysis by Region, 2018 to 2033

Figure 7: Global Market Value Share (%) and BPS Analysis by Region, 2023 to 2033

Figure 8: Global Market Y-o-Y Growth (%) Projections by Region, 2023 to 2033

Figure 9: Global Market Value (US$ Million) Analysis by Product Type, 2018 to 2033

Figure 10: Global Market Volume (Units) Analysis by Product Type, 2018 to 2033

Figure 11: Global Market Value Share (%) and BPS Analysis by Product Type, 2023 to 2033

Figure 12: Global Market Y-o-Y Growth (%) Projections by Product Type, 2023 to 2033

Figure 13: Global Market Value (US$ Million) Analysis by Application, 2018 to 2033

Figure 14: Global Market Volume (Units) Analysis by Application, 2018 to 2033

Figure 15: Global Market Value Share (%) and BPS Analysis by Application, 2023 to 2033

Figure 16: Global Market Y-o-Y Growth (%) Projections by Application, 2023 to 2033

Figure 17: Global Market Value (US$ Million) Analysis by Sales Channels, 2018 to 2033

Figure 18: Global Market Volume (Units) Analysis by Sales Channels, 2018 to 2033

Figure 19: Global Market Value Share (%) and BPS Analysis by Sales Channels, 2023 to 2033

Figure 20: Global Market Y-o-Y Growth (%) Projections by Sales Channels, 2023 to 2033

Figure 21: Global Market Attractiveness by Product Type, 2023 to 2033

Figure 22: Global Market Attractiveness by Application, 2023 to 2033

Figure 23: Global Market Attractiveness by Sales Channels, 2023 to 2033

Figure 24: Global Market Attractiveness by Region, 2023 to 2033

Figure 25: North America Market Value (US$ Million) by Product Type, 2023 to 2033

Figure 26: North America Market Value (US$ Million) by Application, 2023 to 2033

Figure 27: North America Market Value (US$ Million) by Sales Channels, 2023 to 2033

Figure 28: North America Market Value (US$ Million) by Country, 2023 to 2033

Figure 29: North America Market Value (US$ Million) Analysis by Country, 2018 to 2033

Figure 30: North America Market Volume (Units) Analysis by Country, 2018 to 2033

Figure 31: North America Market Value Share (%) and BPS Analysis by Country, 2023 to 2033

Figure 32: North America Market Y-o-Y Growth (%) Projections by Country, 2023 to 2033

Figure 33: North America Market Value (US$ Million) Analysis by Product Type, 2018 to 2033

Figure 34: North America Market Volume (Units) Analysis by Product Type, 2018 to 2033

Figure 35: North America Market Value Share (%) and BPS Analysis by Product Type, 2023 to 2033

Figure 36: North America Market Y-o-Y Growth (%) Projections by Product Type, 2023 to 2033

Figure 37: North America Market Value (US$ Million) Analysis by Application, 2018 to 2033

Figure 38: North America Market Volume (Units) Analysis by Application, 2018 to 2033

Figure 39: North America Market Value Share (%) and BPS Analysis by Application, 2023 to 2033

Figure 40: North America Market Y-o-Y Growth (%) Projections by Application, 2023 to 2033

Figure 41: North America Market Value (US$ Million) Analysis by Sales Channels, 2018 to 2033

Figure 42: North America Market Volume (Units) Analysis by Sales Channels, 2018 to 2033

Figure 43: North America Market Value Share (%) and BPS Analysis by Sales Channels, 2023 to 2033

Figure 44: North America Market Y-o-Y Growth (%) Projections by Sales Channels, 2023 to 2033

Figure 45: North America Market Attractiveness by Product Type, 2023 to 2033

Figure 46: North America Market Attractiveness by Application, 2023 to 2033

Figure 47: North America Market Attractiveness by Sales Channels, 2023 to 2033

Figure 48: North America Market Attractiveness by Country, 2023 to 2033

Figure 49: Latin America Market Value (US$ Million) by Product Type, 2023 to 2033

Figure 50: Latin America Market Value (US$ Million) by Application, 2023 to 2033

Figure 51: Latin America Market Value (US$ Million) by Sales Channels, 2023 to 2033

Figure 52: Latin America Market Value (US$ Million) by Country, 2023 to 2033

Figure 53: Latin America Market Value (US$ Million) Analysis by Country, 2018 to 2033

Figure 54: Latin America Market Volume (Units) Analysis by Country, 2018 to 2033

Figure 55: Latin America Market Value Share (%) and BPS Analysis by Country, 2023 to 2033

Figure 56: Latin America Market Y-o-Y Growth (%) Projections by Country, 2023 to 2033

Figure 57: Latin America Market Value (US$ Million) Analysis by Product Type, 2018 to 2033

Figure 58: Latin America Market Volume (Units) Analysis by Product Type, 2018 to 2033

Figure 59: Latin America Market Value Share (%) and BPS Analysis by Product Type, 2023 to 2033

Figure 60: Latin America Market Y-o-Y Growth (%) Projections by Product Type, 2023 to 2033

Figure 61: Latin America Market Value (US$ Million) Analysis by Application, 2018 to 2033

Figure 62: Latin America Market Volume (Units) Analysis by Application, 2018 to 2033

Figure 63: Latin America Market Value Share (%) and BPS Analysis by Application, 2023 to 2033

Figure 64: Latin America Market Y-o-Y Growth (%) Projections by Application, 2023 to 2033

Figure 65: Latin America Market Value (US$ Million) Analysis by Sales Channels, 2018 to 2033

Figure 66: Latin America Market Volume (Units) Analysis by Sales Channels, 2018 to 2033

Figure 67: Latin America Market Value Share (%) and BPS Analysis by Sales Channels, 2023 to 2033

Figure 68: Latin America Market Y-o-Y Growth (%) Projections by Sales Channels, 2023 to 2033

Figure 69: Latin America Market Attractiveness by Product Type, 2023 to 2033

Figure 70: Latin America Market Attractiveness by Application, 2023 to 2033

Figure 71: Latin America Market Attractiveness by Sales Channels, 2023 to 2033

Figure 72: Latin America Market Attractiveness by Country, 2023 to 2033

Figure 73: Western Europe Market Value (US$ Million) by Product Type, 2023 to 2033

Figure 74: Western Europe Market Value (US$ Million) by Application, 2023 to 2033

Figure 75: Western Europe Market Value (US$ Million) by Sales Channels, 2023 to 2033

Figure 76: Western Europe Market Value (US$ Million) by Country, 2023 to 2033

Figure 77: Western Europe Market Value (US$ Million) Analysis by Country, 2018 to 2033

Figure 78: Western Europe Market Volume (Units) Analysis by Country, 2018 to 2033

Figure 79: Western Europe Market Value Share (%) and BPS Analysis by Country, 2023 to 2033

Figure 80: Western Europe Market Y-o-Y Growth (%) Projections by Country, 2023 to 2033

Figure 81: Western Europe Market Value (US$ Million) Analysis by Product Type, 2018 to 2033

Figure 82: Western Europe Market Volume (Units) Analysis by Product Type, 2018 to 2033

Figure 83: Western Europe Market Value Share (%) and BPS Analysis by Product Type, 2023 to 2033

Figure 84: Western Europe Market Y-o-Y Growth (%) Projections by Product Type, 2023 to 2033

Figure 85: Western Europe Market Value (US$ Million) Analysis by Application, 2018 to 2033

Figure 86: Western Europe Market Volume (Units) Analysis by Application, 2018 to 2033

Figure 87: Western Europe Market Value Share (%) and BPS Analysis by Application, 2023 to 2033

Figure 88: Western Europe Market Y-o-Y Growth (%) Projections by Application, 2023 to 2033

Figure 89: Western Europe Market Value (US$ Million) Analysis by Sales Channels, 2018 to 2033

Figure 90: Western Europe Market Volume (Units) Analysis by Sales Channels, 2018 to 2033

Figure 91: Western Europe Market Value Share (%) and BPS Analysis by Sales Channels, 2023 to 2033

Figure 92: Western Europe Market Y-o-Y Growth (%) Projections by Sales Channels, 2023 to 2033

Figure 93: Western Europe Market Attractiveness by Product Type, 2023 to 2033

Figure 94: Western Europe Market Attractiveness by Application, 2023 to 2033

Figure 95: Western Europe Market Attractiveness by Sales Channels, 2023 to 2033

Figure 96: Western Europe Market Attractiveness by Country, 2023 to 2033

Figure 97: Eastern Europe Market Value (US$ Million) by Product Type, 2023 to 2033

Figure 98: Eastern Europe Market Value (US$ Million) by Application, 2023 to 2033

Figure 99: Eastern Europe Market Value (US$ Million) by Sales Channels, 2023 to 2033

Figure 100: Eastern Europe Market Value (US$ Million) by Country, 2023 to 2033

Figure 101: Eastern Europe Market Value (US$ Million) Analysis by Country, 2018 to 2033

Figure 102: Eastern Europe Market Volume (Units) Analysis by Country, 2018 to 2033

Figure 103: Eastern Europe Market Value Share (%) and BPS Analysis by Country, 2023 to 2033

Figure 104: Eastern Europe Market Y-o-Y Growth (%) Projections by Country, 2023 to 2033

Figure 105: Eastern Europe Market Value (US$ Million) Analysis by Product Type, 2018 to 2033

Figure 106: Eastern Europe Market Volume (Units) Analysis by Product Type, 2018 to 2033

Figure 107: Eastern Europe Market Value Share (%) and BPS Analysis by Product Type, 2023 to 2033

Figure 108: Eastern Europe Market Y-o-Y Growth (%) Projections by Product Type, 2023 to 2033

Figure 109: Eastern Europe Market Value (US$ Million) Analysis by Application, 2018 to 2033

Figure 110: Eastern Europe Market Volume (Units) Analysis by Application, 2018 to 2033

Figure 111: Eastern Europe Market Value Share (%) and BPS Analysis by Application, 2023 to 2033

Figure 112: Eastern Europe Market Y-o-Y Growth (%) Projections by Application, 2023 to 2033

Figure 113: Eastern Europe Market Value (US$ Million) Analysis by Sales Channels, 2018 to 2033

Figure 114: Eastern Europe Market Volume (Units) Analysis by Sales Channels, 2018 to 2033

Figure 115: Eastern Europe Market Value Share (%) and BPS Analysis by Sales Channels, 2023 to 2033

Figure 116: Eastern Europe Market Y-o-Y Growth (%) Projections by Sales Channels, 2023 to 2033

Figure 117: Eastern Europe Market Attractiveness by Product Type, 2023 to 2033

Figure 118: Eastern Europe Market Attractiveness by Application, 2023 to 2033

Figure 119: Eastern Europe Market Attractiveness by Sales Channels, 2023 to 2033

Figure 120: Eastern Europe Market Attractiveness by Country, 2023 to 2033

Figure 121: South Asia and Pacific Market Value (US$ Million) by Product Type, 2023 to 2033

Figure 122: South Asia and Pacific Market Value (US$ Million) by Application, 2023 to 2033

Figure 123: South Asia and Pacific Market Value (US$ Million) by Sales Channels, 2023 to 2033

Figure 124: South Asia and Pacific Market Value (US$ Million) by Country, 2023 to 2033

Figure 125: South Asia and Pacific Market Value (US$ Million) Analysis by Country, 2018 to 2033

Figure 126: South Asia and Pacific Market Volume (Units) Analysis by Country, 2018 to 2033

Figure 127: South Asia and Pacific Market Value Share (%) and BPS Analysis by Country, 2023 to 2033

Figure 128: South Asia and Pacific Market Y-o-Y Growth (%) Projections by Country, 2023 to 2033

Figure 129: South Asia and Pacific Market Value (US$ Million) Analysis by Product Type, 2018 to 2033

Figure 130: South Asia and Pacific Market Volume (Units) Analysis by Product Type, 2018 to 2033

Figure 131: South Asia and Pacific Market Value Share (%) and BPS Analysis by Product Type, 2023 to 2033

Figure 132: South Asia and Pacific Market Y-o-Y Growth (%) Projections by Product Type, 2023 to 2033

Figure 133: South Asia and Pacific Market Value (US$ Million) Analysis by Application, 2018 to 2033

Figure 134: South Asia and Pacific Market Volume (Units) Analysis by Application, 2018 to 2033

Figure 135: South Asia and Pacific Market Value Share (%) and BPS Analysis by Application, 2023 to 2033

Figure 136: South Asia and Pacific Market Y-o-Y Growth (%) Projections by Application, 2023 to 2033

Figure 137: South Asia and Pacific Market Value (US$ Million) Analysis by Sales Channels, 2018 to 2033

Figure 138: South Asia and Pacific Market Volume (Units) Analysis by Sales Channels, 2018 to 2033

Figure 139: South Asia and Pacific Market Value Share (%) and BPS Analysis by Sales Channels, 2023 to 2033

Figure 140: South Asia and Pacific Market Y-o-Y Growth (%) Projections by Sales Channels, 2023 to 2033

Figure 141: South Asia and Pacific Market Attractiveness by Product Type, 2023 to 2033

Figure 142: South Asia and Pacific Market Attractiveness by Application, 2023 to 2033

Figure 143: South Asia and Pacific Market Attractiveness by Sales Channels, 2023 to 2033

Figure 144: South Asia and Pacific Market Attractiveness by Country, 2023 to 2033

Figure 145: East Asia Market Value (US$ Million) by Product Type, 2023 to 2033

Figure 146: East Asia Market Value (US$ Million) by Application, 2023 to 2033

Figure 147: East Asia Market Value (US$ Million) by Sales Channels, 2023 to 2033

Figure 148: East Asia Market Value (US$ Million) by Country, 2023 to 2033

Figure 149: East Asia Market Value (US$ Million) Analysis by Country, 2018 to 2033

Figure 150: East Asia Market Volume (Units) Analysis by Country, 2018 to 2033

Figure 151: East Asia Market Value Share (%) and BPS Analysis by Country, 2023 to 2033

Figure 152: East Asia Market Y-o-Y Growth (%) Projections by Country, 2023 to 2033

Figure 153: East Asia Market Value (US$ Million) Analysis by Product Type, 2018 to 2033

Figure 154: East Asia Market Volume (Units) Analysis by Product Type, 2018 to 2033

Figure 155: East Asia Market Value Share (%) and BPS Analysis by Product Type, 2023 to 2033

Figure 156: East Asia Market Y-o-Y Growth (%) Projections by Product Type, 2023 to 2033

Figure 157: East Asia Market Value (US$ Million) Analysis by Application, 2018 to 2033

Figure 158: East Asia Market Volume (Units) Analysis by Application, 2018 to 2033

Figure 159: East Asia Market Value Share (%) and BPS Analysis by Application, 2023 to 2033

Figure 160: East Asia Market Y-o-Y Growth (%) Projections by Application, 2023 to 2033

Figure 161: East Asia Market Value (US$ Million) Analysis by Sales Channels, 2018 to 2033

Figure 162: East Asia Market Volume (Units) Analysis by Sales Channels, 2018 to 2033

Figure 163: East Asia Market Value Share (%) and BPS Analysis by Sales Channels, 2023 to 2033

Figure 164: East Asia Market Y-o-Y Growth (%) Projections by Sales Channels, 2023 to 2033

Figure 165: East Asia Market Attractiveness by Product Type, 2023 to 2033

Figure 166: East Asia Market Attractiveness by Application, 2023 to 2033

Figure 167: East Asia Market Attractiveness by Sales Channels, 2023 to 2033

Figure 168: East Asia Market Attractiveness by Country, 2023 to 2033

Figure 169: Middle East and Africa Market Value (US$ Million) by Product Type, 2023 to 2033

Figure 170: Middle East and Africa Market Value (US$ Million) by Application, 2023 to 2033

Figure 171: Middle East and Africa Market Value (US$ Million) by Sales Channels, 2023 to 2033

Figure 172: Middle East and Africa Market Value (US$ Million) by Country, 2023 to 2033

Figure 173: Middle East and Africa Market Value (US$ Million) Analysis by Country, 2018 to 2033

Figure 174: Middle East and Africa Market Volume (Units) Analysis by Country, 2018 to 2033

Figure 175: Middle East and Africa Market Value Share (%) and BPS Analysis by Country, 2023 to 2033

Figure 176: Middle East and Africa Market Y-o-Y Growth (%) Projections by Country, 2023 to 2033

Figure 177: Middle East and Africa Market Value (US$ Million) Analysis by Product Type, 2018 to 2033

Figure 178: Middle East and Africa Market Volume (Units) Analysis by Product Type, 2018 to 2033

Figure 179: Middle East and Africa Market Value Share (%) and BPS Analysis by Product Type, 2023 to 2033

Figure 180: Middle East and Africa Market Y-o-Y Growth (%) Projections by Product Type, 2023 to 2033

Figure 181: Middle East and Africa Market Value (US$ Million) Analysis by Application, 2018 to 2033

Figure 182: Middle East and Africa Market Volume (Units) Analysis by Application, 2018 to 2033

Figure 183: Middle East and Africa Market Value Share (%) and BPS Analysis by Application, 2023 to 2033

Figure 184: Middle East and Africa Market Y-o-Y Growth (%) Projections by Application, 2023 to 2033

Figure 185: Middle East and Africa Market Value (US$ Million) Analysis by Sales Channels, 2018 to 2033

Figure 186: Middle East and Africa Market Volume (Units) Analysis by Sales Channels, 2018 to 2033

Figure 187: Middle East and Africa Market Value Share (%) and BPS Analysis by Sales Channels, 2023 to 2033

Figure 188: Middle East and Africa Market Y-o-Y Growth (%) Projections by Sales Channels, 2023 to 2033

Figure 189: Middle East and Africa Market Attractiveness by Product Type, 2023 to 2033

Figure 190: Middle East and Africa Market Attractiveness by Application, 2023 to 2033

Figure 191: Middle East and Africa Market Attractiveness by Sales Channels, 2023 to 2033

Figure 192: Middle East and Africa Market Attractiveness by Country, 2023 to 2033

Recommendations

Consumer Product

Floor Lamp Market

Published : November 2023

Consumer Product

Mosquito Lamps Market

Published : October 2022

Explore Consumer Product Insights

View Reports