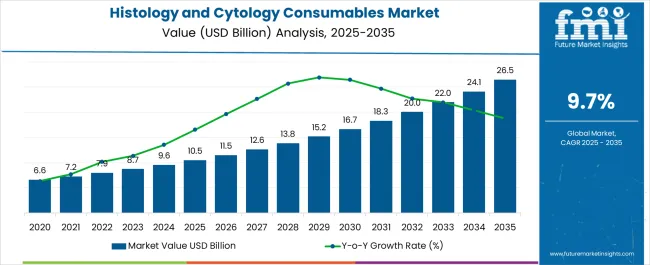
The Histology and Cytology Consumables Market is estimated to be valued at USD 10.5 billion in 2025 and is projected to reach USD 26.5 billion by 2035, registering a compound annual growth rate (CAGR) of 9.7% over the forecast period.
| Metric | Value |
|---|---|
| Histology and Cytology Consumables Market Estimated Value in (2025 E) | USD 10.5 billion |
| Histology and Cytology Consumables Market Forecast Value in (2035 F) | USD 26.5 billion |
| Forecast CAGR (2025 to 2035) | 9.7% |
The histology and cytology consumables market is advancing steadily, driven by the growing need for early disease detection, particularly in oncology and infectious diseases. Rising prevalence of cancer and increasing adoption of precision medicine have significantly raised demand for advanced tissue and cellular analysis. Industry publications and clinical updates have emphasized the importance of consumables in ensuring diagnostic accuracy, reproducibility, and efficiency in pathology workflows.
Additionally, continuous investments in molecular diagnostics and personalized treatment approaches have heightened the role of histology and cytology consumables across research and clinical environments. Technological developments, such as automation in sample preparation and integration of high-throughput diagnostic platforms, have improved laboratory productivity and reduced turnaround times.
Healthcare expenditure growth and national screening programs are also driving higher test volumes in both developed and emerging economies. Looking forward, the market is expected to expand further as digital pathology adoption rises, creating stronger linkages between consumable demand, diagnostic precision, and patient-centric care.
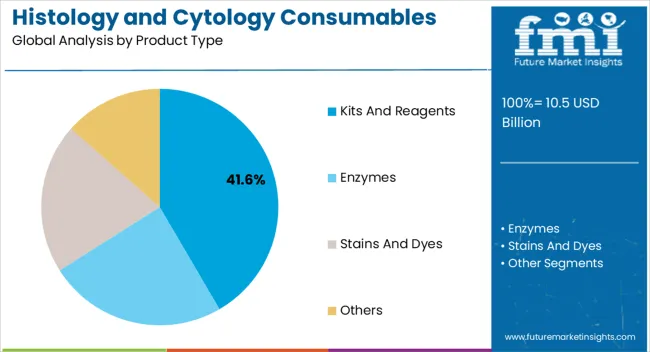
The Kits and Reagents segment is projected to account for 41.6% of the histology and cytology consumables market revenue in 2025, securing its role as the leading product type. Growth in this segment has been driven by the essential nature of reagents in staining, fixation, and sample processing, which are core steps in tissue and cellular diagnostics. Laboratories have relied heavily on these consumables to maintain accuracy, consistency, and reliability in diagnostic results.
Product innovation by diagnostic companies, focusing on ready-to-use and automation-compatible kits, has further supported this segment’s expansion. Additionally, the rising number of diagnostic tests performed globally has created recurring demand for reagents, ensuring steady revenue contribution.
With the growing complexity of molecular and cellular analysis, the demand for advanced reagent formulations tailored to specialized diagnostic workflows is expected to reinforce the dominance of this segment.
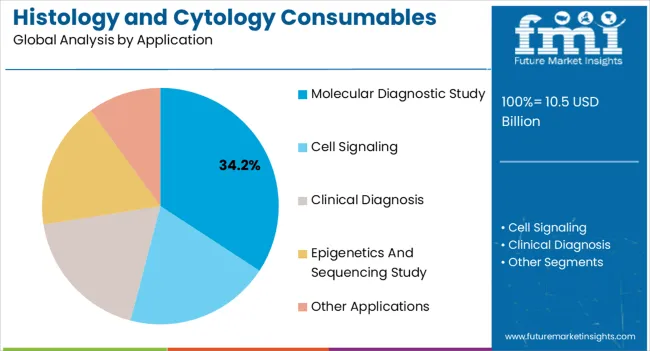
The Molecular Diagnostic Study segment is projected to contribute 34.2% of the histology and cytology consumables market revenue in 2025, maintaining its leading application position. This growth has been supported by the expanding role of molecular diagnostics in detecting genetic mutations, infectious agents, and tumor biomarkers with high sensitivity. Clinical guidelines have increasingly recommended molecular diagnostic testing for early detection and treatment planning, driving the utilization of consumables optimized for nucleic acid extraction and analysis.
Furthermore, integration of histological and cytological methods with molecular assays has strengthened their relevance in precision medicine. Press releases from diagnostic companies and clinical trial updates have also emphasized product innovations in consumables designed for high-throughput molecular workflows.
As molecular diagnostics continues to underpin advancements in oncology and infectious disease management, this segment is expected to sustain its leadership in application areas.
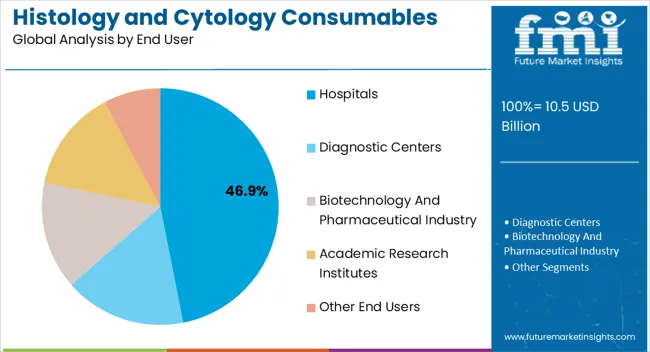
The Hospitals segment is projected to account for 46.9% of the histology and cytology consumables market revenue in 2025, holding its place as the dominant end-user group. Hospitals have remained central to diagnostic service delivery due to their comprehensive pathology departments, advanced laboratory facilities, and high patient volumes. Rising hospital-based cancer screening programs and multidisciplinary diagnostic approaches have increased the need for reliable consumables that can support accurate results and faster turnaround times.
Annual reports and institutional updates have highlighted growing hospital investments in automated diagnostic platforms, which require continuous supply of compatible consumables. Furthermore, hospitals often serve as referral centers for complex diagnostic cases, further raising the demand for kits and reagents.
As hospitals integrate digital pathology and molecular testing into routine workflows, their reliance on high-quality histology and cytology consumables is expected to expand, ensuring their continued leadership in market adoption.
Increased demand for research and development for early disease detection and diagnosis, increased healthcare spending. An increase in hospitals and diagnostic laboratories, and increased demand for personalized medicines necessitates the study of individual cell structure and function, an increase in the prevalence of cell-based diseases such as cancer and autoimmune diseases requires the detection and diagnosis of specific cells and tissue.
Technological advancements in the diagnosis and treatment of infectious illnesses and molecular approaches may drive the need for histology and cytology consumables soon.
Despite continual advances in cytology and histology technology, they have at times been mainly inconclusive, leaving a void in the histology and cytology consumables industry. In biopsies, for example, histology and cytology are used. This factor is anticipated to hamper the worldwide histology and cytology consumables market.
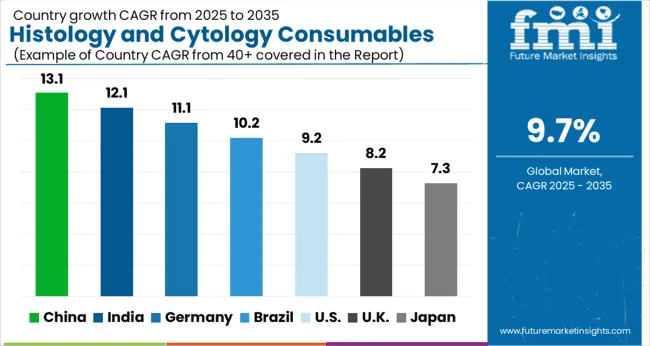
| Countries | Market CAGR % (2025 to 2035) |
|---|---|
| China | 14.5% |
| India | 11.9% |
Prominent economic development has increased healthcare availability in the Asia Pacific region. The increase in multi-specialty clinics and hospitals, as well as the penetration of global players in Asia, is expected to fuel demand for histology and cytology consumables for research and development, as well as advancing the diagnostic and treatment process.
From 2025 to 2035, the Asia Pacific market for histology and cytology is predicted to grow at the quickest pace. The regional market is expanding as a result of numerous factors, including increased cancer awareness, a big target population, and improved healthcare infrastructure. Furthermore, researchers are progressively exploring novel cytology, boosting the region's market expansion.
For example, in February 2024, Japanese researchers compared the effectiveness of liquid-based cytology against traditional cytology in cervical cancer screening. From a practical sense, the study's findings revealed that liquid-based cytology was more beneficial than traditional cytology.
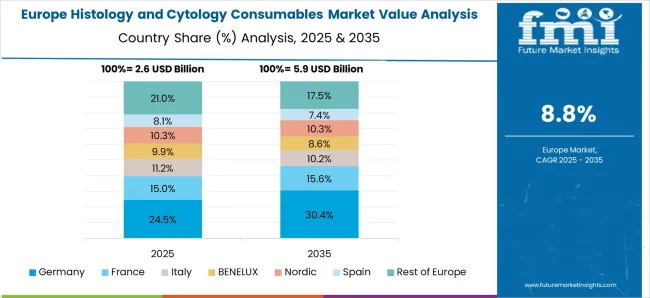
| Region | Europe |
|---|---|
| Market Share % (2025) | 28.1% |
According to Future Market Insights, Europe is expected to hold a more than 28.1% market share in the global histology and cytology consumables market as of 2025. As a result of the inherent character of industrialized healthcare infrastructure, the European markets embrace modern technology at an earlier stage than emerging countries, resulting in a rise in cancer incidence rate, which follows improved diagnostic methods in Europe.
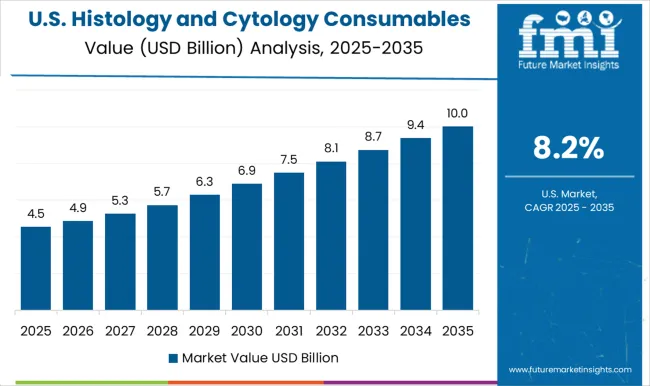
| Region | North America |
|---|---|
| Market Share % (2025) | 40% |
In 2025, North America dominated the market with a revenue share of 40.0%. The high prevalence of cancer, substantial research and development efforts, the existence of important players, and the developed research infrastructure for pathology services all contribute to the regional market's growth. Furthermore, the region's high product approval and commercialization rate add to market expansion.
North America is expected to have a leading share. According to the World Health Organization, by 2035, there are expected to be around 23.6 million additional instances of cancer worldwide, boosting government spending on healthcare in the United States.
| Segment | Kits and Reagents |
|---|---|
| Market Share % (2025) | 55.2% |
In 2025, the kits and reagents category led the market, accounting for 55.2% of total revenue. From 2025 to 2035, the category is likely to retain its lead. Tissue sample containers, kits, stain reagents, fixative solutions, medium reagents, and other reagents are the consumables used in histology and cytology.
The segment's expansion can be traced mostly to the widespread use of histology and cytology consumables. Furthermore, firms are introducing low-cost kits and reagents, propelling the histology and cytology market.
For example, Biocide Medical LLC, in partnership with Ethyl Laboratories, introduced the TIGIT [BLR047F] antibody in August 2024, a novel rabbit monoclonal antibody for the qualitative detection of the TIGIT protein utilizing Immunohistochemistry (IHC). The antibody is expected to provide pharmaceutical and biotech research organizations with a low-cost Immunohistochemistry option.
The histology and cytology consumables landscape is witnessing significant activity regarding start-up ecosystems. Numerous life science companies are making inroads into the market, each bringing promising developments in the histology & cytology field. Some notable start-up players in this domain are as follows:
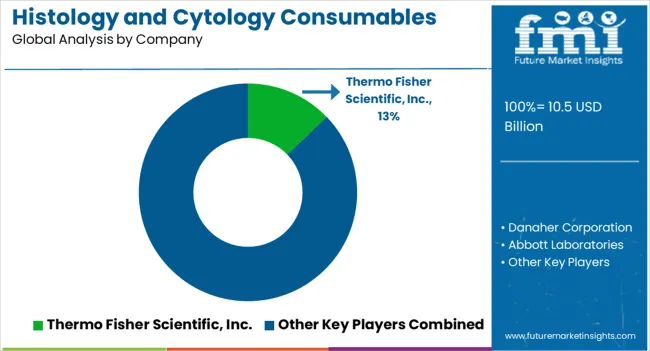
Consumables that enhance the specificity and sensitivity of histological and cytological tests are the goal of companies in the histology and cytology consumables industry.
Some businesses have increased their investments in the release of novel anatomical pathology consumables to suit the most demanding demands of contemporary histology laboratories. Numerous internationally important producers of cytology and histology apparatus and dyes have increased their holdings in the histology and cytology consumables supply industry.
Thermo Fisher Scientific, Inc., Danaher Corporation, Abbott Laboratories, Becton Dickinson and Company, F. Hoffmann-La Roche Ltd, Promega Corporation, Agilent Technologies Inc., Roche Holding AG, Merck KGaA, Allergan, Plc, PerkinElmer, Inc., and others are among the key players in the global histology and cytology consumables industry.
| Report Attribute | Details |
|---|---|
| Growth Rate | CAGR of 9.7% from 2025 to 2035 |
| Market Value in 2025 | USD 10.5 billion |
| Market Value in 2035 | USD 26.5 billion |
| Base Year for Estimation | 2025 |
| Historical Data | 2020 to 2025 |
| Forecast Period | 2025 to 2035 |
| Quantitative Units | Revenue in USD million and CAGR from 2025 to 2035 |
| Report Coverage | Revenue Forecast, Company Ranking, Competitive Landscape, Growth Factors, Trends, and Pricing Analysis |
| Segments Covered |
Product Type, Application, End User, Region |
| Regions Covered |
North America; Latin America; Europe; Asia Pacific; The Middle East and Africa |
| Key Countries Profiled | The United States, Canada, Brazil, Mexico, Germany, The United Kingdom, France, Spain, Italy, China, Japan, South Korea, Malaysia, Singapore, Australia, New Zealand, GCC Countries, South Africa, Israel |
| Key Companies Profiled |
Thermo Fisher Scientific, Inc.; Danaher Corporation; Abbott Laboratories; Becton Dickinson and Company; F. Hoffmann-La Roche Ltd; Promega Corporation; Agilent Technologies Inc.; Roche Holding AG; Merck KGaA; Allergan, Plc.; PerkinElmer, Inc. |
| Customization | Available Upon Request |
The global histology and cytology consumables market is estimated to be valued at USD 10.5 billion in 2025.
The market size for the histology and cytology consumables market is projected to reach USD 26.6 billion by 2035.
The histology and cytology consumables market is expected to grow at a 9.7% CAGR between 2025 and 2035.
The key product types in histology and cytology consumables market are kits and reagents, enzymes, stains and dyes and others.
In terms of application, molecular diagnostic study segment to command 34.2% share in the histology and cytology consumables market in 2025.


Our Research Products

The "Full Research Suite" delivers actionable market intel, deep dives on markets or technologies, so clients act faster, cut risk, and unlock growth.

The Leaderboard benchmarks and ranks top vendors, classifying them as Established Leaders, Leading Challengers, or Disruptors & Challengers.

Locates where complements amplify value and substitutes erode it, forecasting net impact by horizon

We deliver granular, decision-grade intel: market sizing, 5-year forecasts, pricing, adoption, usage, revenue, and operational KPIs—plus competitor tracking, regulation, and value chains—across 60 countries broadly.

Spot the shifts before they hit your P&L. We track inflection points, adoption curves, pricing moves, and ecosystem plays to show where demand is heading, why it is changing, and what to do next across high-growth markets and disruptive tech

Real-time reads of user behavior. We track shifting priorities, perceptions of today’s and next-gen services, and provider experience, then pace how fast tech moves from trial to adoption, blending buyer, consumer, and channel inputs with social signals (#WhySwitch, #UX).

Partner with our analyst team to build a custom report designed around your business priorities. From analysing market trends to assessing competitors or crafting bespoke datasets, we tailor insights to your needs.
Supplier Intelligence
Discovery & Profiling
Capacity & Footprint
Performance & Risk
Compliance & Governance
Commercial Readiness
Who Supplies Whom
Scorecards & Shortlists
Playbooks & Docs
Category Intelligence
Definition & Scope
Demand & Use Cases
Cost Drivers
Market Structure
Supply Chain Map
Trade & Policy
Operating Norms
Deliverables
Buyer Intelligence
Account Basics
Spend & Scope
Procurement Model
Vendor Requirements
Terms & Policies
Entry Strategy
Pain Points & Triggers
Outputs
Pricing Analysis
Benchmarks
Trends
Should-Cost
Indexation
Landed Cost
Commercial Terms
Deliverables
Brand Analysis
Positioning & Value Prop
Share & Presence
Customer Evidence
Go-to-Market
Digital & Reputation
Compliance & Trust
KPIs & Gaps
Outputs
Full Research Suite comprises of:
Market outlook & trends analysis
Interviews & case studies
Strategic recommendations
Vendor profiles & capabilities analysis
5-year forecasts
8 regions and 60+ country-level data splits
Market segment data splits
12 months of continuous data updates
DELIVERED AS:
PDF EXCEL ONLINE
Cytology Brushes Market Insights - Growth & Forecast 2025 to 2035
Cytology Fixatives Market Analysis - Size, Share, and Forecast Outlook 2025 to 2035
GMP Consumables Market Size and Share Forecast Outlook 2025 to 2035
Dental Consumables Market Insights by Product, End-Users, and Region through 2035
Digital Cytology Market Analysis - Size, Share, and Forecast Outlook 2025 to 2035
Welding Consumables Market Growth - Trends & Forecast 2025 to 2035
Brazing Consumables Market
Hospital Consumables Market Analysis - Growth, Demand & Forecast 2025 to 2035
Orthopedic Consumables Market Trends – Industry Growth & Forecast 2024 to 2034
Mass Finishing Consumables Market Size and Share Forecast Outlook 2025 to 2035
Lawn and Garden Consumables Market Size and Share Forecast Outlook 2025 to 2035
Mining Explosives Consumables Market Growth – Trends & Forecast 2025 to 2035
Demand for Welding Consumables in Japan Size and Share Forecast Outlook 2025 to 2035
Demand for Welding Consumables in USA Size and Share Forecast Outlook 2025 to 2035
Retail Printers and Consumables Market Growth - Trends & Forecast 2025 to 2035
Barcode Printers & Consumables Market Growth - Trends & Forecast 2025 to 2035
Welding Equipment And Consumables Market Size and Share Forecast Outlook 2025 to 2035
Chromatography Accessories & Consumables Market Growth – Trends & Forecast 2025 to 2035
Demand for Barcode Printers and Consumables in Japan Size and Share Forecast Outlook 2025 to 2035
Demand for Barcode Printers and Consumables in USA Size and Share Forecast Outlook 2025 to 2035

Thank you!
You will receive an email from our Business Development Manager. Please be sure to check your SPAM/JUNK folder too.
Chat With
MaRIA