

- Market Size (2026)
- USD 416.4 Mn
- Forecast (2036)
- USD 858.2 Mn
- CAGR (2026 to 2036)
- 7.5%
How big is GPU Cluster Electrical Disturbance Analytics Market in 2026?
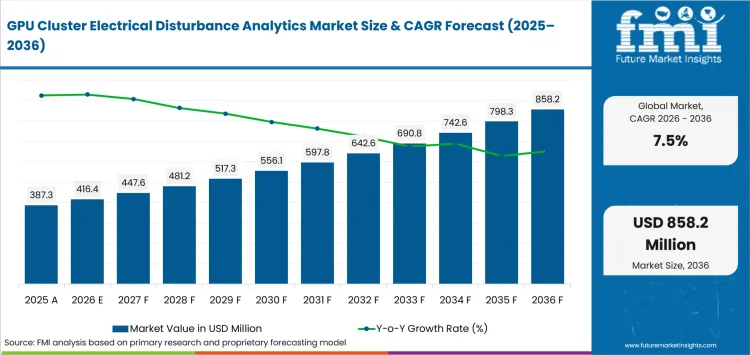
USD 416.4 million in 2026 and USD 858.2 million by 2036 at a 7.5% CAGR.
Demand for GPU cluster electrical disturbance analytics is projected to expand at 7.5% CAGR between 2026 and 2036, increasing valuation from USD 416.4 million in 2026 to USD 858.2 million by 2036. Commercial adoption is tied to the need to detect voltage events, waveform distortion and source-side anomalies before they propagate across high-density compute power paths.
High-density AI infrastructure changes the electrical monitoring problem because rack power is moving into ranges once associated with much larger facility loads. Open Compute Project work in 2025 described rack architectures spanning 250 kW to 1 MW, while its Diablo power specification targets AI racks from 100 kW to 1 MW. At those densities, timestamped disturbance data and repeatable power-quality measurement become operating requirements for troubleshooting rather than periodic engineering checks.
Key Takeaways of GPU Cluster Electrical Disturbance Analytics Market
- Electrical disturbance analytics gains relevance as GPU rack density raises the cost of misclassifying short voltage events, harmonics and source-side faults across shared power paths.
- Event detection & classification is projected at 29.0% share by software function in 2026 because operators need a consistent first layer for separating sags, swells, interruptions and waveform anomalies.
- The 1-10 ms segment is estimated at 32.0% of response-time demand in 2026 as sub-cycle visibility becomes useful for correlating fast electrical events with sensitive compute loads.
- The 250-500 kW segment is forecast at 34.0% by rack / pod load in 2026, with hyperscale AI estimated at 45.0% by facility type and OEM direct projected at 37.0% by sales channel.
- Cross-vendor timestamps, sensor placement and inconsistent event definitions can limit root-cause confidence when measurements are collected at several electrical layers.
- Dranetz Technologies, Inc., ABB Ltd., Siemens AG and Janitza electronics GmbH supply power-quality instruments, recording systems or analytics software relevant to disturbance detection and investigation.
Analyst Perspective
"GPU power systems are becoming dense enough that a disturbance cannot be treated as a generic alarm. Operators need to know what happened, where it originated and whether the same signature is appearing across adjacent racks or upstream equipment. The commercial value of analytics comes from shortening that path from event capture to a defensible root-cause decision."
- Sudip saha, Principal Consultant, Future Market Insights
How is the GPU Cluster Electrical Disturbance Analytics Market segmented?
The GPU cluster electrical disturbance analytics market is segmented by software function, response time, rack / pod load, facility type, sales channel and region.
GPU cluster electrical disturbance analytics is segmented by software function, response time, rack / pod load, facility type, sales channel and region across high-density computing environments. Software function covers event detection & classification, harmonic / waveform analytics, source localization, predictive risk analytics and reporting / compliance. Response time spans 1-10 ms, sub-millisecond, 11-100 ms and above 100 ms. Rack / pod load covers 250-500 kW, below 250 kW, 501-750 kW and above 750 kW. Facility type includes hyperscale AI, colocation, enterprise data centers and HPC / research, while sales channel includes OEM direct, electrical integrator / EPC, power-quality specialist and distributor / service partner.
Why does event detection & classification lead the software function category?
Event detection & classification provides the first analytic step after a waveform or electrical parameter leaves its normal range. IEEE 1159 defines consistent descriptions for conducted electromagnetic phenomena, while IEC 61000-4-30 covers measurement methods for parameters such as voltage dips, swells, interruptions and harmonics. Software that converts those measurements into repeatable event labels gives facility teams a common basis for triage across monitored points.
Why does OEM direct lead the sales channel category?
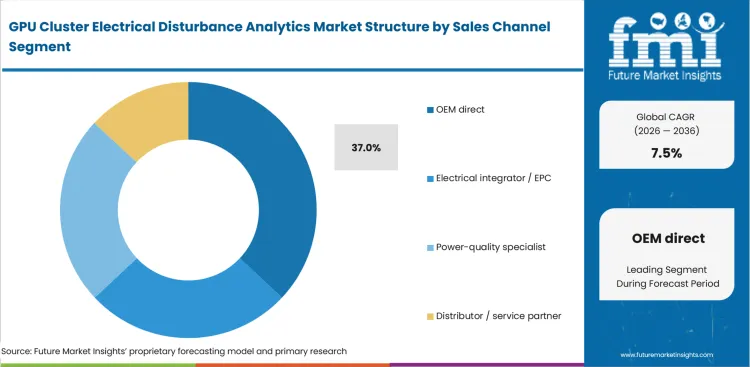
OEM-direct procurement fits projects where power-quality measurement and analytics must be specified alongside switchgear, meters, protection systems or data-center electrical controls. Direct engineering access helps buyers define sampling requirements, communication protocols and event-retention settings before equipment is commissioned.
- OEM direct is projected to account for 37.0% of sales-channel demand in 2026 because disturbance analytics is often tied to the design of the monitored electrical architecture rather than added after an incident.
- ABB markets power-quality monitoring for data centers, Siemens supplies SICAM power-quality recorders, and Janitza integrates measurement devices with GridVis software. Dranetz combines monitoring instruments with disturbance-analysis software, giving direct engineering channels a clear role in configuration and commissioning.
- Based on software function, event detection & classification is projected to account for 29.0% in 2026 because disturbance investigation starts with separating event type before source or consequence can be assessed.
- Repeatable classification also improves comparisons between different meters and sites. IEEE 1159.3 defines a vendor-independent interchange format for power-quality measurements and metadata, supporting the data portability required when analytics platforms aggregate records from several instruments.
Why does 1-10 ms lead the response time category?
A 1-10 ms response window gives analytics systems visibility into events that develop inside a normal 50 Hz or 60 Hz electrical cycle. That range is useful when operators need to connect a fast waveform change with UPS behavior, switching activity or a compute-side load transition without relying only on slower supervisory telemetry.
- In 2026, 1-10 ms is expected to lead the response time category with 32.0% share because fast event capture supports correlation before a short disturbance is averaged into longer reporting intervals.
- IEC 61000-4-30 measurement methods cover rapid voltage changes and transient phenomena alongside steady power-quality parameters. Analytics built around millisecond-scale records can therefore retain the event detail needed for later classification and source investigation.
Why does 250-500 kW lead the rack / pod load category?
Several-hundred-kilowatt AI racks create a monitoring threshold where local electrical behavior can affect a meaningful portion of a data hall. Open Compute Project work in 2025 described next-generation rack architectures supporting 250 kW to 1 MW, and its AI infrastructure standards effort noted that racks are moving beyond 500 kW.
- The 250-500 kW segment is likely to capture 34.0% share in 2026 as operators deploy dense GPU clusters that require finer visibility across branch circuits, power shelves and upstream distribution.
- This load band also sits inside the transition from conventional rack monitoring toward disaggregated high-voltage power architectures. Disturbance analytics can help engineering teams compare events at the rack, sidecar power system and facility distribution layers as those designs scale.
Why does hyperscale AI lead the facility type category?
Hyperscale AI facilities combine concentrated compute demand with large numbers of repeated power-conversion stages. Berkeley Lab reported that USA data-center electricity use rose sharply through 2023 and linked much of the increase in recent years to AI servers. The operating consequence is more electrical equipment and more monitored points supporting compute loads that are costly to interrupt.
- The hyperscale AI segment is forecast to account for 45.0% in 2026 due to large GPU populations and the need to investigate electrical events across repeated rack and pod architectures.
- Centralized disturbance analytics is useful in this setting because one waveform anomaly can appear at several points with different magnitudes and timestamps. Source localization becomes more valuable when operators can compare a repeated electrical signature across a large fleet rather than review meters one by one.
What are the drivers, restraints and opportunities in the GPU Cluster Electrical Disturbance Analytics Market?
Rising AI rack density expands the need for event-level electrical visibility, while cross-vendor measurement gaps can weaken root-cause confidence as standards-aligned analytics creates a route to automated disturbance investigation.
- Driver: High-density GPU racks increase the electrical consequence of short disturbances and raise the value of continuous waveform-level monitoring.
- Restraint: Inconsistent sensor placement, timestamps and event definitions can make source attribution difficult across UPS, switchgear and rack-level power stages.
- Opportunity: Standards-aligned analytics can combine event classification, source localization and compliance reporting within data-center operating workflows.
AI infrastructure is increasing the power handled by each rack and pod. Open Compute Project materials describe rack power envelopes from 250 kW toward 1 MW, which raises the amount of compute exposed to a local electrical event. Operators therefore have a stronger reason to preserve waveform records and connect them with equipment state before a transient condition disappears from normal monitoring views.
Root-cause analysis becomes harder when a facility uses instruments from different vendors or keeps high-resolution data in separate systems. IEEE 1159.3 addresses interchange of power-quality records and related metadata, but practical deployment still depends on clock synchronization, consistent channel naming and sufficient retention at every monitored layer. Gaps in any of these areas can turn a captured event into an inconclusive investigation.
Standards create a usable foundation for software automation. IEC 61000-4-30:2025 specifies repeatable measurement methods, while IEEE 1159 provides a common language for power-quality phenomena. Analytics platforms can use that structure to classify events, compare locations and generate reports that move directly into facility engineering or compliance workflows.
Which country CAGRs are profiled in the GPU Cluster Electrical Disturbance Analytics Market?
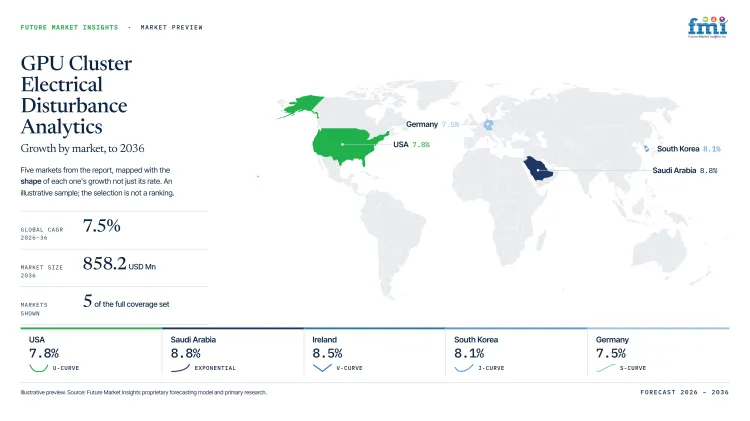
| Country | CAGR |
|---|---|
| UAE | 9.1% |
| Saudi Arabia | 8.8% |
| Ireland | 8.5% |
| South Korea | 8.1% |
| USA | 7.8% |
| Germany | 7.5% |
How do country-level CAGRs compare in the GPU Cluster Electrical Disturbance Analytics Market?
The six country CAGRs span 1.6 percentage points across markets with different data-center buildout patterns and grid-connection conditions. The spacing reflects expected demand for disturbance analytics rather than current installed monitoring capacity or data-center electricity use.
- UAE is anticipated to grow at 9.1% CAGR as new hyperscale capacity and government-backed digital infrastructure increase the number of high-density electrical systems that require continuous operating visibility.
- Saudi Arabia is set to expand at 8.8% CAGR as data-center operating capacity expands and AI infrastructure investment raises requirements for reliable power monitoring inside new facilities.
- Ireland is forecast to grow at 8.5% CAGR in a market where data centers already account for a material share of national electricity demand and new large-energy-user connections face explicit system constraints.
- South Korea is expected to expand at 8.1% CAGR as national AI-computing policy and new AI data-center projects place stable power supply inside infrastructure planning.
- USA is projected to grow at 7.8% CAGR as AI servers push data-center electricity use upward and operators expand high-density power systems across established hyperscale regions.
- Germany is likely to expand at 7.5% CAGR as data centers become more visible among high-consumption network users and facility operators work within an electricity system undergoing continued grid transformation.
Comparable CAGRs can still produce different purchasing conditions. The full report provides country-level CAGR analysis across North America, Latin America, Europe, East Asia, South Asia and Pacific, and the Middle East and Africa.
Country-wise Analysis
- UAE data-center expansion is adding hyperscale infrastructure that places more compute behind concentrated electrical distribution. Dubai Media Office announced an AED 2 billion hyperscale data centre in April 2025 to be developed by du with Microsoft, while DEWA continues to expand green data-center infrastructure in Dubai. The UAE GPU cluster electrical disturbance analytics sector is projected to record 9.1% CAGR during the assessment period as new AI and cloud capacity increases the value of continuous disturbance visibility across high-density facilities.
- Saudi Arabia has expanded its data-center operating base alongside national AI and cloud investment. The Ministry of Communications and Information Technology reported capacity of 440 MW in 2025 and 467 MW in the first quarter of 2026. Saudi Arabia is estimated to post 8.8% CAGR through 2036 as larger facilities create more monitored electrical points and stronger requirements for event classification plus source investigation.
- Ireland combines a concentrated data-center sector with formal grid-connection controls for large energy users. EirGrid reported that data centers and new technology loads represented about 24% of Ireland's electrical energy requirements in 2024, while the government published a Large Energy User Action Plan in January 2026 following an updated connection policy. Ireland is anticipated to advance at 8.5% CAGR as facility operators require detailed power-quality evidence inside a constrained electricity system.
- South Korea is expanding AI-computing infrastructure through national programs and large data-center projects. The Ministry of Science and ICT described a 100 MW-class Ulsan AI Data Center in 2025 and later identified stable power supply as a policy requirement for AI data centers. South Korea is projected to record 8.1% CAGR through 2036 as new GPU infrastructure raises monitoring requirements for fast electrical events and facility-level reliability.
- USA demand is supported by the scale of AI-driven data-center electricity growth and the installed base of hyperscale computing facilities. Berkeley Lab estimated that data centers consumed about 4.4% of USA electricity in 2023 and projected a substantially larger share by the end of the decade under its updated scenarios. USA is estimated to post 7.8% CAGR as operators add high-density GPU systems and seek faster identification of sags, harmonics and equipment-side disturbances.
- Germany is incorporating growing data-center demand into network planning and tariff discussions. Bundesnetzagentur noted in April 2026 that increasing numbers of data centers with very high electricity consumption have been connected to the network. Germany is expected to expand at 7.5% CAGR through 2036 as electrical monitoring becomes more important for facilities operating dense compute loads within a changing grid environment.
Who are the notable companies in the GPU Cluster Electrical Disturbance Analytics Market?
Dranetz Technologies, Inc., ABB Ltd., Siemens AG and Janitza electronics GmbH are the notable companies serving the GPU cluster electrical disturbance analytics market.
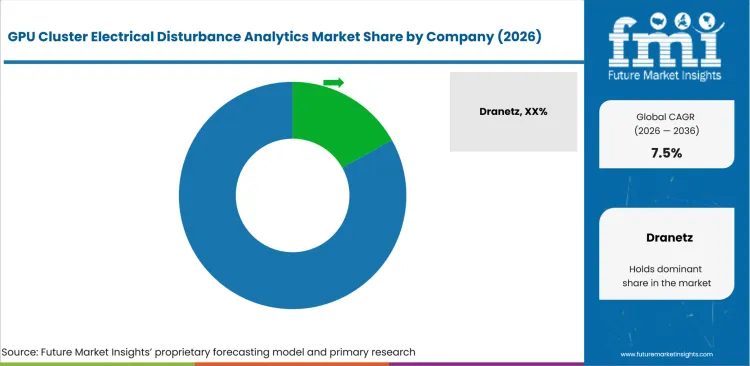
Competition centers on the ability to capture disturbances with sufficient electrical detail and then convert those records into usable engineering evidence. Instrument vendors compete through measurement accuracy and event capture, while software layers compete through classification, visualization and root-cause workflows that can be used across many monitored points.
- Dranetz Technologies, Inc. combines power-quality monitoring instruments with PQView and Dran-View analysis software for disturbance review and large measurement archives.
- ABB Ltd. and Siemens AG embed power-quality measurement into broader electrical distribution portfolios used in data centers and other critical facilities.
- Janitza electronics GmbH connects network analyzers and power-quality instruments with GridVis software for alarms, event review and standards-oriented reporting.
Competitive Benchmarking: GPU Cluster Electrical Disturbance Analytics Market
| Company | Event and waveform analytics | Power-quality measurement | Data-center / critical-load integration | Geographic Reach |
|---|---|---|---|---|
| Dranetz Technologies, Inc. | High | High | Medium | North America and international markets |
| ABB Ltd. | Medium | High | High | Global |
| Siemens AG | High | High | High | Global |
| Janitza electronics GmbH | High | High | Medium | Europe and international markets |
Key Developments in the GPU Cluster Electrical Disturbance Analytics Market
- In June 2026, ABB described work with Hanley Energy on higher-accuracy power monitoring for data-center electrical infrastructure.
- In December 2025, Siemens published SICAM Q200 product information and device documentation for its multifunctional Class A power-quality recorder.
- In May 2025, Janitza released GridVis 9.2 with updates to its power-grid monitoring and device-management software.
Key Players in the GPU Cluster Electrical Disturbance Analytics Market
Power-Quality Monitoring and Disturbance Analytics
- Dranetz Technologies, Inc.
- Janitza electronics GmbH
Electrical Distribution and Power-Quality Platforms
- ABB Ltd.
- Siemens AG
GPU Cluster Electrical Disturbance Analytics Market - Report Scope
| Coverage field | Report scope |
|---|---|
| Market breakdown | By software function, response time, rack / pod load, facility type, sales channel and region. |
| Quantitative Units | Revenue in USD million and CAGR in %. |
| Market Definition | Software, monitoring platforms, embedded analytics and associated systems used to detect, classify, localize, predict and report electrical disturbances affecting GPU clusters and high-density AI data-center power paths. |
| Regions Covered | North America, Latin America, Europe, East Asia, South Asia and Pacific, and Middle East and Africa. |
| Countries Covered | UAE, Saudi Arabia, Ireland, South Korea, USA, Germany, and 20+ countries included in the full report. |
| Key Companies Profiled | Dranetz Technologies, Inc., ABB Ltd., Siemens AG and Janitza electronics GmbH. |
| Forecast Period | 2026 to 2036. |
| Approach | Primary and secondary research with market triangulation. |
GPU Cluster Electrical Disturbance Analytics Market - Research Methodology
| Method | Approach |
|---|---|
| Primary Research | FMI analysts gathered input from manufacturers, service providers, technology developers, distributors, end users, procurement teams, and subject-matter experts. Interviews examined purchasing decisions, product or service evaluation, adoption barriers, approval requirements, pricing considerations, and expectations for technical or commercial support. Respondents were also asked what evidence is required before a trial, pilot, or initial order develops into regular purchasing. |
| Desk Research | Desk research covered government statistics, regulatory publications, trade data, industry associations, technical literature, standards, company filings, product information, and official corporate announcements. Sources were reviewed for relevance, publication date, geographic coverage, and consistency with the defined market scope. Claims relating to performance, applications, approvals, capacity, investment, and commercial activity were retained only when supported by credible public evidence. |
| Market Sizing and Forecasting | The market model combined the baseline value with historical performance, segment structure, pricing and volume indicators, adoption levels, company participation, and country-level demand conditions. Forecast assumptions considered economic activity, investment trends, regulatory developments, technology adoption, purchasing cycles, supply availability, and barriers to wider market use. Segment and regional estimates were reconciled before the final market total was calculated. |
| Data Validation | Estimates were checked against multiple independent indicators, including public data, company activity, trade patterns, industry developments, and findings from primary interviews. Validation also tested whether products, services, applications, and company revenues fell within the defined market boundaries. Adjacent categories, unsupported claims, overlapping revenues, and activities without direct market relevance were excluded to reduce double counting and maintain consistency across segments and countries. |
GPU Cluster Electrical Disturbance Analytics Market by Segments
GPU Cluster Electrical Disturbance Analytics Market segmented by Software Function:
- Event detection & classification
- Harmonic / waveform analytics
- Source localization
- Predictive risk analytics
- Reporting / compliance
GPU Cluster Electrical Disturbance Analytics Market segmented by Response Time:
- 1-10 ms
- Sub-millisecond
- 11-100 ms
- Above 100 ms
GPU Cluster Electrical Disturbance Analytics Market segmented by Rack / Pod Load:
- 250-500 kW
- Below 250 kW
- 501-750 kW
- Above 750 kW
GPU Cluster Electrical Disturbance Analytics Market segmented by Facility Type:
- Hyperscale AI
- Colocation
- Enterprise data centers
- HPC / research
GPU Cluster Electrical Disturbance Analytics Market segmented by Sales Channel:
- OEM direct
- Electrical integrator / EPC
- Power-quality specialist
- Distributor / service partner
GPU Cluster Electrical Disturbance Analytics Market by Region:
- North America
- United States
- Canada
- Latin America
- Brazil
- Chile
- Mexico
- Rest of Latin America
- Western Europe
- Germany
- United Kingdom
- Italy
- Spain
- France
- Nordics
- Benelux
- Rest of Western Europe
- Eastern Europe
- Russia
- Poland
- Hungary
- Balkan and Baltic States
- Rest of Eastern Europe
- East Asia
- China
- Japan
- South Korea
- South Asia and Pacific
- India
- ASEAN
- Australia and New Zealand
- Rest of South Asia and Pacific
- Middle East and Africa
- Kingdom of Saudi Arabia
- Other GCC Countries
- Türkiye
- South Africa
- Other African Union Countries
- Rest of Middle East and Africa
Research Sources and Bibliography
- Lawrence Berkeley National Laboratory. (2026). United States Data Center Energy Usage Report: 2025 Update.
- Lawrence Berkeley National Laboratory. (2024). 2024 United States Data Center Energy Usage Report.
- Open Compute Project. (2025, April 29). The Open Compute Project: Accelerating Deployment of Next-Gen AI Clusters.
- Open Compute Project. (2025). A Call for Collaboration on AI Data Center Infrastructure Standards.
- Open Compute Project. (2026, March 1). Diablo 400 Project: Rack and Power.
- International Electrotechnical Commission. (2025, October 24). IEC 61000-4-30:2025, Power Quality Measurement Methods.
- IEEE Standards Association. (2019). IEEE 1159-2019, Recommended Practice for Monitoring Electric Power Quality.
- IEEE Standards Association. (2022). IEEE 519-2022, Standard for Harmonic Control in Electric Power Systems.
- IEEE Standards Association. (2025). IEEE 1159.3-2025, Power Quality Data Interchange Format.
- EirGrid. (2025, June 18; November 17). Large Energy User Market Intelligence Exercise; MPID345 Grid Code Modification Proposal Form.
- Government of Ireland. (2026, January 13). Large Energy User Action Plan.
- Bundesnetzagentur. (2026, April 22). Industrial Network Tariffs: Points of Orientation.
- Ministry of Science and ICT, Republic of Korea. (2025-2026). Ulsan AI Data Center launch and AI data-center policy updates.
- Ministry of Communications and Information Technology, Saudi Arabia. (2026). Data Center Capacity and AI Infrastructure Updates.
- Dubai Media Office. (2025, April 22). AED 2 Billion Hyperscale Data Centre Announcement.
- Dubai Electricity and Water Authority. (2025, January 22). Second Phase of Moro Hub Green Data Centre.
- Dranetz Technologies, Inc. (2026). PQView and Power Quality Monitoring Solutions.
- ABB Ltd. (2026, June 10). Hanley Energy Data Center Infrastructure at AI Speed with ABB.
- Siemens AG. (2025, December 29). SICAM Q200 Product Information and Device Manual.
- Janitza electronics GmbH. (2025, May 8). GridVis 9.2 Software Update.
This bibliography is provided for reader reference and is not exhaustive. The full report contains the complete reference list and detailed citations
This Report Answers
- How large is the GPU Cluster Electrical Disturbance Analytics Market in 2026 and 2036?
- Which electrical operating conditions support demand for disturbance analytics in dense GPU clusters?
- Which software function is used first during power-quality event investigation?
- How does response time shape disturbance capture across high-density power systems?
- Which rack and pod load ranges are creating new monitoring requirements?
- Which facility settings require broad event correlation across repeated GPU power paths?
- How do country growth rates affect commercial entry conditions?
- Which companies supply power-quality monitoring and disturbance-analysis platforms?
Frequently Asked Questions
How big is the GPU Cluster Electrical Disturbance Analytics Market in 2026?
USD 416.4 million represents the GPU cluster electrical disturbance analytics market value in 2026 across software and monitoring systems used for high-density compute power paths. Demand is tied to the need to preserve event-level evidence when short electrical disturbances affect concentrated GPU loads.
What is the CAGR of the GPU Cluster Electrical Disturbance Analytics Market from 2026 to 2036?
A 7.5% CAGR is projected for the GPU cluster electrical disturbance analytics market between 2026 and 2036. Higher AI rack density supports demand, while measurement consistency and cross-vendor integration determine whether captured events can be turned into reliable root-cause findings.
Which software function segment is projected to account for 29.0% of the GPU Cluster Electrical Disturbance Analytics Market?
Event detection & classification is projected to account for 29.0% of software-function demand in 2026. The function gives operators the first structured view of voltage events and waveform anomalies before deeper source localization or predictive analysis begins.
How much will the GPU Cluster Electrical Disturbance Analytics Market add between 2026 and 2036?
USD 441.8 million is expected to be added to the GPU cluster electrical disturbance analytics market between 2026 and 2036. The increase is supported by denser AI rack architectures and broader use of continuous power-quality monitoring inside hyperscale and other critical computing facilities.
Which companies are active in the GPU Cluster Electrical Disturbance Analytics Market?
Four companies active in the GPU cluster electrical disturbance analytics market include Dranetz Technologies, Inc., ABB Ltd., Siemens AG and Janitza electronics GmbH. The group covers dedicated power-quality instruments, disturbance-analysis software and electrical monitoring platforms used across critical power systems.
Preview the report firsthand - request a free sample
Get SampleGet the brochure for pricing and purchase details.
Get PDFTable of Content
- Key Takeaways
- Market Size and CAGR
- Top Growth Driver
- Fastest Growing Segment
- Leading Region
- Key Companies
- Emerging Opportunities
- Executive Summary
- Global Market Outlook
- Demand-side Trends
- Supply-side Trends
- Technology Roadmap Analysis
- Analysis and Recommendations
- Analyst Perspective (What is happening? Why now? What should investors know?)
- Key Questions Answered
- How large is the market?
- What is the CAGR?
- What are key trends?
- Which region dominates?
- Who are the leaders?
- Market Overview
- Market Coverage / Taxonomy
- Market Definition / Scope / Limitations
- Research Methodology
- Chapter Orientation
- Analytical Lens and Working Hypotheses
- Market Structure, Signals, and Trend Drivers
- Benchmarking and Cross-market Comparability
- Market Sizing, Forecasting, and Opportunity Mapping
- Research Design and Evidence Framework
- Desk Research Programme (Secondary Evidence)
- Expert Input and Fieldwork (Primary Evidence)
- Tooling, Models, and Reference Databases
- Data Engineering and Model Build
- Quality Assurance and Audit Trail
- Market Background
- Market Dynamics (Drivers, Restraints, Opportunity, Trends)
- Scenario Forecast (Optimistic, Likely, Conservative)
- Impact Analysis
- AI Impact
- Sustainability Impact
- Regulatory Impact
- Technology Impact
- Consumer / Buyer Analysis
- Purchase Drivers
- Adoption Barriers
- Buyer Journey
- Opportunity Map Analysis
- Product Life Cycle Analysis
- Supply Chain Analysis
- Investment Feasibility Matrix
- Value Chain Analysis
- PESTLE and Porter's Analysis
- Regulatory Landscape
- Regional Parent Market Outlook
- Production and Consumption Statistics
- Import and Export Statistics
- Global Market Analysis and Forecast, 2021 to 2036
- Historical Market Size Value (USD Million) Analysis, 2021 to 2025
- Current and Future Market Size Value (USD Million) Projections, 2026 to 2036
- Y-o-Y Growth Trend Analysis
- Absolute $ Opportunity Analysis
- Global Market Pricing Analysis, 2021 to 2036
- Global Market Analysis and Forecast, By Software Function, 2021 to 2036
- Introduction / Key Findings
- Historical Market Size Value (USD Million) Analysis By Software Function, 2021 to 2025
- Current and Future Market Size Value (USD Million) Analysis and Forecast By Software Function, 2026 to 2036
- Event detection & classification
- Harmonic / waveform analytics
- Source localization
- Predictive risk analytics
- Reporting / compliance
- Event detection & classification
- Y-o-Y Growth Trend Analysis By Software Function, 2021 to 2025
- Absolute $ Opportunity Analysis By Software Function, 2026 to 2036
- Global Market Analysis and Forecast, By Response Time, 2021 to 2036
- Introduction / Key Findings
- Historical Market Size Value (USD Million) Analysis By Response Time, 2021 to 2025
- Current and Future Market Size Value (USD Million) Analysis and Forecast By Response Time, 2026 to 2036
- 1-10 ms
- Sub-millisecond
- 11-100 ms
- Above 100 ms
- 1-10 ms
- Y-o-Y Growth Trend Analysis By Response Time, 2021 to 2025
- Absolute $ Opportunity Analysis By Response Time, 2026 to 2036
- Global Market Analysis and Forecast, By Rack / Pod Load, 2021 to 2036
- Introduction / Key Findings
- Historical Market Size Value (USD Million) Analysis By Rack / Pod Load, 2021 to 2025
- Current and Future Market Size Value (USD Million) Analysis and Forecast By Rack / Pod Load, 2026 to 2036
- 250-500 kW
- Below 250 kW
- 501-750 kW
- Above 750 kW
- 250-500 kW
- Y-o-Y Growth Trend Analysis By Rack / Pod Load, 2021 to 2025
- Absolute $ Opportunity Analysis By Rack / Pod Load, 2026 to 2036
- Global Market Analysis and Forecast, By Facility Type, 2021 to 2036
- Introduction / Key Findings
- Historical Market Size Value (USD Million) Analysis By Facility Type, 2021 to 2025
- Current and Future Market Size Value (USD Million) Analysis and Forecast By Facility Type, 2026 to 2036
- Hyperscale AI
- Colocation
- Enterprise data centers
- HPC / research
- Hyperscale AI
- Y-o-Y Growth Trend Analysis By Facility Type, 2021 to 2025
- Absolute $ Opportunity Analysis By Facility Type, 2026 to 2036
- Global Market Analysis and Forecast, By Sales Channel, 2021 to 2036
- Introduction / Key Findings
- Historical Market Size Value (USD Million) Analysis By Sales Channel, 2021 to 2025
- Current and Future Market Size Value (USD Million) Analysis and Forecast By Sales Channel, 2026 to 2036
- OEM direct
- Electrical integrator / EPC
- Power-quality specialist
- Distributor / service partner
- OEM direct
- Y-o-Y Growth Trend Analysis By Sales Channel, 2021 to 2025
- Absolute $ Opportunity Analysis By Sales Channel, 2026 to 2036
- Global Market Analysis and Forecast, By Region, 2021 to 2036
- Introduction
- Historical Market Size Value (USD Million) Analysis By Region, 2021 to 2025
- Current Market Size Value (USD Million) Analysis and Forecast By Region, 2026 to 2036
- North America
- Latin America
- Western Europe
- Eastern Europe
- East Asia
- South Asia and Pacific
- Middle East & Africa
- Market Attractiveness Analysis By Region
- North America Market Analysis and Forecast, By Country, 2021 to 2036
- Historical Market Size Value (USD Million) Trend Analysis By Market Taxonomy, 2021 to 2025
- Market Size Value (USD Million) Forecast By Market Taxonomy, 2026 to 2036
- By Country
- USA
- Canada
- By Software Function
- By Response Time
- By Rack / Pod Load
- By Facility Type
- By Sales Channel
- By Country
- Market Attractiveness Analysis
- By Country
- By Software Function
- By Response Time
- By Rack / Pod Load
- By Facility Type
- By Sales Channel
- Key Takeaways
- Latin America Market Analysis and Forecast, By Country
- Historical Market Size Value (USD Million) Trend Analysis By Market Taxonomy, 2021 to 2025
- Market Size Value (USD Million) Forecast By Market Taxonomy, 2026 to 2036
- By Country
- Brazil
- Mexico
- Chile
- Rest of Latin America
- By Software Function
- By Response Time
- By Rack / Pod Load
- By Facility Type
- By Sales Channel
- By Country
- Market Attractiveness Analysis
- By Country
- By Software Function
- By Response Time
- By Rack / Pod Load
- By Facility Type
- By Sales Channel
- Key Takeaways
- Western Europe Market Analysis and Forecast, By Country
- Historical Market Size Value (USD Million) Trend Analysis By Market Taxonomy, 2021 to 2025
- Market Size Value (USD Million) Forecast By Market Taxonomy, 2026 to 2036
- By Country
- Germany
- UK
- Italy
- Spain
- France
- Nordic
- BENELUX
- Rest of Western Europe
- By Software Function
- By Response Time
- By Rack / Pod Load
- By Facility Type
- By Sales Channel
- By Country
- Market Attractiveness Analysis
- By Country
- By Software Function
- By Response Time
- By Rack / Pod Load
- By Facility Type
- By Sales Channel
- Key Takeaways
- Eastern Europe Market Analysis and Forecast, By Country
- Historical Market Size Value (USD Million) Trend Analysis By Market Taxonomy, 2021 to 2025
- Market Size Value (USD Million) Forecast By Market Taxonomy, 2026 to 2036
- By Country
- Russia
- Poland
- Hungary
- Balkan & Baltic
- Rest of Eastern Europe
- By Software Function
- By Response Time
- By Rack / Pod Load
- By Facility Type
- By Sales Channel
- By Country
- Market Attractiveness Analysis
- By Country
- By Software Function
- By Response Time
- By Rack / Pod Load
- By Facility Type
- By Sales Channel
- Key Takeaways
- East Asia Market Analysis and Forecast, By Country
- Historical Market Size Value (USD Million) Trend Analysis By Market Taxonomy, 2021 to 2025
- Market Size Value (USD Million) Forecast By Market Taxonomy, 2026 to 2036
- By Country
- China
- Japan
- South Korea
- By Software Function
- By Response Time
- By Rack / Pod Load
- By Facility Type
- By Sales Channel
- By Country
- Market Attractiveness Analysis
- By Country
- By Software Function
- By Response Time
- By Rack / Pod Load
- By Facility Type
- By Sales Channel
- Key Takeaways
- South Asia and Pacific Market Analysis and Forecast, By Country
- Historical Market Size Value (USD Million) Trend Analysis By Market Taxonomy, 2021 to 2025
- Market Size Value (USD Million) Forecast By Market Taxonomy, 2026 to 2036
- By Country
- India
- ASEAN
- Australia & New Zealand
- Rest of South Asia and Pacific
- By Software Function
- By Response Time
- By Rack / Pod Load
- By Facility Type
- By Sales Channel
- By Country
- Market Attractiveness Analysis
- By Country
- By Software Function
- By Response Time
- By Rack / Pod Load
- By Facility Type
- By Sales Channel
- Key Takeaways
- Middle East & Africa Market Analysis and Forecast, By Country
- Historical Market Size Value (USD Million) Trend Analysis By Market Taxonomy, 2021 to 2025
- Market Size Value (USD Million) Forecast By Market Taxonomy, 2026 to 2036
- By Country
- Kingdom of Saudi Arabia
- Other GCC Countries
- Türkiye
- South Africa
- Other African Union
- Rest of Middle East & Africa
- By Software Function
- By Response Time
- By Rack / Pod Load
- By Facility Type
- By Sales Channel
- By Country
- Market Attractiveness Analysis
- By Country
- By Software Function
- By Response Time
- By Rack / Pod Load
- By Facility Type
- By Sales Channel
- Key Takeaways
- Key Countries Market Analysis
- USA
- Pricing Analysis
- Market Share Analysis, 2025
- By Software Function
- By Response Time
- By Rack / Pod Load
- By Facility Type
- By Sales Channel
- Canada
- Pricing Analysis
- Market Share Analysis, 2025
- By Software Function
- By Response Time
- By Rack / Pod Load
- By Facility Type
- By Sales Channel
- Mexico
- Pricing Analysis
- Market Share Analysis, 2025
- By Software Function
- By Response Time
- By Rack / Pod Load
- By Facility Type
- By Sales Channel
- Brazil
- Pricing Analysis
- Market Share Analysis, 2025
- By Software Function
- By Response Time
- By Rack / Pod Load
- By Facility Type
- By Sales Channel
- Chile
- Pricing Analysis
- Market Share Analysis, 2025
- By Software Function
- By Response Time
- By Rack / Pod Load
- By Facility Type
- By Sales Channel
- Germany
- Pricing Analysis
- Market Share Analysis, 2025
- By Software Function
- By Response Time
- By Rack / Pod Load
- By Facility Type
- By Sales Channel
- UK
- Pricing Analysis
- Market Share Analysis, 2025
- By Software Function
- By Response Time
- By Rack / Pod Load
- By Facility Type
- By Sales Channel
- Italy
- Pricing Analysis
- Market Share Analysis, 2025
- By Software Function
- By Response Time
- By Rack / Pod Load
- By Facility Type
- By Sales Channel
- Spain
- Pricing Analysis
- Market Share Analysis, 2025
- By Software Function
- By Response Time
- By Rack / Pod Load
- By Facility Type
- By Sales Channel
- France
- Pricing Analysis
- Market Share Analysis, 2025
- By Software Function
- By Response Time
- By Rack / Pod Load
- By Facility Type
- By Sales Channel
- India
- Pricing Analysis
- Market Share Analysis, 2025
- By Software Function
- By Response Time
- By Rack / Pod Load
- By Facility Type
- By Sales Channel
- ASEAN
- Pricing Analysis
- Market Share Analysis, 2025
- By Software Function
- By Response Time
- By Rack / Pod Load
- By Facility Type
- By Sales Channel
- Australia & New Zealand
- Pricing Analysis
- Market Share Analysis, 2025
- By Software Function
- By Response Time
- By Rack / Pod Load
- By Facility Type
- By Sales Channel
- China
- Pricing Analysis
- Market Share Analysis, 2025
- By Software Function
- By Response Time
- By Rack / Pod Load
- By Facility Type
- By Sales Channel
- Japan
- Pricing Analysis
- Market Share Analysis, 2025
- By Software Function
- By Response Time
- By Rack / Pod Load
- By Facility Type
- By Sales Channel
- South Korea
- Pricing Analysis
- Market Share Analysis, 2025
- By Software Function
- By Response Time
- By Rack / Pod Load
- By Facility Type
- By Sales Channel
- Russia
- Pricing Analysis
- Market Share Analysis, 2025
- By Software Function
- By Response Time
- By Rack / Pod Load
- By Facility Type
- By Sales Channel
- Poland
- Pricing Analysis
- Market Share Analysis, 2025
- By Software Function
- By Response Time
- By Rack / Pod Load
- By Facility Type
- By Sales Channel
- Hungary
- Pricing Analysis
- Market Share Analysis, 2025
- By Software Function
- By Response Time
- By Rack / Pod Load
- By Facility Type
- By Sales Channel
- Kingdom of Saudi Arabia
- Pricing Analysis
- Market Share Analysis, 2025
- By Software Function
- By Response Time
- By Rack / Pod Load
- By Facility Type
- By Sales Channel
- Türkiye
- Pricing Analysis
- Market Share Analysis, 2025
- By Software Function
- By Response Time
- By Rack / Pod Load
- By Facility Type
- By Sales Channel
- South Africa
- Pricing Analysis
- Market Share Analysis, 2025
- By Software Function
- By Response Time
- By Rack / Pod Load
- By Facility Type
- By Sales Channel
- USA
- Market Structure Analysis
- Competition Dashboard
- Competition Benchmarking
- Market Share Analysis of Top Players
- By Regional
- By Software Function
- By Response Time
- By Rack / Pod Load
- By Facility Type
- By Sales Channel
- Emerging Startups
- Innovation Benchmarking
- Competition Analysis
- Competition Deep Dive
- Dranetz
- Overview
- Product Portfolio
- Profitability by Market Segments
- Sales Footprint
- Strategy Overview
- Marketing Strategy
- Product Strategy
- Channel Strategy
- ABB
- Siemens
- Janitza
- Dranetz
- Case Studies
- Success Stories
- Recent Developments
- Competition Deep Dive
- Assumptions & Acronyms Used


