Reports

- Global Locations -

Headquarters

Future Market Insights, Inc.

Christiana Corporate, 200
Continental Drive, Suite 401,
Newark, Delaware - 19713,
United States

T: +1-845-579-5705

Americas

Future Market Insights, Inc.

616 Corporate Way, Suite 2-9018,
Valley Cottage, NY 10989, United States

T: +1-347-918-3531

MEA

Future Market Insights

1602-6 Jumeirah Bay X2 Tower, Plot No: JLT-PH2-X2A,
Jumeirah Lakes Towers, Dubai,
United Arab Emirates

Europe

Future Market Insights

3rd Floor, 207 Regent Street,
W1B 3HH London
United Kingdom

T: + 44 (0) 20 8123 9659
D: +44 (0) 20 3287 4268

Asia Pacific

Future Market Insights

IndiaLand Global Tech Park, Unit UG-1, Behind Grand HighStreet, Phase 1, Hinjawadi, MH, Pune – 411057, India

GPU as a Service Market Snapshot (2023 to 2033)

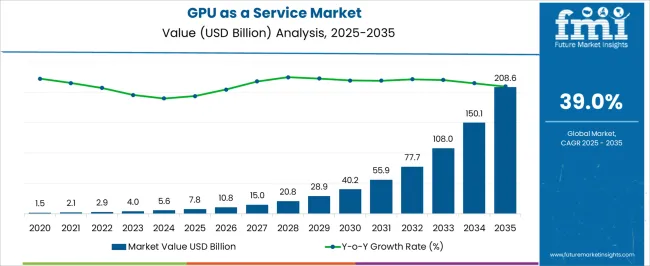
The global GPU as a Service market size is expected to be valued at US$ 3,911.4 million in 2023. With the increase in the number of applications, coupled with increasing demand for IIoT, the overall demand for GPU as a Service is projected to grow at a CAGR of 40.8% between 2023 and 2033, totaling around US$ 119,643.4 million by 2032.

Data Points Key Statistics
GPU as a Service Market Value 2023 US$ 3,911.4 million
GPU as a Service Market Projected Value (2033) US$ 119,643.4 million
GPU as a Service Industry CAGR (2023 to 2033) 40.8%

GPU as a service assists in providing better images, such as seamless motion, optical effects, and intricate shapes at a robust pace.

An increase in the need for multi-GPU servers and GPU server clusters with network interconnects is one of the major factors that is expected to escalate the growth of the GPU as a Service industry over the analysis period. On the contrary, the lack of knowledge among the employees of industries and the complex behavior of the GPU as a Service is expected to hinder the growth of the GPU as a Service industry during the forecast period.

Don't pay for what you don't need

Customize your report by selecting specific countries or regions and save 30%!

Which Drivers Underpin GPU as a Service Industry Expansion?

Increase in Number of Applications to Propel the Market Growth

The increasing popularity of GPU high-performance computing, self-driven cars, and other high-end AI applications is one of the major factors expected to accelerate the GPU as a Service industry growth during the forecast period. With the rising uptake of cloud computing, GPUs are being deployed with server CPUs to accelerate applications and improve performance. Customization and operational characteristics of the GPUaaS have created growth opportunities.

GPUaaS applications benefit from scaling to multi-GPU servers and then to GPU server clusters with network interconnects, thus augmenting the market statistics. In addition, a growing number of use cases on hardware, which include deep learning, speech recognition, natural language processing, data mining, and real-time information, are expected to fuel the market growth in the forthcoming years.

The increase in the number of applications and use cases on hardware, which includes deep learning, speech recognition, natural language processing, data mining, and real-time information, majorly drive the growth of the GPU as a Service industry. In addition, the adoption of integrated GPU used in desktops, workstations, and notebooks, attributed to the growing need for enhanced visual content by consumers, is anticipated to provide major opportunities for GPU as a Service industry growth.

Increasing Demand for IIoT to Drive the Market Growth

The growing acceptance of the Industrial Internet of Things (IIoT) in different sectors, such as manufacturing, automotive, consumer goods and others, is proliferating the trends of the GPUaaS industry and is expected to accelerate the growth of the GPU as a service industry over the analysis period.

The increasing demand for cloud-based applications, such as graphic designing, image processing, and 3D visualization, among others, is another factor expected to augment the growth of the GPU as a service during the forecast period. Industry participants offer assistance with the help of SaaS, PaaS & IaaS models for designing and developing advanced & innovative products. Additionally, supportive government initiatives for smart city development and accelerating digitalization across nations are providing significant growth opportunities for market growth.

Which Factors Are Limiting the Growth of GPU as a Service Market?

High Incurrence of Cost and Lack of Awareness to Impede the Market Growth

A few factors are acting as roadblocks to the growth of GPU as a Service industry. One of the factors includes the high incurrence of costs, which is projected to hinder market growth.

Moreover, the need for more awareness of technologically advanced methods and their misunderstanding of the advantages of GPU as a Service are other factors limiting the market growth over the forecast period.

The lack of knowledge among the employees of industries and complex behavior of the GPU as a Service is another factor that is anticipated to hinder the growth of the GPU as a Service industry.

Sudip Saha
Sudip Saha

Principal Consultant

Talk to Analyst

Find your sweet spots for generating winning opportunities in this market.

GPU as a Service Demand Analysis (2018 to 2022) Vs Market Outlook (2023 to 2033)

The global demand for GPU as a service is projected to increase at a CAGR of 40.8% in the next ten years, reaching a total of US$ 119,643.4 million in 2033, according to a report from FMI. From 2018 to 2022, sales observed significant growth, registering a CAGR of 38.7%.

Surging adoption of AI across different verticals like BFSI, healthcare, and others, is considered one of the emerging trends. Major players across the GPU as a Service industry are integrating AI technology with the cloud to assist users in managing work by offering advanced security services.

The progress of big data diagnostics techniques, combined with cloud services and AI across the healthcare system, is propelling the demand for GPU as a Service. Integrating AI in GPU as a Service helps the organization improve graphics management, security, and overall productivity.

Historical CAGR % (2018 to 2022) 38.7%
Forecast CAGR % (2023 to 2033) 40.8%

Comparative View of the GPU as a Service Market

GPU as a Service Market:

Attributes GPU as a Service Market
CAGR (2023 to 2033) 40.8%
Market Value (2033) US$ 119,643.4 million
Opportunity Manufacturers are expected to gain significant opportunities due to the adoption of integrated GPU in workstations, desktops, and notebooks owing to the increasing demand for enhanced visual content by consumers.
Key Trends Heightened adoption of Industrial Internet of Things (IIoT) across different sectors like automotive, manufacturing, consumer goods, etc., is fueling the trends of GPUaaS industry.

Computer Graphics Market:

Attributes Computer Graphics Market
CAGR (2023 to 2033) 8.3%
Market Value (2033) US$ 464.2 million
Opportunity The advent of e-sports and development of online games is creating an opportunity for the computer graphics industry.
Key Trends Burgeoning internet-connected devices utilized by businesses and individuals and growing significance of VFX in e-commerce is expected to foster market growth.

Hardware Assessment Management Market:

Attributes Hardware Assessment Management Market
CAGR (2023 to 2033) 13.4%
Market Value (2033) US$ 92 billion
Opportunity Growing adoption of cloud-based solutions for effective tracking and management of hardware assets throughout organizations.
Key Trends Increasing demand for the Internet of Things (IoT) technology, which permits real-time management and monitoring of hardware assets is optimizing asset utilization.

Get the data you need at a Fraction of the cost

Personalize your report by choosing insights you need
and save 40%!

Region-wise Insights

Is North America Projected to Continue its Dominance in the GPU as a Service Market?

Adoption of Advanced Technologies Like IoT and AI in the Region to Propel the Industry Growth

Region North America
Market Share % (2022) 32.4%

North America is slated to capture a significant chunk of the GPU as a service industry growth, flourishing at a 38% CAGR until 2033. North America is one of the earliest adopters of technologies, and the region is highly inclined toward integrating AI, IoT & robotics technologies into the manufacturing sector. Industry participants in the region are developing advanced technology products, such as IoT devices, AI chipsets, and industrial robots, with design & simulation using GPU technology, thus stimulating the regional market progress.

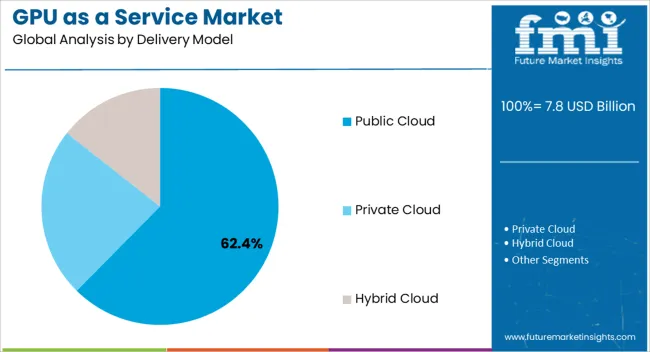
The GPU as a service industry demand from the public delivery model segment in the United States is estimated to register gains of nearly 25% through 2033. Growth is driven by the wide gamut of functions the public cloud model offers, ranging from basic storage, processing, and networking capabilities to artificial intelligence, Natural Language Processing (NLP), and standard office applications. The next-generation industrial solutions are focused on adopting GPU cloud-based technology to support their digital business solutions, buoying the GPUaaS public cloud market expansion.

Where does the Growth of the Asia Pacific GPU as a Service Market Stand?

High Traction in Gaming Applications to Fuel the Market Growth

The GPU as a Service market in the Asia Pacific is expected to capture a market share of 33.5% by 2033. The Asia Pacific is a robustly flourishing region in the GPU as a Service industry, attributed to countries such as Japan heading high in the gaming arena.

In Japan, the gaming application segment held a substantial market share in 2022. GPUaaS in Japan is gaining high traction in gaming applications owing to its capability to calculate vast information in a shorter duration, thereby enhancing gaming performance. GPUaaS platforms offer unmatched server uptime stability and amazing visual effects for gamers.
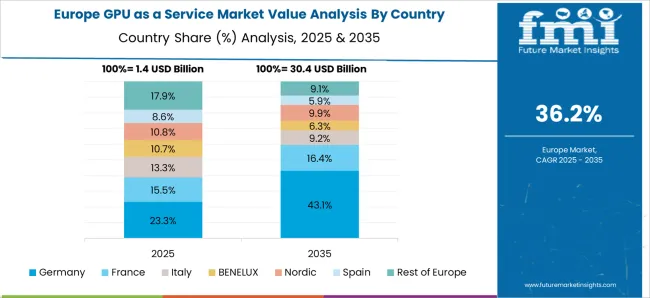
How is the Growth of the European GPU as a Service Market Projected to Unfold?

Rising Growth of Software Segment to Reaffirm Growth in Europe

Region Europe
Market Share % (2022) 25.1%

The GPU as a Service industry in Europe is projected to capture a market share of more than 25.1% in 2023, owing to the increasing software segment in the countries such as the United Kingdom and Germany.

The CAD/CAM software segment in the United Kingdom is poised to generate more than US$ 700 million in revenue by 2033. The high demand for hardware performance among professional users (such as engineers and CAD designers) compared to gamers and general consumers is propelling the usage of GPUaaS across the CAD/CAM industry.

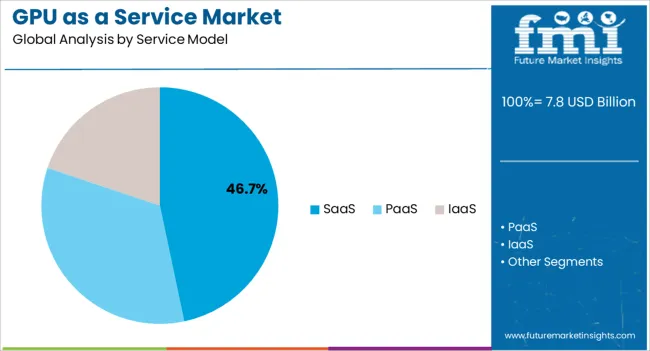
In Germany, the SaaS service model segment is likely to account for about 45% of the GPU as a service industry by 2033, impelled by the large-scale adoption of cloud-based GPU computing solutions by end-users. The usage of the SaaS model in the cloud computing market is also fueled by increased demand for Customer Relationship Management (CRM) software. SaaS has become a feasible choice for small & medium businesses with limited financial resources credited to low subscription prices and hardware flexibility.

Category-wise Insights

By Product, which GPU as a Service Category is expected to Remain Prominent?

Simulation Segment of GPU as a Service to Beat Competition in Untiring Markets

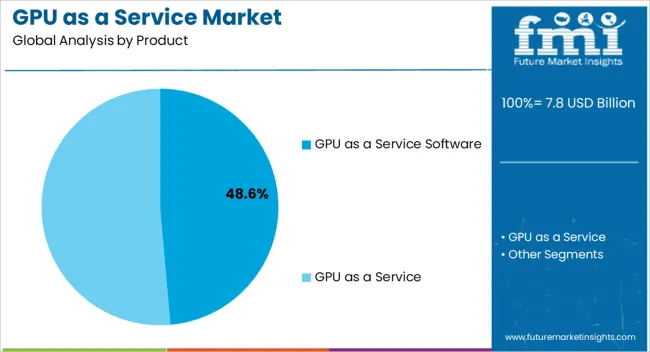
The simulation segment is projected to grow at around 39.3% CAGR over the analysis timeline, attributed to the surging adoption of advanced technologies such as augmented reality, 3D printing services, and virtual reality. In 2022, the digital video segment accounted for a market share of about 7.97%. The segment is slated to witness optimistic expansion through 2033.

Digital video enables the real-time acquisition, processing, and delivery of high-resolution videos in different video broadcast environments, which is likely to boost segmental growth in the coming years.

By Service, which GPU as a Service Category is Projected to dominate?

Updates and Maintenance to Constitute the Bulk of the GPU as a Service Market

By service, the updates and maintenance segment of the GPU as a service industry is expected to hold a market share of nearly 25% in 2023 and is speculated to showcase a solid growth trajectory during the forecast period. Companies operating in the GPUaaS market focus on regularly updating their product offerings with the latest improvements, which is anticipated to boost the growth of the GPU as a Service over the analysis period.

By Application, which GPU as a Service Category is Expected to Remain Prominent?

Real-Estate constitutes the Bulk of the Market

By application, the real-estate segment is poised to witness substantial growth at more than 36.1% CAGR during the analysis period, owing to the advent of new technologies in the real-estate sector, such as drones and augmented reality.

New in Start-Up Ecosystem: How Emerging Firms are Extending Frontiers for Future Growth?

Providers of GPU as a Service such as Graphistry, Polystream, Cloudalize, Vectordash, HashPro, Run: AI, and MapD, among others, are employing marketing strategies like new product launches, merger and acquisitions, geographical expansions, collaboration, and partnerships. By doing so, the companies are expected to identify what piques consumer interest and create a larger customer base. For example,

In July 2022, Run:ai, the well-funded service for orchestrating AI workloads, partnered with NVIDIA, to support its customers in running their inferencing workloads as efficiently as possible, whether that’s in a private or public cloud or on the edge. With this partnership, the company’s platform also integrates with Nvidia’s Triton Inference Server software.
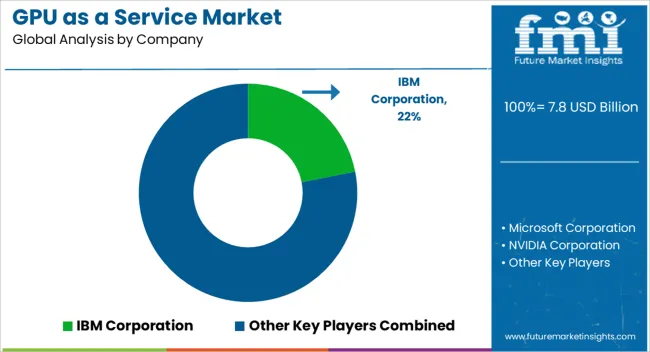
Who are the Leading Players in the GPU as a Service Market?

Prominent players in the GPU as a Service industry are IBM Corporation, Microsoft Corporation, Nvidia Corporation, Intel Corporation, Qualcomm Incorporated, Fujitsu Ltd., ARM Holdings PLC, Samsung Electronics Co., Ltd., Taiwan Semiconductor Manufacturing Company Ltd., and Imagination Technologies Ltd., among others.

Recent Developments:

  • In July 2022, NVIDIA revealed the upgrade to NeMo, minimizing the training time by 30%. These upgrades come with two innovative technologies and a hyperparameter tool that enhances the training data that can be utilized with any number of GPU training.
  • In April 2019, Qualcomm Incorporated announced the launch of Snapdragon 730, which is a mid-range 64-bit ARM LTE system on a chip. Fabricated on Samsung's 8nm LPP process, the 730 showcases six Kryo 470 Silver high-efficiency cores functioning at 1.8 GHz with two high-performance Kryo 470 Gold at 2.2 GHz. The Snapdragon 730 integrates the Adreno 618 GPU operation at 500 MHz and is equipped with an X15 LTE modem supporting Cat 15 downlink and Cat 13 uplink. This chip facilitates 8 GiB of dual-channel LPDDR4X-3733 memory.

Report Scope

Report Attribute Details
Growth Rate CAGR of 40.8% from 2023 to 2033
Market Value in 2023 US$ 3,911.4 million
Market Value in 2033 US$ 119,643.4 million
Base Year for Estimation 2022
Historical Data 2018 to 2022
Forecast Period 2023 to 2033
Quantitative Units Revenue in US$ million and CAGR from 2023 to 2033
Report Coverage Revenue Forecast, Company Ranking, Competitive Landscape, Growth Factors, Trends and Pricing Analysis
Segments Covered
  • Product
  • Service Model
  • Delivery Model
  • Application
  • Region
Regions Covered
  • North America
  • Latin America
  • Europe
  • Asia Pacific
  • Middle East and Africa
Key Countries Profiled
  • The United States
  • Canada
  • Brazil
  • Mexico
  • Germany
  • United Kingdom
  • France
  • Spain
  • Italy
  • China
  • Japan
  • South Korea
  • Malaysia
  • Singapore
  • Australia
  • New Zealand
  • GCC
  • South Africa
  • Israel
Key Companies Profiled
  • IBM Corporation
  • Microsoft Corporation
  • NVIDIA Corporation
  • Intel Corporation
  • Qualcomm Incorporated
  • Fujitsu Ltd.
  • ARM Holdings PLC
  • Samsung Electronics Co., Ltd.
  • Taiwan Semiconductor Manufacturing Company Ltd.
  • Imagination Technologies Ltd.

Key Segments Covered in the GPU as a Service Industry Analysis

By Product:

  • GPU as a Service Software
    • CAD/CAM
    • Simulation
    • Imaging
    • Digital Video
    • Modeling & Automation
    • Others
  • GPU as a Service
    • Managed Service
    • Updates & Maintenance
    • Compliance & Security
    • Others

By Service Model:

  • SaaS
  • PaaS
  • IaaS

By Delivery Model:

  • Public Cloud
  • Private Cloud
  • Hybrid Cloud

By Application:

  • Gaming
  • Design & Manufacturing
  • Automotive
  • Real Estate
  • Healthcare
  • Other Applications

By Region:

  • North America
  • Latin America
  • Europe
  • Asia Pacific
  • Middle East & Africa

Frequently Asked Questions

What is the GPU as a Service Market Worth?

The GPU as a service market is worth US$ 3,911.4 million in 2023.

What is the CAGR of the GPU as a Service Market?

The GPU as a service market is expected to rise at a 40.8% CAGR through 2033.

What is the Estimated GPU as a Service Market Size by 2033?

The market is estimated to be worth US$ 119,643.4 million by 2033.

What is the Leading Application in the GPU as a Service Market?

The real-estate segment is leading, with a 36.1% CAGR in the GPU as a service market.

What are the Prospects for Germany in the GPU as a Service Market?

Germany’s SaaS service model segment may account for about 45% of the market by 2033.

Table of Content

1. Executive Summary

    1.1. Global Market Outlook

    1.2. Demand-side Trends

    1.3. Supply-side Trends

    1.4. Technology Roadmap Analysis

    1.5. Analysis and Recommendations

2. Market Overview

    2.1. Market Coverage / Taxonomy

    2.2. Market Definition / Scope / Limitations

3. Market Background

    3.1. Market Dynamics

        3.1.1. Drivers

        3.1.2. Restraints

        3.1.3. Opportunity

        3.1.4. Trends

    3.2. Scenario Forecast

        3.2.1. Demand in Optimistic Scenario

        3.2.2. Demand in Likely Scenario

        3.2.3. Demand in Conservative Scenario

    3.3. Opportunity Map Analysis

    3.4. Investment Feasibility Matrix

    3.5. PESTLE and Porter’s Analysis

    3.6. Regulatory Landscape

        3.6.1. By Key Regions

        3.6.2. By Key Countries

    3.7. Regional Parent Market Outlook

4. Global Market Analysis 2018 to 2022 and Forecast, 2023 to 2033

    4.1. Historical Market Size Value (US$ Million) Analysis, 2018 to 2022

    4.2. Current and Future Market Size Value (US$ Million) Projections, 2023 to 2033

        4.2.1. Y-o-Y Growth Trend Analysis

        4.2.2. Absolute $ Opportunity Analysis

5. Global Market Analysis 2018 to 2022 and Forecast 2023 to 2033, By Product

    5.1. Introduction / Key Findings

    5.2. Historical Market Size Value (US$ Million) Analysis By Product, 2018 to 2022

    5.3. Current and Future Market Size Value (US$ Million) Analysis and Forecast By Product, 2023 to 2033

        5.3.1. Service Software

            5.3.1.1. CAD/CAM

            5.3.1.2. Simulation

            5.3.1.3. Imaging

            5.3.1.4. Digital Video

            5.3.1.5. Modeling & Automation

            5.3.1.6. Others

        5.3.2. Service

            5.3.2.1. Managed Service

            5.3.2.2. Updates & Maintenance

            5.3.2.3. Compliance & Security

            5.3.2.4. Others

    5.4. Y-o-Y Growth Trend Analysis By Product, 2018 to 2022

    5.5. Absolute $ Opportunity Analysis By Product, 2023 to 2033

6. Global Market Analysis 2018 to 2022 and Forecast 2023 to 2033, By Service Model

    6.1. Introduction / Key Findings

    6.2. Historical Market Size Value (US$ Million) Analysis By Service Model, 2018 to 2022

    6.3. Current and Future Market Size Value (US$ Million) Analysis and Forecast By Service Model, 2023 to 2033

        6.3.1. SaaS

        6.3.2. PaaS

        6.3.3. IaaS

    6.4. Y-o-Y Growth Trend Analysis By Service Model, 2018 to 2022

    6.5. Absolute $ Opportunity Analysis By Service Model, 2023 to 2033

7. Global Market Analysis 2018 to 2022 and Forecast 2023 to 2033, By Delivery Model 

    7.1. Introduction / Key Findings

    7.2. Historical Market Size Value (US$ Million) Analysis By Delivery Model , 2018 to 2022

    7.3. Current and Future Market Size Value (US$ Million) Analysis and Forecast By Delivery Model , 2023 to 2033

        7.3.1. Public

        7.3.2. Private

        7.3.3. Hybrid

    7.4. Y-o-Y Growth Trend Analysis By Delivery Model , 2018 to 2022

    7.5. Absolute $ Opportunity Analysis By Delivery Model , 2023 to 2033

8. Global Market Analysis 2018 to 2022 and Forecast 2023 to 2033, By Application

    8.1. Introduction / Key Findings

    8.2. Historical Market Size Value (US$ Million) Analysis By Application, 2018 to 2022

    8.3. Current and Future Market Size Value (US$ Million) Analysis and Forecast By Application, 2023 to 2033

        8.3.1. Gaming

        8.3.2. Design & Manufacturing

        8.3.3. Automotive

        8.3.4. Real Estate

        8.3.5. Healthcare

        8.3.6. Others

    8.4. Y-o-Y Growth Trend Analysis By Application, 2018 to 2022

    8.5. Absolute $ Opportunity Analysis By Application, 2023 to 2033

9. Global Market Analysis 2018 to 2022 and Forecast 2023 to 2033, By Region

    9.1. Introduction

    9.2. Historical Market Size Value (US$ Million) Analysis By Region, 2018 to 2022

    9.3. Current Market Size Value (US$ Million) Analysis and Forecast By Region, 2023 to 2033

        9.3.1. North America

        9.3.2. Latin America

        9.3.3. Western Europe

        9.3.4. Eastern Europe

        9.3.5. South Asia and Pacific

        9.3.6. East Asia

        9.3.7. Middle East and Africa

    9.4. Market Attractiveness Analysis By Region

10. North America Market Analysis 2018 to 2022 and Forecast 2023 to 2033, By Country

    10.1. Historical Market Size Value (US$ Million) Trend Analysis By Market Taxonomy, 2018 to 2022

    10.2. Market Size Value (US$ Million) Forecast By Market Taxonomy, 2023 to 2033

        10.2.1. By Country

            10.2.1.1. U.S.

            10.2.1.2. Canada

        10.2.2. By Product

        10.2.3. By Service Model

        10.2.4. By Delivery Model

        10.2.5. By Application

    10.3. Market Attractiveness Analysis

        10.3.1. By Country

        10.3.2. By Product

        10.3.3. By Service Model

        10.3.4. By Delivery Model

        10.3.5. By Application

    10.4. Key Takeaways

11. Latin America Market Analysis 2018 to 2022 and Forecast 2023 to 2033, By Country

    11.1. Historical Market Size Value (US$ Million) Trend Analysis By Market Taxonomy, 2018 to 2022

    11.2. Market Size Value (US$ Million) Forecast By Market Taxonomy, 2023 to 2033

        11.2.1. By Country

            11.2.1.1. Brazil

            11.2.1.2. Mexico

            11.2.1.3. Rest of Latin America

        11.2.2. By Product

        11.2.3. By Service Model

        11.2.4. By Delivery Model

        11.2.5. By Application

    11.3. Market Attractiveness Analysis

        11.3.1. By Country

        11.3.2. By Product

        11.3.3. By Service Model

        11.3.4. By Delivery Model

        11.3.5. By Application

    11.4. Key Takeaways

12. Western Europe Market Analysis 2018 to 2022 and Forecast 2023 to 2033, By Country

    12.1. Historical Market Size Value (US$ Million) Trend Analysis By Market Taxonomy, 2018 to 2022

    12.2. Market Size Value (US$ Million) Forecast By Market Taxonomy, 2023 to 2033

        12.2.1. By Country

            12.2.1.1. Germany

            12.2.1.2. U.K.

            12.2.1.3. France

            12.2.1.4. Spain

            12.2.1.5. Italy

            12.2.1.6. Rest of Western Europe

        12.2.2. By Product

        12.2.3. By Service Model

        12.2.4. By Delivery Model

        12.2.5. By Application

    12.3. Market Attractiveness Analysis

        12.3.1. By Country

        12.3.2. By Product

        12.3.3. By Service Model

        12.3.4. By Delivery Model

        12.3.5. By Application

    12.4. Key Takeaways

13. Eastern Europe Market Analysis 2018 to 2022 and Forecast 2023 to 2033, By Country

    13.1. Historical Market Size Value (US$ Million) Trend Analysis By Market Taxonomy, 2018 to 2022

    13.2. Market Size Value (US$ Million) Forecast By Market Taxonomy, 2023 to 2033

        13.2.1. By Country

            13.2.1.1. Poland

            13.2.1.2. Russia

            13.2.1.3. Czech Republic

            13.2.1.4. Romania

            13.2.1.5. Rest of Eastern Europe

        13.2.2. By Product

        13.2.3. By Service Model

        13.2.4. By Delivery Model

        13.2.5. By Application

    13.3. Market Attractiveness Analysis

        13.3.1. By Country

        13.3.2. By Product

        13.3.3. By Service Model

        13.3.4. By Delivery Model

        13.3.5. By Application

    13.4. Key Takeaways

14. South Asia and Pacific Market Analysis 2018 to 2022 and Forecast 2023 to 2033, By Country

    14.1. Historical Market Size Value (US$ Million) Trend Analysis By Market Taxonomy, 2018 to 2022

    14.2. Market Size Value (US$ Million) Forecast By Market Taxonomy, 2023 to 2033

        14.2.1. By Country

            14.2.1.1. India

            14.2.1.2. Bangladesh

            14.2.1.3. Australia

            14.2.1.4. New Zealand

            14.2.1.5. Rest of South Asia and Pacific

        14.2.2. By Product

        14.2.3. By Service Model

        14.2.4. By Delivery Model

        14.2.5. By Application

    14.3. Market Attractiveness Analysis

        14.3.1. By Country

        14.3.2. By Product

        14.3.3. By Service Model

        14.3.4. By Delivery Model

        14.3.5. By Application

    14.4. Key Takeaways

15. East Asia Market Analysis 2018 to 2022 and Forecast 2023 to 2033, By Country

    15.1. Historical Market Size Value (US$ Million) Trend Analysis By Market Taxonomy, 2018 to 2022

    15.2. Market Size Value (US$ Million) Forecast By Market Taxonomy, 2023 to 2033

        15.2.1. By Country

            15.2.1.1. China

            15.2.1.2. Japan

            15.2.1.3. South Korea

        15.2.2. By Product

        15.2.3. By Service Model

        15.2.4. By Delivery Model

        15.2.5. By Application

    15.3. Market Attractiveness Analysis

        15.3.1. By Country

        15.3.2. By Product

        15.3.3. By Service Model

        15.3.4. By Delivery Model

        15.3.5. By Application

    15.4. Key Takeaways

16. Middle East and Africa Market Analysis 2018 to 2022 and Forecast 2023 to 2033, By Country

    16.1. Historical Market Size Value (US$ Million) Trend Analysis By Market Taxonomy, 2018 to 2022

    16.2. Market Size Value (US$ Million) Forecast By Market Taxonomy, 2023 to 2033

        16.2.1. By Country

            16.2.1.1. GCC Countries

            16.2.1.2. South Africa

            16.2.1.3. Israel

            16.2.1.4. Rest of MEA

        16.2.2. By Product

        16.2.3. By Service Model

        16.2.4. By Delivery Model

        16.2.5. By Application

    16.3. Market Attractiveness Analysis

        16.3.1. By Country

        16.3.2. By Product

        16.3.3. By Service Model

        16.3.4. By Delivery Model

        16.3.5. By Application

    16.4. Key Takeaways

17. Key Countries Market Analysis

    17.1. U.S.

        17.1.1. Pricing Analysis

        17.1.2. Market Share Analysis, 2022

            17.1.2.1. By Product

            17.1.2.2. By Service Model

            17.1.2.3. By Delivery Model

            17.1.2.4. By Application

    17.2. Canada

        17.2.1. Pricing Analysis

        17.2.2. Market Share Analysis, 2022

            17.2.2.1. By Product

            17.2.2.2. By Service Model

            17.2.2.3. By Delivery Model

            17.2.2.4. By Application

    17.3. Brazil

        17.3.1. Pricing Analysis

        17.3.2. Market Share Analysis, 2022

            17.3.2.1. By Product

            17.3.2.2. By Service Model

            17.3.2.3. By Delivery Model

            17.3.2.4. By Application

    17.4. Mexico

        17.4.1. Pricing Analysis

        17.4.2. Market Share Analysis, 2022

            17.4.2.1. By Product

            17.4.2.2. By Service Model

            17.4.2.3. By Delivery Model

            17.4.2.4. By Application

    17.5. Germany

        17.5.1. Pricing Analysis

        17.5.2. Market Share Analysis, 2022

            17.5.2.1. By Product

            17.5.2.2. By Service Model

            17.5.2.3. By Delivery Model

            17.5.2.4. By Application

    17.6. U.K.

        17.6.1. Pricing Analysis

        17.6.2. Market Share Analysis, 2022

            17.6.2.1. By Product

            17.6.2.2. By Service Model

            17.6.2.3. By Delivery Model

            17.6.2.4. By Application

    17.7. France

        17.7.1. Pricing Analysis

        17.7.2. Market Share Analysis, 2022

            17.7.2.1. By Product

            17.7.2.2. By Service Model

            17.7.2.3. By Delivery Model

            17.7.2.4. By Application

    17.8. Spain

        17.8.1. Pricing Analysis

        17.8.2. Market Share Analysis, 2022

            17.8.2.1. By Product

            17.8.2.2. By Service Model

            17.8.2.3. By Delivery Model

            17.8.2.4. By Application

    17.9. Italy

        17.9.1. Pricing Analysis

        17.9.2. Market Share Analysis, 2022

            17.9.2.1. By Product

            17.9.2.2. By Service Model

            17.9.2.3. By Delivery Model

            17.9.2.4. By Application

    17.10. Poland

        17.10.1. Pricing Analysis

        17.10.2. Market Share Analysis, 2022

            17.10.2.1. By Product

            17.10.2.2. By Service Model

            17.10.2.3. By Delivery Model

            17.10.2.4. By Application

    17.11. Russia

        17.11.1. Pricing Analysis

        17.11.2. Market Share Analysis, 2022

            17.11.2.1. By Product

            17.11.2.2. By Service Model

            17.11.2.3. By Delivery Model

            17.11.2.4. By Application

    17.12. Czech Republic

        17.12.1. Pricing Analysis

        17.12.2. Market Share Analysis, 2022

            17.12.2.1. By Product

            17.12.2.2. By Service Model

            17.12.2.3. By Delivery Model

            17.12.2.4. By Application

    17.13. Romania

        17.13.1. Pricing Analysis

        17.13.2. Market Share Analysis, 2022

            17.13.2.1. By Product

            17.13.2.2. By Service Model

            17.13.2.3. By Delivery Model

            17.13.2.4. By Application

    17.14. India

        17.14.1. Pricing Analysis

        17.14.2. Market Share Analysis, 2022

            17.14.2.1. By Product

            17.14.2.2. By Service Model

            17.14.2.3. By Delivery Model

            17.14.2.4. By Application

    17.15. Bangladesh

        17.15.1. Pricing Analysis

        17.15.2. Market Share Analysis, 2022

            17.15.2.1. By Product

            17.15.2.2. By Service Model

            17.15.2.3. By Delivery Model

            17.15.2.4. By Application

    17.16. Australia

        17.16.1. Pricing Analysis

        17.16.2. Market Share Analysis, 2022

            17.16.2.1. By Product

            17.16.2.2. By Service Model

            17.16.2.3. By Delivery Model

            17.16.2.4. By Application

    17.17. New Zealand

        17.17.1. Pricing Analysis

        17.17.2. Market Share Analysis, 2022

            17.17.2.1. By Product

            17.17.2.2. By Service Model

            17.17.2.3. By Delivery Model

            17.17.2.4. By Application

    17.18. China

        17.18.1. Pricing Analysis

        17.18.2. Market Share Analysis, 2022

            17.18.2.1. By Product

            17.18.2.2. By Service Model

            17.18.2.3. By Delivery Model

            17.18.2.4. By Application

    17.19. Japan

        17.19.1. Pricing Analysis

        17.19.2. Market Share Analysis, 2022

            17.19.2.1. By Product

            17.19.2.2. By Service Model

            17.19.2.3. By Delivery Model

            17.19.2.4. By Application

    17.20. South Korea

        17.20.1. Pricing Analysis

        17.20.2. Market Share Analysis, 2022

            17.20.2.1. By Product

            17.20.2.2. By Service Model

            17.20.2.3. By Delivery Model

            17.20.2.4. By Application

    17.21. GCC Countries

        17.21.1. Pricing Analysis

        17.21.2. Market Share Analysis, 2022

            17.21.2.1. By Product

            17.21.2.2. By Service Model

            17.21.2.3. By Delivery Model

            17.21.2.4. By Application

    17.22. South Africa

        17.22.1. Pricing Analysis

        17.22.2. Market Share Analysis, 2022

            17.22.2.1. By Product

            17.22.2.2. By Service Model

            17.22.2.3. By Delivery Model

            17.22.2.4. By Application

    17.23. Israel

        17.23.1. Pricing Analysis

        17.23.2. Market Share Analysis, 2022

            17.23.2.1. By Product

            17.23.2.2. By Service Model

            17.23.2.3. By Delivery Model

            17.23.2.4. By Application

18. Market Structure Analysis

    18.1. Competition Dashboard

    18.2. Competition Benchmarking

    18.3. Market Share Analysis of Top Players

        18.3.1. By Regional

        18.3.2. By Product

        18.3.3. By Service Model

        18.3.4. By Delivery Model

        18.3.5. By Application

19. Competition Analysis

    19.1. Competition Deep Dive

        19.1.1. IBM Corporation

            19.1.1.1. Overview

            19.1.1.2. Product Portfolio

            19.1.1.3. Profitability by Market Segments

            19.1.1.4. Sales Footprint

            19.1.1.5. Strategy Overview

                19.1.1.5.1. Marketing Strategy

        19.1.2. Microsoft Corporation

            19.1.2.1. Overview

            19.1.2.2. Product Portfolio

            19.1.2.3. Profitability by Market Segments

            19.1.2.4. Sales Footprint

            19.1.2.5. Strategy Overview

                19.1.2.5.1. Marketing Strategy

        19.1.3. NVIDIA Corporation

            19.1.3.1. Overview

            19.1.3.2. Product Portfolio

            19.1.3.3. Profitability by Market Segments

            19.1.3.4. Sales Footprint

            19.1.3.5. Strategy Overview

                19.1.3.5.1. Marketing Strategy

        19.1.4. Intel Corporation

            19.1.4.1. Overview

            19.1.4.2. Product Portfolio

            19.1.4.3. Profitability by Market Segments

            19.1.4.4. Sales Footprint

            19.1.4.5. Strategy Overview

                19.1.4.5.1. Marketing Strategy

        19.1.5. Qualcomm Incorporated

            19.1.5.1. Overview

            19.1.5.2. Product Portfolio

            19.1.5.3. Profitability by Market Segments

            19.1.5.4. Sales Footprint

            19.1.5.5. Strategy Overview

                19.1.5.5.1. Marketing Strategy

        19.1.6. Fujitsu Ltd.

            19.1.6.1. Overview

            19.1.6.2. Product Portfolio

            19.1.6.3. Profitability by Market Segments

            19.1.6.4. Sales Footprint

            19.1.6.5. Strategy Overview

                19.1.6.5.1. Marketing Strategy

        19.1.7. ARM Holdings PLC

            19.1.7.1. Overview

            19.1.7.2. Product Portfolio

            19.1.7.3. Profitability by Market Segments

            19.1.7.4. Sales Footprint

            19.1.7.5. Strategy Overview

                19.1.7.5.1. Marketing Strategy

        19.1.8. Samsung Electronics Co., Ltd.

            19.1.8.1. Overview

            19.1.8.2. Product Portfolio

            19.1.8.3. Profitability by Market Segments

            19.1.8.4. Sales Footprint

            19.1.8.5. Strategy Overview

                19.1.8.5.1. Marketing Strategy

        19.1.9. Taiwan Semiconductor Manufacturing Company Ltd.

            19.1.9.1. Overview

            19.1.9.2. Product Portfolio

            19.1.9.3. Profitability by Market Segments

            19.1.9.4. Sales Footprint

            19.1.9.5. Strategy Overview

                19.1.9.5.1. Marketing Strategy

        19.1.10. Imagination Technologies Ltd.

            19.1.10.1. Overview

            19.1.10.2. Product Portfolio

            19.1.10.3. Profitability by Market Segments

            19.1.10.4. Sales Footprint

            19.1.10.5. Strategy Overview

                19.1.10.5.1. Marketing Strategy

20. Assumptions & Acronyms Used

21. Research Methodology

Don't pay for what you don't need

Customize your report by selecting specific countries or regions and save 30%!

List of Tables

Table 1: Global Market Value (US$ Million) Forecast by Region, 2018 to 2033

Table 2: Global Market Value (US$ Million) Forecast by Product, 2018 to 2033

Table 3: Global Market Value (US$ Million) Forecast by Service Model, 2018 to 2033

Table 4: Global Market Value (US$ Million) Forecast by Delivery Model , 2018 to 2033

Table 5: Global Market Value (US$ Million) Forecast by Application, 2018 to 2033

Table 6: North America Market Value (US$ Million) Forecast by Country, 2018 to 2033

Table 7: North America Market Value (US$ Million) Forecast by Product, 2018 to 2033

Table 8: North America Market Value (US$ Million) Forecast by Service Model, 2018 to 2033

Table 9: North America Market Value (US$ Million) Forecast by Delivery Model , 2018 to 2033

Table 10: North America Market Value (US$ Million) Forecast by Application, 2018 to 2033

Table 11: Latin America Market Value (US$ Million) Forecast by Country, 2018 to 2033

Table 12: Latin America Market Value (US$ Million) Forecast by Product, 2018 to 2033

Table 13: Latin America Market Value (US$ Million) Forecast by Service Model, 2018 to 2033

Table 14: Latin America Market Value (US$ Million) Forecast by Delivery Model , 2018 to 2033

Table 15: Latin America Market Value (US$ Million) Forecast by Application, 2018 to 2033

Table 16: Western Europe Market Value (US$ Million) Forecast by Country, 2018 to 2033

Table 17: Western Europe Market Value (US$ Million) Forecast by Product, 2018 to 2033

Table 18: Western Europe Market Value (US$ Million) Forecast by Service Model, 2018 to 2033

Table 19: Western Europe Market Value (US$ Million) Forecast by Delivery Model , 2018 to 2033

Table 20: Western Europe Market Value (US$ Million) Forecast by Application, 2018 to 2033

Table 21: Eastern Europe Market Value (US$ Million) Forecast by Country, 2018 to 2033

Table 22: Eastern Europe Market Value (US$ Million) Forecast by Product, 2018 to 2033

Table 23: Eastern Europe Market Value (US$ Million) Forecast by Service Model, 2018 to 2033

Table 24: Eastern Europe Market Value (US$ Million) Forecast by Delivery Model , 2018 to 2033

Table 25: Eastern Europe Market Value (US$ Million) Forecast by Application, 2018 to 2033

Table 26: South Asia and Pacific Market Value (US$ Million) Forecast by Country, 2018 to 2033

Table 27: South Asia and Pacific Market Value (US$ Million) Forecast by Product, 2018 to 2033

Table 28: South Asia and Pacific Market Value (US$ Million) Forecast by Service Model, 2018 to 2033

Table 29: South Asia and Pacific Market Value (US$ Million) Forecast by Delivery Model , 2018 to 2033

Table 30: South Asia and Pacific Market Value (US$ Million) Forecast by Application, 2018 to 2033

Table 31: East Asia Market Value (US$ Million) Forecast by Country, 2018 to 2033

Table 32: East Asia Market Value (US$ Million) Forecast by Product, 2018 to 2033

Table 33: East Asia Market Value (US$ Million) Forecast by Service Model, 2018 to 2033

Table 34: East Asia Market Value (US$ Million) Forecast by Delivery Model , 2018 to 2033

Table 35: East Asia Market Value (US$ Million) Forecast by Application, 2018 to 2033

Table 36: Middle East and Africa Market Value (US$ Million) Forecast by Country, 2018 to 2033

Table 37: Middle East and Africa Market Value (US$ Million) Forecast by Product, 2018 to 2033

Table 38: Middle East and Africa Market Value (US$ Million) Forecast by Service Model, 2018 to 2033

Table 39: Middle East and Africa Market Value (US$ Million) Forecast by Delivery Model , 2018 to 2033

Table 40: Middle East and Africa Market Value (US$ Million) Forecast by Application, 2018 to 2033
Sudip Saha
Sudip Saha

Principal Consultant

Talk to Analyst

Find your sweet spots for generating winning opportunities in this market.

List of Charts

Figure 1: Global Market Value (US$ Million) by Product, 2023 to 2033

Figure 2: Global Market Value (US$ Million) by Service Model, 2023 to 2033

Figure 3: Global Market Value (US$ Million) by Delivery Model , 2023 to 2033

Figure 4: Global Market Value (US$ Million) by Application, 2023 to 2033

Figure 5: Global Market Value (US$ Million) by Region, 2023 to 2033

Figure 6: Global Market Value (US$ Million) Analysis by Region, 2018 to 2033

Figure 7: Global Market Value Share (%) and BPS Analysis by Region, 2023 to 2033

Figure 8: Global Market Y-o-Y Growth (%) Projections by Region, 2023 to 2033

Figure 9: Global Market Value (US$ Million) Analysis by Product, 2018 to 2033

Figure 10: Global Market Value Share (%) and BPS Analysis by Product, 2023 to 2033

Figure 11: Global Market Y-o-Y Growth (%) Projections by Product, 2023 to 2033

Figure 12: Global Market Value (US$ Million) Analysis by Service Model, 2018 to 2033

Figure 13: Global Market Value Share (%) and BPS Analysis by Service Model, 2023 to 2033

Figure 14: Global Market Y-o-Y Growth (%) Projections by Service Model, 2023 to 2033

Figure 15: Global Market Value (US$ Million) Analysis by Delivery Model , 2018 to 2033

Figure 16: Global Market Value Share (%) and BPS Analysis by Delivery Model , 2023 to 2033

Figure 17: Global Market Y-o-Y Growth (%) Projections by Delivery Model , 2023 to 2033

Figure 18: Global Market Value (US$ Million) Analysis by Application, 2018 to 2033

Figure 19: Global Market Value Share (%) and BPS Analysis by Application, 2023 to 2033

Figure 20: Global Market Y-o-Y Growth (%) Projections by Application, 2023 to 2033

Figure 21: Global Market Attractiveness by Product, 2023 to 2033

Figure 22: Global Market Attractiveness by Service Model, 2023 to 2033

Figure 23: Global Market Attractiveness by Delivery Model , 2023 to 2033

Figure 24: Global Market Attractiveness by Application, 2023 to 2033

Figure 25: Global Market Attractiveness by Region, 2023 to 2033

Figure 26: North America Market Value (US$ Million) by Product, 2023 to 2033

Figure 27: North America Market Value (US$ Million) by Service Model, 2023 to 2033

Figure 28: North America Market Value (US$ Million) by Delivery Model , 2023 to 2033

Figure 29: North America Market Value (US$ Million) by Application, 2023 to 2033

Figure 30: North America Market Value (US$ Million) by Country, 2023 to 2033

Figure 31: North America Market Value (US$ Million) Analysis by Country, 2018 to 2033

Figure 32: North America Market Value Share (%) and BPS Analysis by Country, 2023 to 2033

Figure 33: North America Market Y-o-Y Growth (%) Projections by Country, 2023 to 2033

Figure 34: North America Market Value (US$ Million) Analysis by Product, 2018 to 2033

Figure 35: North America Market Value Share (%) and BPS Analysis by Product, 2023 to 2033

Figure 36: North America Market Y-o-Y Growth (%) Projections by Product, 2023 to 2033

Figure 37: North America Market Value (US$ Million) Analysis by Service Model, 2018 to 2033

Figure 38: North America Market Value Share (%) and BPS Analysis by Service Model, 2023 to 2033

Figure 39: North America Market Y-o-Y Growth (%) Projections by Service Model, 2023 to 2033

Figure 40: North America Market Value (US$ Million) Analysis by Delivery Model , 2018 to 2033

Figure 41: North America Market Value Share (%) and BPS Analysis by Delivery Model , 2023 to 2033

Figure 42: North America Market Y-o-Y Growth (%) Projections by Delivery Model , 2023 to 2033

Figure 43: North America Market Value (US$ Million) Analysis by Application, 2018 to 2033

Figure 44: North America Market Value Share (%) and BPS Analysis by Application, 2023 to 2033

Figure 45: North America Market Y-o-Y Growth (%) Projections by Application, 2023 to 2033

Figure 46: North America Market Attractiveness by Product, 2023 to 2033

Figure 47: North America Market Attractiveness by Service Model, 2023 to 2033

Figure 48: North America Market Attractiveness by Delivery Model , 2023 to 2033

Figure 49: North America Market Attractiveness by Application, 2023 to 2033

Figure 50: North America Market Attractiveness by Country, 2023 to 2033

Figure 51: Latin America Market Value (US$ Million) by Product, 2023 to 2033

Figure 52: Latin America Market Value (US$ Million) by Service Model, 2023 to 2033

Figure 53: Latin America Market Value (US$ Million) by Delivery Model , 2023 to 2033

Figure 54: Latin America Market Value (US$ Million) by Application, 2023 to 2033

Figure 55: Latin America Market Value (US$ Million) by Country, 2023 to 2033

Figure 56: Latin America Market Value (US$ Million) Analysis by Country, 2018 to 2033

Figure 57: Latin America Market Value Share (%) and BPS Analysis by Country, 2023 to 2033

Figure 58: Latin America Market Y-o-Y Growth (%) Projections by Country, 2023 to 2033

Figure 59: Latin America Market Value (US$ Million) Analysis by Product, 2018 to 2033

Figure 60: Latin America Market Value Share (%) and BPS Analysis by Product, 2023 to 2033

Figure 61: Latin America Market Y-o-Y Growth (%) Projections by Product, 2023 to 2033

Figure 62: Latin America Market Value (US$ Million) Analysis by Service Model, 2018 to 2033

Figure 63: Latin America Market Value Share (%) and BPS Analysis by Service Model, 2023 to 2033

Figure 64: Latin America Market Y-o-Y Growth (%) Projections by Service Model, 2023 to 2033

Figure 65: Latin America Market Value (US$ Million) Analysis by Delivery Model , 2018 to 2033

Figure 66: Latin America Market Value Share (%) and BPS Analysis by Delivery Model , 2023 to 2033

Figure 67: Latin America Market Y-o-Y Growth (%) Projections by Delivery Model , 2023 to 2033

Figure 68: Latin America Market Value (US$ Million) Analysis by Application, 2018 to 2033

Figure 69: Latin America Market Value Share (%) and BPS Analysis by Application, 2023 to 2033

Figure 70: Latin America Market Y-o-Y Growth (%) Projections by Application, 2023 to 2033

Figure 71: Latin America Market Attractiveness by Product, 2023 to 2033

Figure 72: Latin America Market Attractiveness by Service Model, 2023 to 2033

Figure 73: Latin America Market Attractiveness by Delivery Model , 2023 to 2033

Figure 74: Latin America Market Attractiveness by Application, 2023 to 2033

Figure 75: Latin America Market Attractiveness by Country, 2023 to 2033

Figure 76: Western Europe Market Value (US$ Million) by Product, 2023 to 2033

Figure 77: Western Europe Market Value (US$ Million) by Service Model, 2023 to 2033

Figure 78: Western Europe Market Value (US$ Million) by Delivery Model , 2023 to 2033

Figure 79: Western Europe Market Value (US$ Million) by Application, 2023 to 2033

Figure 80: Western Europe Market Value (US$ Million) by Country, 2023 to 2033

Figure 81: Western Europe Market Value (US$ Million) Analysis by Country, 2018 to 2033

Figure 82: Western Europe Market Value Share (%) and BPS Analysis by Country, 2023 to 2033

Figure 83: Western Europe Market Y-o-Y Growth (%) Projections by Country, 2023 to 2033

Figure 84: Western Europe Market Value (US$ Million) Analysis by Product, 2018 to 2033

Figure 85: Western Europe Market Value Share (%) and BPS Analysis by Product, 2023 to 2033

Figure 86: Western Europe Market Y-o-Y Growth (%) Projections by Product, 2023 to 2033

Figure 87: Western Europe Market Value (US$ Million) Analysis by Service Model, 2018 to 2033

Figure 88: Western Europe Market Value Share (%) and BPS Analysis by Service Model, 2023 to 2033

Figure 89: Western Europe Market Y-o-Y Growth (%) Projections by Service Model, 2023 to 2033

Figure 90: Western Europe Market Value (US$ Million) Analysis by Delivery Model , 2018 to 2033

Figure 91: Western Europe Market Value Share (%) and BPS Analysis by Delivery Model , 2023 to 2033

Figure 92: Western Europe Market Y-o-Y Growth (%) Projections by Delivery Model , 2023 to 2033

Figure 93: Western Europe Market Value (US$ Million) Analysis by Application, 2018 to 2033

Figure 94: Western Europe Market Value Share (%) and BPS Analysis by Application, 2023 to 2033

Figure 95: Western Europe Market Y-o-Y Growth (%) Projections by Application, 2023 to 2033

Figure 96: Western Europe Market Attractiveness by Product, 2023 to 2033

Figure 97: Western Europe Market Attractiveness by Service Model, 2023 to 2033

Figure 98: Western Europe Market Attractiveness by Delivery Model , 2023 to 2033

Figure 99: Western Europe Market Attractiveness by Application, 2023 to 2033

Figure 100: Western Europe Market Attractiveness by Country, 2023 to 2033

Figure 101: Eastern Europe Market Value (US$ Million) by Product, 2023 to 2033

Figure 102: Eastern Europe Market Value (US$ Million) by Service Model, 2023 to 2033

Figure 103: Eastern Europe Market Value (US$ Million) by Delivery Model , 2023 to 2033

Figure 104: Eastern Europe Market Value (US$ Million) by Application, 2023 to 2033

Figure 105: Eastern Europe Market Value (US$ Million) by Country, 2023 to 2033

Figure 106: Eastern Europe Market Value (US$ Million) Analysis by Country, 2018 to 2033

Figure 107: Eastern Europe Market Value Share (%) and BPS Analysis by Country, 2023 to 2033

Figure 108: Eastern Europe Market Y-o-Y Growth (%) Projections by Country, 2023 to 2033

Figure 109: Eastern Europe Market Value (US$ Million) Analysis by Product, 2018 to 2033

Figure 110: Eastern Europe Market Value Share (%) and BPS Analysis by Product, 2023 to 2033

Figure 111: Eastern Europe Market Y-o-Y Growth (%) Projections by Product, 2023 to 2033

Figure 112: Eastern Europe Market Value (US$ Million) Analysis by Service Model, 2018 to 2033

Figure 113: Eastern Europe Market Value Share (%) and BPS Analysis by Service Model, 2023 to 2033

Figure 114: Eastern Europe Market Y-o-Y Growth (%) Projections by Service Model, 2023 to 2033

Figure 115: Eastern Europe Market Value (US$ Million) Analysis by Delivery Model , 2018 to 2033

Figure 116: Eastern Europe Market Value Share (%) and BPS Analysis by Delivery Model , 2023 to 2033

Figure 117: Eastern Europe Market Y-o-Y Growth (%) Projections by Delivery Model , 2023 to 2033

Figure 118: Eastern Europe Market Value (US$ Million) Analysis by Application, 2018 to 2033

Figure 119: Eastern Europe Market Value Share (%) and BPS Analysis by Application, 2023 to 2033

Figure 120: Eastern Europe Market Y-o-Y Growth (%) Projections by Application, 2023 to 2033

Figure 121: Eastern Europe Market Attractiveness by Product, 2023 to 2033

Figure 122: Eastern Europe Market Attractiveness by Service Model, 2023 to 2033

Figure 123: Eastern Europe Market Attractiveness by Delivery Model , 2023 to 2033

Figure 124: Eastern Europe Market Attractiveness by Application, 2023 to 2033

Figure 125: Eastern Europe Market Attractiveness by Country, 2023 to 2033

Figure 126: South Asia and Pacific Market Value (US$ Million) by Product, 2023 to 2033

Figure 127: South Asia and Pacific Market Value (US$ Million) by Service Model, 2023 to 2033

Figure 128: South Asia and Pacific Market Value (US$ Million) by Delivery Model , 2023 to 2033

Figure 129: South Asia and Pacific Market Value (US$ Million) by Application, 2023 to 2033

Figure 130: South Asia and Pacific Market Value (US$ Million) by Country, 2023 to 2033

Figure 131: South Asia and Pacific Market Value (US$ Million) Analysis by Country, 2018 to 2033

Figure 132: South Asia and Pacific Market Value Share (%) and BPS Analysis by Country, 2023 to 2033

Figure 133: South Asia and Pacific Market Y-o-Y Growth (%) Projections by Country, 2023 to 2033

Figure 134: South Asia and Pacific Market Value (US$ Million) Analysis by Product, 2018 to 2033

Figure 135: South Asia and Pacific Market Value Share (%) and BPS Analysis by Product, 2023 to 2033

Figure 136: South Asia and Pacific Market Y-o-Y Growth (%) Projections by Product, 2023 to 2033

Figure 137: South Asia and Pacific Market Value (US$ Million) Analysis by Service Model, 2018 to 2033

Figure 138: South Asia and Pacific Market Value Share (%) and BPS Analysis by Service Model, 2023 to 2033

Figure 139: South Asia and Pacific Market Y-o-Y Growth (%) Projections by Service Model, 2023 to 2033

Figure 140: South Asia and Pacific Market Value (US$ Million) Analysis by Delivery Model , 2018 to 2033

Figure 141: South Asia and Pacific Market Value Share (%) and BPS Analysis by Delivery Model , 2023 to 2033

Figure 142: South Asia and Pacific Market Y-o-Y Growth (%) Projections by Delivery Model , 2023 to 2033

Figure 143: South Asia and Pacific Market Value (US$ Million) Analysis by Application, 2018 to 2033

Figure 144: South Asia and Pacific Market Value Share (%) and BPS Analysis by Application, 2023 to 2033

Figure 145: South Asia and Pacific Market Y-o-Y Growth (%) Projections by Application, 2023 to 2033

Figure 146: South Asia and Pacific Market Attractiveness by Product, 2023 to 2033

Figure 147: South Asia and Pacific Market Attractiveness by Service Model, 2023 to 2033

Figure 148: South Asia and Pacific Market Attractiveness by Delivery Model , 2023 to 2033

Figure 149: South Asia and Pacific Market Attractiveness by Application, 2023 to 2033

Figure 150: South Asia and Pacific Market Attractiveness by Country, 2023 to 2033

Figure 151: East Asia Market Value (US$ Million) by Product, 2023 to 2033

Figure 152: East Asia Market Value (US$ Million) by Service Model, 2023 to 2033

Figure 153: East Asia Market Value (US$ Million) by Delivery Model , 2023 to 2033

Figure 154: East Asia Market Value (US$ Million) by Application, 2023 to 2033

Figure 155: East Asia Market Value (US$ Million) by Country, 2023 to 2033

Figure 156: East Asia Market Value (US$ Million) Analysis by Country, 2018 to 2033

Figure 157: East Asia Market Value Share (%) and BPS Analysis by Country, 2023 to 2033

Figure 158: East Asia Market Y-o-Y Growth (%) Projections by Country, 2023 to 2033

Figure 159: East Asia Market Value (US$ Million) Analysis by Product, 2018 to 2033

Figure 160: East Asia Market Value Share (%) and BPS Analysis by Product, 2023 to 2033

Figure 161: East Asia Market Y-o-Y Growth (%) Projections by Product, 2023 to 2033

Figure 162: East Asia Market Value (US$ Million) Analysis by Service Model, 2018 to 2033

Figure 163: East Asia Market Value Share (%) and BPS Analysis by Service Model, 2023 to 2033

Figure 164: East Asia Market Y-o-Y Growth (%) Projections by Service Model, 2023 to 2033

Figure 165: East Asia Market Value (US$ Million) Analysis by Delivery Model , 2018 to 2033

Figure 166: East Asia Market Value Share (%) and BPS Analysis by Delivery Model , 2023 to 2033

Figure 167: East Asia Market Y-o-Y Growth (%) Projections by Delivery Model , 2023 to 2033

Figure 168: East Asia Market Value (US$ Million) Analysis by Application, 2018 to 2033

Figure 169: East Asia Market Value Share (%) and BPS Analysis by Application, 2023 to 2033

Figure 170: East Asia Market Y-o-Y Growth (%) Projections by Application, 2023 to 2033

Figure 171: East Asia Market Attractiveness by Product, 2023 to 2033

Figure 172: East Asia Market Attractiveness by Service Model, 2023 to 2033

Figure 173: East Asia Market Attractiveness by Delivery Model , 2023 to 2033

Figure 174: East Asia Market Attractiveness by Application, 2023 to 2033

Figure 175: East Asia Market Attractiveness by Country, 2023 to 2033

Figure 176: Middle East and Africa Market Value (US$ Million) by Product, 2023 to 2033

Figure 177: Middle East and Africa Market Value (US$ Million) by Service Model, 2023 to 2033

Figure 178: Middle East and Africa Market Value (US$ Million) by Delivery Model , 2023 to 2033

Figure 179: Middle East and Africa Market Value (US$ Million) by Application, 2023 to 2033

Figure 180: Middle East and Africa Market Value (US$ Million) by Country, 2023 to 2033

Figure 181: Middle East and Africa Market Value (US$ Million) Analysis by Country, 2018 to 2033

Figure 182: Middle East and Africa Market Value Share (%) and BPS Analysis by Country, 2023 to 2033

Figure 183: Middle East and Africa Market Y-o-Y Growth (%) Projections by Country, 2023 to 2033

Figure 184: Middle East and Africa Market Value (US$ Million) Analysis by Product, 2018 to 2033

Figure 185: Middle East and Africa Market Value Share (%) and BPS Analysis by Product, 2023 to 2033

Figure 186: Middle East and Africa Market Y-o-Y Growth (%) Projections by Product, 2023 to 2033

Figure 187: Middle East and Africa Market Value (US$ Million) Analysis by Service Model, 2018 to 2033

Figure 188: Middle East and Africa Market Value Share (%) and BPS Analysis by Service Model, 2023 to 2033

Figure 189: Middle East and Africa Market Y-o-Y Growth (%) Projections by Service Model, 2023 to 2033

Figure 190: Middle East and Africa Market Value (US$ Million) Analysis by Delivery Model , 2018 to 2033

Figure 191: Middle East and Africa Market Value Share (%) and BPS Analysis by Delivery Model , 2023 to 2033

Figure 192: Middle East and Africa Market Y-o-Y Growth (%) Projections by Delivery Model , 2023 to 2033

Figure 193: Middle East and Africa Market Value (US$ Million) Analysis by Application, 2018 to 2033

Figure 194: Middle East and Africa Market Value Share (%) and BPS Analysis by Application, 2023 to 2033

Figure 195: Middle East and Africa Market Y-o-Y Growth (%) Projections by Application, 2023 to 2033

Figure 196: Middle East and Africa Market Attractiveness by Product, 2023 to 2033

Figure 197: Middle East and Africa Market Attractiveness by Service Model, 2023 to 2033

Figure 198: Middle East and Africa Market Attractiveness by Delivery Model , 2023 to 2033

Figure 199: Middle East and Africa Market Attractiveness by Application, 2023 to 2033

Figure 200: Middle East and Africa Market Attractiveness by Country, 2023 to 2033

Recommendations

Technology

Integrated Graphics Chipset Market

Published : August 2023

Technology

Mobile Chipset Market

Published : August 2023

Explore Technology Insights

View Reports