Reports

- Global Locations -

Headquarters

Future Market Insights, Inc.

Christiana Corporate, 200
Continental Drive, Suite 401,
Newark, Delaware - 19713,
United States

T: +1-845-579-5705

Americas

Future Market Insights, Inc.

616 Corporate Way, Suite 2-9018,
Valley Cottage, NY 10989, United States

T: +1-347-918-3531

MEA

Future Market Insights

1602-6 Jumeirah Bay X2 Tower, Plot No: JLT-PH2-X2A,
Jumeirah Lakes Towers, Dubai,
United Arab Emirates

Europe

Future Market Insights

3rd Floor, 207 Regent Street,
W1B 3HH London
United Kingdom

T: + 44 (0) 20 8123 9659
D: +44 (0) 20 3287 4268

Asia Pacific

Future Market Insights

IndiaLand Global Tech Park, Unit UG-1, Behind Grand HighStreet, Phase 1, Hinjawadi, MH, Pune – 411057, India

Asia Pacific Bentonite Market Outlook (2022 to 2032)

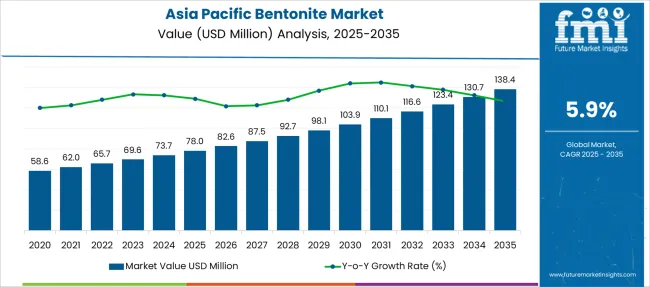
The Asia Pacific bentonite market is currently valued at around US$ 65,706.9 Thousand and is anticipated to expand at a CAGR of 5.9% to reach US$ 116,799.7 Thousand by 2032. Growing demand for bentonite is expected to be driven by sectors such as personal care, pharmaceutical, and agrochemical.

FMI forecasts that the Asia Pacific bentonite market is projected to register year-on-year growth of 5.0% in 2022. Increasing consumption of bentonite in applications such as dermatological solutions, soil treatment, thickener, and absorbent in skin and hair care products is expected to boost the demand over the forecast period.

Attribute Details
Base Year Value (2021A) US$ 62,602.1 Thousand
Estimated Year Value (2022E) US$ 65,706.9 Thousand
Projected Year Value (2032F) US$ 116,799.7 Thousand
Value CAGR (2022 to 2032) 5.9%
Collective Value Share: Top 3 Countries In Asia (2022E) 86.6%

Don't pay for what you don't need

Customize your report by selecting specific countries or regions and save 30%!

2017 to 2021 Asia Pacific Bentonite Market Outlook Compared to 2022 to 2032 Forecast

Demand for bentonite grew at a 2.2% CAGR between 2017 and 2021 in Asia Pacific. Owing to its extensive consumption in various applications, the market is anticipated to expand at a considerable rate over the assessment period. Increasing consumption of bentonite is projected to propel sales at 5.9% CAGR over the forecast period.

Bentonite has high absorption properties, high alkalinity, and antibacterial properties. Furthermore, it enhances soil microbial properties. The increasing need for food crops is propelling sales of bentonite in the agricultural sector. The high commercial potential of bentonite as a catalyst to promote chemical reactions and the use of bentonite in wastewater treatment is anticipated to create opportunities for growth in the forthcoming years.

Asia Pacific Bentonite Market

What are the Opportunities for Bentonite Manufacturers in Asia Pacific?

The combination of bentonite and cyclodextrin has the potential to promote a variety of chemical reactions in aqueous solutions under ultra-sonication, including the synthesis of xanthan, knoevenagel condensation, and octal hydro quinazolinones. It can also function as a catalyst in esterification reactions.

In the chemical industry, a catalyst is extremely important. The chemical sector is expanding due to the strong demand for specialty and commodity chemicals, which will provide opportunities for growth in the bentonite market.

Nikhil Kaitwade
Nikhil Kaitwade

Principal Consultant

Talk to Analyst

Find your sweet spots for generating winning opportunities in this market.

What are the Restraints in the Bentonite Market in Asia Pacific?

According to the latest study conducted by Food and Drug Administration on a bentonite sample, bentonite can have high levels of lead in it. Lead is a naturally occurring metal and bentonite tends to absorb it. High lead composition in bentonite can cause metal poisoning in the human body which can lead to death. Various government authorities and regulatory bodies are planning to put regulations on the sales and production of bentonite regarding lead content.

Bentonite is a natural material and is it is extracted from mines around the world. Owing to this there are various federal laws and government rules for the mining operation and exploration activities. For exploration activity and mining operations, government approval is required.

Owing which various government authorities and regulatory bodies are planning to put regulations on the sales and production of bentonite regarding lead content in it. Which is expected to hamper sales over the upcoming assessment period of 2022 to 2032.

Country-wise Insights

What Will Be the Demand Outlook in the China Bentonite Market?

Expansion in the Pharmaceutical Sector Will Boost Sales of Bentonite in China

China is the second-largest pharmaceutical market in the world. The government is increasing investment in the medical sector. Bentonite is used in the production of OTC Lotions, oral care, and various other pharmaceutical products. Growing investment in the pharmaceutical sector is expected to bolster the sales of bentonite over the forecast period in China.

The cosmetics and personal care sectors are growing sectors in China. Bentonite is used in a wide range of applications in the cosmetic industry. Bentonite has features such as excellent water absorption capacity, detoxification, and acne treatment, which make it ideal for personal care and cosmetics products.

Get the data you need at a Fraction of the cost

Personalize your report by choosing insights you need
and save 40%!

Category-wise Insights

What is Driving Sales of Bentonite in The Personal Care Sector?

High Popularity of Bentonite Clay Masks Will Fuel Growth

Bentonite offers high absorption capacity, and detoxifying ability, and helps in removing dirt. Owing to this reason it is widely used in the personal care industry for various applications. It is used as a thickener, absorbent, filler, texturizer, and binder in skin and hair care products and color cosmetics. Furthermore, it is used as a healing ingredient to treat diaper rash and clean impurities.

Individuals are indulging in self-care activities at home and are preferring natural ingredients, due to which, demand for personal care products & consumption of bentonite is expected to grow. In addition to this, bentonite clay masks are gaining popularity across the globe and are being preferred by individuals with acne-prone skin.

Sales of bentonite in the personal care sector are expected to increase at a CAGR of 6.3% over the forecast period and reach about US$ 31,548.6 Thousand by the end of 2032.

What Are the Growth Prospects of Bentonite in The Agricultural Industry?

Expansion of the Agricultural Sector in India and China Will Spur Demand for Bentonite

Bentonite improves soil microbial properties. Organic compounds present in soil accelerate the mineralization of organic matter and disrupt the natural metabolic process of soil organisms. Bentonite with a combination of manure can be effective to maintain or increase the soil organic matter sustainably.

Bentonite clay has a nutrient-holding capacity for soils. Its 2:1 lattice structure allows it to absorb a lot of water. It can be found in abundance and is simple to process and mine, making it less expensive than alternatives.

Demand in the agricultural sector is expected to grow at a CAGR of 5.5% during the forecast period, reaching US$ 16,304.1 Thousand by 2032.

Competitive Landscape

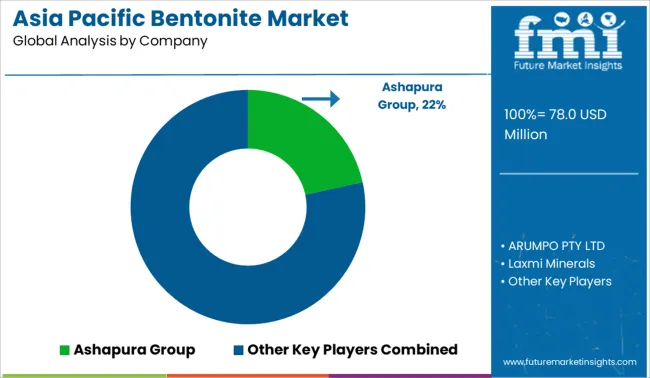
Key players operating in the Asia Pacific bentonite market are focusing on acquisitions and expansion strategies to increase revenue. They are also investing in research and development to improve their product portfolios.

Scope of Report

Attribute Details
Estimated Market Size (2022) US$ 65,706.9 Thousand
Projected Market Valuation (2032) US$ 116,799.7 Thousand
Value-based CAGR (2022 to 2032) 5.9%
Forecast Period 2022 to 2032
Historical Data Available for 2017 to 2021
Market Analysis US$ Thousand for Value and Kilograms for Volume
Key Countries Covered China, India, Japan, Indonesia, Malaysia, Thailand, Vietnam, South Korea, and the Rest of Asia Pacific.
Key Segments Covered Product Type, Applications, End-Use & Countries.
Key Companies Profiled
  • Ashapura Group
  • Kunimine Industries Co. Ltd
  • Wyo-Ben Inc
  • Manek Mineral Group
  • Arumpo Bentonite Pty Ltd
  • Organic Industries Pvt. Ltd
  • Swell Well Minechem Pvt. Ltd.
  • Dae Minerals Co., Ltd
  • Nova Gas Technologies Inc.
  • Boc Gases Ireland Inc.
Report Coverage
  • Market Forecast, Company Share Analysis, Competition Intelligence, Drivers, Restraints, Opportunities and Threats Analysis, Market Dynamics and Challenges, and Strategic Growth Initiatives

Asia Pacific Bentonite Market by Category

By Product Type:

  • Aluminum
  • Calcium
  • Sodium
  • Other

By Application:

  • Absorbent
  • Anti-inflammatory agent
  • Carrier/Formulator
  • Oral Care
  • Thickener
  • Others

By End Use:

  • Animal Care
  • Ceramics
  • Crop Protection
  • Personal Care
  • Pharmaceutical

By Country:

  • China
  • India
  • Japan
  • Indonesia
  • Malaysia
  • Thailand
  • Vietnam
  • South Korea
  • Rest of Asia Pacific

Frequently Asked Questions

What is the current Asia Pacific Bentonite market value?

The Asia Pacific Bentonite market is anticipated to reach a valuation of US$ 65,706.9 Thousand in 2022.

What is the demand outlook for Asia Pacific Bentonite?

The Asia Pacific Bentonite market is anticipated to witness a growth rate of 5.9 % over the forecast period of 2022 and 2032 in terms of value.

At what rate did the Asia Pacific Bentonite market grow between 2017 and 2021?

The Asia Pacific Bentonite market witnessed a growth of 2.2% CAGR between 2017 and 2021.

Who are the leading players in the Asia Pacific Bentonite market?

Ashapura Group, Kunimine Industries Co. Ltd, Wyo-Ben Inc, Manek Mineral Group, Arumpo Bentonite Pty Ltd, Organic Industries Pvt. Ltd, Swell Well Minechem Pvt. Ltd., Dae Minerals Co., Ltd, Nova Gas Technologies Inc., Boc Gases Ireland Inc., and others are the key players in the Asia Pacific Bentonite market.

Which are the top countries driving the Asia Pacific Bentonite market demand?

The top countries driving the Asia Pacific Bentonite demand are China, India, and Japan.

Table of Content

1. Executive Summary | Asia Pacific Bentonite Market

    1.1. Asia Pacific Market Outlook

    1.2. Demand Side Trends

    1.3. Supply Side Trends

    1.4. Product Type Roadmap Analysis

    1.5. Analysis and Recommendations

2. Market Overview

    2.1. Market Taxonomy

    2.2. Market Definition

3. Key Market Trends

    3.1. Key Trends Impacting the Market

4. Key Success Factors

    4.1. Product Adoption Analysis

    4.2. Strategic Promotional Strategies

    4.3. Technological Innovation

5. Asia Pacific Market Demand Analysis 2017 to 2021 and Forecast, 2022 to 2032

    5.1. Historical Market Volume (Tons) Analysis, 2017 to 2021

    5.2. Current and Future Market Volume (Tons) Projections, 2022 to 2032

    5.3. Y-o-Y Growth Trend Analysis

6. Pricing Analysis

    6.1. Regional Pricing Analysis By Product Type

    6.2. Asia Pacific Average Pricing Analysis Benchmark

7. Asia Pacific Market Demand (in Value or Size in US$ Million) Analysis 2017 to 2021 and Forecast, 2022 to 2032

    7.1. Historical Market Value (US$ Million) Analysis, 2017 to 2021

    7.2. Current and Future Market Value (US$ Million) Projections, 2022 to 2032

        7.2.1. Y-o-Y Growth Trend Analysis

        7.2.2. Absolute $ Opportunity Analysis

8. Market Background

    8.1. Macro-Economic Factors

    8.2. Forecast Factors - Relevance & Impact

    8.3. Value Chain

    8.4. Supply Demand Analysis

    8.5. Market Dynamics

        8.5.1. Drivers

        8.5.2. Restraints

        8.5.3. Opportunity Analysis

    8.6. Impact of COVID–19 Crisis

        8.6.1. Introduction

        8.6.2. World Economy / Cluster Projections

        8.6.3. Potential of Impact by Taxonomy

        8.6.4. Recovery Scenario (Short, Mid, and Long Term)

        8.6.5. Key Strategies

9. Asia Pacific Market Analysis 2017 to 2021 and Forecast 2022 to 2032, By Product Type

    9.1. Introduction

        9.1.1. Market Value Share Analysis By Product Type

        9.1.2. Y-o-Y Growth Analysis By Product Type

    9.2. Historical Market Size and Volume Analysis By Product Type 2017 to 2021

    9.3. Market Size and Volume Forecast By Product Type 2022 to 2032

        9.3.1. Sodium

        9.3.2. Calcium

        9.3.3. Aluminum

        9.3.4. Others

    9.4. Market Attractiveness Analysis By Product Type

10. Asia Pacific Market Analysis 2017 to 2021 and Forecast 2022 to 2032, By Application

    10.1. Introduction

        10.1.1. Market Value Share Analysis By Application

        10.1.2. Y-o-Y Growth Analysis By Application

    10.2. Historical Market Size and Volume Analysis By Application 2017 to 2021

    10.3. Market Size and Volume Forecast By Application 2022 to 2032

        10.3.1. Absorbent

        10.3.2. Thickener

        10.3.3. Oral Care

        10.3.4. Carrier & Formulator

        10.3.5. Anti-inflammatory Agent

        10.3.6. Wettable Powder, Water Dispersible Granule & Suspension Concentrate

        10.3.7. Others

    10.4. Market Attractiveness Analysis By Application

11. Asia Pacific Market Analysis 2017 to 2021 and Forecast 2022 to 2032, By End-Use

    11.1. Introduction

        11.1.1. Market Value Share Analysis By End-Use

        11.1.2. Y-o-Y Growth Analysis By End-Use

    11.2. Historical Market Size and Volume Analysis By End-Use 2017 to 2021

    11.3. Market Size and Volume Forecast By End-Use 2022 to 2032

        11.3.1. Pharma

            11.3.1.1. OTC Lotion

            11.3.1.2. Oral Care

            11.3.1.3. Medicine

        11.3.2. Crop Protection

            11.3.2.1. Soil Treatment

            11.3.2.2. Agrochemicals

        11.3.3. Animal Care

            11.3.3.1. Pet Care

            11.3.3.2. Animal Feed

        11.3.4. Personal Care

            11.3.4.1. Hair Care

            11.3.4.2. Skin Care

            11.3.4.3. Body Care

            11.3.4.4. Others

        11.3.5. Ceramics

    11.4. Market Attractiveness Analysis By End-Use

12. Asia Pacific Market Analysis 2017 to 2021 and Forecast 2022 to 2032, By Country

    12.1. Introduction

        12.1.1. Market Value Share Analysis By Country

        12.1.2. Y-o-Y Growth Analysis By Country

    12.2. Historical Market Size and Volume Analysis By Country 2017 to 2021

    12.3. Market Size and Volume Forecast By Country 2022 to 2032

        12.3.1. China

        12.3.2. Japan

        12.3.3. India

        12.3.4. Indonesia

        12.3.5. Malaysia

        12.3.6. Thailand

        12.3.7. Vietnam

        12.3.8. South Korea

        12.3.9. Rest of Asia Pacific

    12.4. Market Attractiveness Analysis By Country

13. China Market Analysis 2017 to 2021 and Forecast 2022 to 2032

    13.1. Introduction

    13.2. Pricing Analysis

    13.3. Historical Market Size and Volume Analysis By Market Segments, 2017 to 2021

    13.4. Market Size and Volume Forecast By Market Segments, 2022 to 2032

        13.4.1. By Product Type

        13.4.2. By Application

        13.4.3. By End-Use

    13.5. Market Attractiveness Analysis

        13.5.1. By Product Type

        13.5.2. By Application

        13.5.3. By End-Use

    13.6. Market Trends

14. Japan Market Analysis 2017 to 2021 and Forecast 2022 to 2032

    14.1. Introduction

    14.2. Pricing Analysis

    14.3. Historical Market Size and Volume Analysis By Market Segments, 2017 to 2021

    14.4. Market Size and Volume Forecast By Market Segments, 2022 to 2032

        14.4.1. By Product Type

        14.4.2. By Application

        14.4.3. By End-Use

    14.5. Market Attractiveness Analysis

        14.5.1. By Product Type

        14.5.2. By Application

        14.5.3. By End-Use

    14.6. Market Trends

15. India Market Analysis 2017 to 2021 and Forecast 2022 to 2032

    15.1. Introduction

    15.2. Pricing Analysis

    15.3. Historical Market Size and Volume Analysis By Market Segments, 2017 to 2021

    15.4. Market Size and Volume Forecast By Market Segments, 2022 to 2032

        15.4.1. By Product Type

        15.4.2. By Application

        15.4.3. By End-Use

    15.5. Market Attractiveness Analysis

        15.5.1. By Product Type

        15.5.2. By Application

        15.5.3. By End-Use

    15.6. Market Trends

16. Indonesia Market Analysis 2017 to 2021 and Forecast 2022 to 2032

    16.1. Introduction

    16.2. Pricing Analysis

    16.3. Historical Market Size and Volume Analysis By Market Segments, 2017 to 2021

    16.4. Market Size and Volume Forecast By Market Segments, 2022 to 2032

        16.4.1. By Product Type

        16.4.2. By Application

        16.4.3. By End-Use

    16.5. Market Attractiveness Analysis

        16.5.1. By Product Type

        16.5.2. By Application

        16.5.3. By End-Use

    16.6. Market Trends

17. Malaysia Market Analysis 2017 to 2021 and Forecast 2022 to 2032

    17.1. Introduction

    17.2. Pricing Analysis

    17.3. Historical Market Size and Volume Analysis By Market Segments, 2017 to 2021

    17.4. Market Size and Volume Forecast By Market Segments, 2022 to 2032

        17.4.1. By Product Type

        17.4.2. By Application

        17.4.3. By End-Use

    17.5. Market Attractiveness Analysis

        17.5.1. By Product Type

        17.5.2. By Application

        17.5.3. By End-Use

    17.6. Market Trends

18. Thailand Market Analysis 2017 to 2021 and Forecast 2022 to 2032

    18.1. Introduction

    18.2. Pricing Analysis

    18.3. Historical Market Size and Volume Analysis By Market Segments, 2017 to 2021

    18.4. Market Size and Volume Forecast By Market Segments, 2022 to 2032

        18.4.1. By Product Type

        18.4.2. By Application

        18.4.3. By End-Use

    18.5. Market Attractiveness Analysis

        18.5.1. By Product Type

        18.5.2. By Application

        18.5.3. By End-Use

    18.6. Market Trends

19. Vietnam Market Analysis 2017 to 2021 and Forecast 2022 to 2032

    19.1. Introduction

    19.2. Pricing Analysis

    19.3. Historical Market Size and Volume Analysis By Market Segments, 2017 to 2021

    19.4. Market Size and Volume Forecast By Market Segments, 2022 to 2032

        19.4.1. By Product Type

        19.4.2. By Application

        19.4.3. By End-Use

    19.5. Market Attractiveness Analysis

        19.5.1. By Product Type

        19.5.2. By Application

        19.5.3. By End-Use

    19.6. Market Trends

20. South Korea Market Analysis 2017 to 2021 and Forecast 2022 to 2032

    20.1. Introduction

    20.2. Pricing Analysis

    20.3. Historical Market Size and Volume Analysis By Market Segments, 2017 to 2021

    20.4. Market Size and Volume Forecast By Market Segments, 2022 to 2032

        20.4.1. By Product Type

        20.4.2. By Application

        20.4.3. By End-Use

    20.5. Market Attractiveness Analysis

        20.5.1. By Product Type

        20.5.2. By Application

        20.5.3. By End-Use

    20.6. Market Trends

21. Rest of Asia Pacific Market Analysis 2017 to 2021 and Forecast 2022 to 2032

    21.1. Introduction

    21.2. Pricing Analysis

    21.3. Historical Market Size and Volume Analysis By Market Segments, 2017 to 2021

    21.4. Market Size and Volume Forecast By Market Segments, 2022 to 2032

        21.4.1. By Product Type

        21.4.2. By Application

        21.4.3. By End-Use

    21.5. Market Attractiveness Analysis

        21.5.1. By Product Type

        21.5.2. By Application

        21.5.3. By End-Use

    21.6. Market Trends

22. Market Structure Analysis

    22.1. Market Analysis by Tier of Companies (Bentonite)

    22.2. Market Concentration

    22.3. Market Share Analysis of Top Players

    22.4. Market Presence Analysis

        22.4.1. By Regional Footprint of Players

        22.4.2. Product foot print by Players

23. Competition Analysis

    23.1. Competition Dashboard

    23.2. Competition Benchmarking

    23.3. Competition Deep Dive

        23.3.1. Ashapura Group

            23.3.1.1. Overview

            23.3.1.2. Product Portfolio

            23.3.1.3. Profitability by Market Segments (Product/Channel/Region)

            23.3.1.4. Sales Footprint

            23.3.1.5. Strategy Overview

        23.3.2. ARUMPO PTY LTD

            23.3.2.1. Overview

            23.3.2.2. Product Portfolio

            23.3.2.3. Profitability by Market Segments (Product/Channel/Region)

            23.3.2.4. Sales Footprint

            23.3.2.5. Strategy Overview

        23.3.3. Laxmi Minerals

            23.3.3.1. Overview

            23.3.3.2. Product Portfolio

            23.3.3.3. Profitability by Market Segments (Product/Channel/Region)

            23.3.3.4. Sales Footprint

            23.3.3.5. Strategy Overview

        23.3.4. ORGANIC INDUSTRIES PVT LTD

            23.3.4.1. Overview

            23.3.4.2. Product Portfolio

            23.3.4.3. Profitability by Market Segments (Product/Channel/Region)

            23.3.4.4. Sales Footprint

            23.3.4.5. Strategy Overview

        23.3.5. Indobent

            23.3.5.1. Overview

            23.3.5.2. Product Portfolio

            23.3.5.3. Profitability by Market Segments (Product/Channel/Region)

            23.3.5.4. Sales Footprint

            23.3.5.5. Strategy Overview

        23.3.6. WYO-BEN, INC.

            23.3.6.1. Overview

            23.3.6.2. Product Portfolio

            23.3.6.3. Profitability by Market Segments (Product/Channel/Region)

            23.3.6.4. Sales Footprint

            23.3.6.5. Strategy Overview

        23.3.7. Volclay Japan Co., Ltd.

            23.3.7.1. Overview

            23.3.7.2. Product Portfolio

            23.3.7.3. Profitability by Market Segments (Product/Channel/Region)

            23.3.7.4. Sales Footprint

            23.3.7.5. Strategy Overview

        23.3.8. KUNIMINE INDUSTRIES CO., LTD

            23.3.8.1. Overview

            23.3.8.2. Product Portfolio

            23.3.8.3. Profitability by Market Segments (Product/Channel/Region)

            23.3.8.4. Sales Footprint

            23.3.8.5. Strategy Overview

        23.3.9. Korea Co., Ltd.

            23.3.9.1. Overview

            23.3.9.2. Product Portfolio

            23.3.9.3. Profitability by Market Segments (Product/Channel/Region)

            23.3.9.4. Sales Footprint

            23.3.9.5. Strategy Overview

        23.3.10. Donghae Material Co., Ltd.

            23.3.10.1. Overview

            23.3.10.2. Product Portfolio

            23.3.10.3. Profitability by Market Segments (Product/Channel/Region)

            23.3.10.4. Sales Footprint

            23.3.10.5. Strategy Overview

        23.3.11. CHUNGKWANG INC.

            23.3.11.1. Overview

            23.3.11.2. Product Portfolio

            23.3.11.3. Profitability by Market Segments (Product/Channel/Region)

            23.3.11.4. Sales Footprint

            23.3.11.5. Strategy Overview

        23.3.12. Shijiazhuang Huabang Mineral Products Co., Ltd

            23.3.12.1. Overview

            23.3.12.2. Product Portfolio

            23.3.12.3. Profitability by Market Segments (Product/Channel/Region)

            23.3.12.4. Sales Footprint

            23.3.12.5. Strategy Overview

        23.3.13. Bentonit Alam Indonesia

            23.3.13.1. Overview

            23.3.13.2. Product Portfolio

            23.3.13.3. Profitability by Market Segments (Product/Channel/Region)

            23.3.13.4. Sales Footprint

            23.3.13.5. Strategy Overview

        23.3.14. Swell Well Minechem Pvt. Ltd.

            23.3.14.1. Overview

            23.3.14.2. Product Portfolio

            23.3.14.3. Profitability by Market Segments (Product/Channel/Region)

            23.3.14.4. Sales Footprint

            23.3.14.5. Strategy Overview

        23.3.15. Manek Group

            23.3.15.1. Overview

            23.3.15.2. Product Portfolio

            23.3.15.3. Profitability by Market Segments (Product/Channel/Region)

            23.3.15.4. Sales Footprint

            23.3.15.5. Strategy Overview

        23.3.16. DAE Minerals Co., Ltd

            23.3.16.1. Overview

            23.3.16.2. Product Portfolio

            23.3.16.3. Profitability by Market Segments (Product/Channel/Region)

            23.3.16.4. Sales Footprint

            23.3.16.5. Strategy Overview

24. Assumptions and Acronyms Used

25. Research Methodology

Don't pay for what you don't need

Customize your report by selecting specific countries or regions and save 30%!

List of Tables

Table 01: Asia Pacific Market Size Volume (Tons) and Value (US$ Thousand) Forecast By Product Type, 2017 to 2032

Table 02: Asia Pacific Market Size Volume (Tons) and Value (US$ Thousand) Forecast By Application, 2017 to 2032

Table 03: Asia Pacific Market Size Volume (Tons) Forecast By End Use, 2017 to 2032

Table 04: Asia Pacific Market Size Value (US$ Thousand) Forecast By End Use, 2017 to 2032

Table 05: Asia Pacific Market Size Volume (Tons) and Value (US$ Thousand) Forecast By Country, 2017 to 2032

Table 06: China Market Size Volume (Tons) and Value (US$ Thousand) Forecast By Product Type, 2017 to 2032

Table 07: China Market Size Volume (Tons) and Value (US$ Thousand) Forecast By Application, 2017 to 2032

Table 08: China Market Size Volume (Tons) Forecast By End Use, 2017 to 2032

Table 09: China Market Size Value (US$ Thousand) Forecast By End Use, 2017 to 2032

Table 10: India Market Size Volume (Tons) and Value (US$ Thousand) Forecast By Product Type, 2017 to 2032

Table 11: India Market Size Volume (Tons) and Value (US$ Thousand) Forecast By Application, 2017 to 2032

Table 12: India Market Size Volume (Tons) Forecast By End Use, 2017 to 2032

Table 13: India Market Size Value (US$ Thousand) Forecast By End Use, 2017 to 2032

Table 14: Japan Market Size Volume (Tons) and Value (US$ Thousand) Forecast By Product Type, 2017 to 2032

Table 15: Japan Market Size Volume (Tons) and Value (US$ Thousand) Forecast By Application, 2017 to 2032

Table 16: Japan Market Size Volume (Tons) Forecast By End Use, 2017 to 2032

Table 17: Japan Market Size Value (US$ Thousand) Forecast By End Use, 2017 to 2032

Table 18: Indonesia Market Size Volume (Tons) and Value (US$ Thousand) Forecast By Product Type, 2017 to 2032

Table 19: Indonesia Market Size Volume (Tons) and Value (US$ Thousand) Forecast By Application, 2017 to 2032

Table 20: Indonesia Market Size Volume (Tons) Forecast By End Use, 2017 to 2032

Table 21: Indonesia Market Size Value (US$ Thousand) Forecast By End Use, 2017 to 2032

Table 22: Malaysia Market Size Volume (Tons) and Value (US$ Thousand) Forecast By Product Type, 2017 to 2032

Table 23: Malaysia Market Size Volume (Tons) and Value (US$ Thousand) Forecast By Application, 2017 to 2032

Table 24: Malaysia Market Size Volume (Tons) Forecast By End Use, 2017 to 2032

Table 25: Malaysia Market Size (US$ Thousand) Forecast By End Use, 2017 to 2032

Table 26: Thousandailand Market Size Volume (Tons) and Value (US$ Thousand) Forecast By Product Type, 2017 to 2032

Table 27: Thousandailand Market Size Volume (Tons) and Value (US$ Thousand) Forecast By Application, 2017 to 2032

Table 28: Thousandailand Market Size Volume (Tons) Forecast By End Use, 2017 to 2032

Table 29: Thousandailand Market Size Value (US$ Thousand) Forecast By End Use, 2017 to 2032

Table 30: Vietnam Market Size Volume (Tons) and Value (US$ Thousand) Forecast By Product Type, 2017 to 2032

Table 31: Vietnam Market Size Volume (Tons) and Value (US$ Thousand) Forecast By Application, 2017 to 2032

Table 32: Vietnam Market Size Volume (Tons) Forecast By End Use, 2017 to 2032

Table 33: Vietnam Market Size Value (US$ Thousand) Forecast By End Use, 2017 to 2032

Table 34: SouThousand Korea Market Size Volume (Tons) and Value (US$ Thousand) Forecast By Product Type, 2017 to 2032

Table 35: SouThousand Korea Market Size Volume (Tons) and Value (US$ Thousand) Forecast By Application, 2017 to 2032

Table 36: SouThousand Korea Market Size Volume (Tons) Forecast By End Use, 2017 to 2032

Table 37: SouThousand Korea Market Size Value (US$ Thousand) Forecast By End Use, 2017 to 2032

Table 38: Rest of APAC Market Size Volume (Tons) and Value (US$ Thousand) Forecast By Product Type, 2017 to 2032

Table 39: Rest of APAC Market Size Volume (Tons) and Value (US$ Thousand) Forecast By Application, 2017 to 2032

Table 40: Rest of APAC Market Size Volume (Tons) Forecast By End Use, 2017 to 2032

Table 41: Rest of APAC Market Size Value (US$ Thousand) Forecast By End Use, 2017 to 2032
Nikhil Kaitwade
Nikhil Kaitwade

Principal Consultant

Talk to Analyst

Find your sweet spots for generating winning opportunities in this market.

List of Charts

Figure 01: Market Historical Volume (Tons), 2017 to 2021

Figure 02: Market Current and Forecast Volume (Tons), 2022 to 2032

Figure 03: Market Historical Value (US$ Thousand), 2017 to 2021

Figure 04: Market Current and Forecast Value (US$ Thousand), 2022 to 2032

Figure 05: Market Incremental $ Opportunity (US$ Thousand), 2022 to 2032

Figure 06: Market Share and BPS Analysis By Product Type– 2022 to 2032

Figure 07: Market Y-o-Y GrowThousand Projections By Product Type, 2022 to 2032

Figure 08: Market Attractiveness Analysis By Product Type, 2022 to 2032

Figure 09: Market Absolute $ Opportunity by Sodium Segment, 2017 to 2032

Figure 10: Market Absolute $ Opportunity by Calcium Segment, 2017 to 2032

Figure 11: Market Absolute $ Opportunity by Aluminum Segment, 2017 to 2032

Figure 12: Market Absolute $ Opportunity by OThousanders Segment, 2017 to 2032

Figure 13: Market Share and BPS Analysis By Application– 2022 to 2032

Figure 14: Market Y-o-Y GrowThousand Projections By Application, 2022 to 2032

Figure 15: Market Attractiveness Analysis By Application, 2022 to 2032

Figure 16: Market Absolute $ Opportunity by Absorbent Segment, 2017 to 2032

Figure 17: Market Absolute $ Opportunity by Thousandickener Segment, 2017 to 2032

Figure 18: Market Absolute $ Opportunity by Oral Care Segment, 2017 to 2032

Figure 19: Market Absolute $ Opportunity by Carrier/Formulator Segment, 2017 to 2032

Figure 20: Market Absolute $ Opportunity by Anti-Inflammatory Agent Segment, 2017 to 2032

Figure 21: Market Absolute $ Opportunity by WP, WDG, SC Segment, 2017 to 2032

Figure 22: Market Absolute $ Opportunity by OThousanders Segment, 2017 to 2032

Figure 23: Market Share and BPS Analysis By End Use– 2022 to 2032

Figure 24: Market Y-o-Y GrowThousand Projections By End Use, 2022 to 2032

Figure 25: Market Attractiveness Analysis By End Use, 2022 to 2032

Figure 26: Market Absolute $ Opportunity by Pharmaceuticals Segment, 2017 to 2032

Figure 27: Market Absolute $ Opportunity by Crop Protection Segment, 2017 to 2032

Figure 28: Market Absolute $ Opportunity by Animal Care Segment, 2017 to 2032

Figure 29: Market Absolute $ Opportunity by Personal Care Segment, 2017 to 2032

Figure 30: Market Absolute $ Opportunity by Ceramics Segment, 2017 to 2032

Figure 31: Market Share and BPS Analysis By Country– 2022 to 2032

Figure 32: Market Y-o-Y GrowThousand Projections By Country, 2022 to 2032

Figure 33: Market Attractiveness Analysis By Country, 2022 to 2032

Figure 34: Market Absolute $ Opportunity by China Segment, 2017 to 2032

Figure 35: Market Absolute $ Opportunity by India Segment, 2017 to 2032

Figure 36: Market Absolute $ Opportunity by Japan Segment, 2017 to 2032

Figure 37: Market Absolute $ Opportunity by Indonesia Segment, 2017 to 2032

Figure 38: Market Absolute $ Opportunity by Malaysia Segment, 2017 to 2032

Figure 39: Market Absolute $ Opportunity by Thousandailand Segment, 2017 to 2032

Figure 40: Market Absolute $ Opportunity by Vietnam Segment, 2017 to 2032

Figure 41: Market Absolute $ Opportunity by SouThousand Korea Segment, 2017 to 2032

Figure 42: Market Absolute $ Opportunity by Rest of Asia Pacific Segment, 2017 to 2032

Figure 43: China Market Share and BPS Analysis By Product Type– 2022 to 2032

Figure 44: China Market Y-o-Y GrowThousand Projections By Product Type, 2022 to 2032

Figure 45: China Market Attractiveness Analysis By Product Type, 2022 to 2032

Figure 46: China Market Share and BPS Analysis By Application– 2022 to 2032

Figure 47: China Market Y-o-Y GrowThousand Projections By Application, 2022 to 2032

Figure 48: China Market Attractiveness Analysis By Application, 2022 to 2032

Figure 49: China Market Share and BPS Analysis By End Use– 2022 to 2032

Figure 50: China Market Y-o-Y GrowThousand Projections By End Use, 2022 to 2032

Figure 51: China Market Attractiveness Analysis By End Use, 2022 to 2032

Figure 52: India Market Share and BPS Analysis By Product Type– 2022 to 2032

Figure 53: India Market Y-o-Y GrowThousand Projections By Product Type, 2022 to 2032

Figure 54: India Market Attractiveness Analysis By Product Type, 2022 to 2032

Figure 55: India Market Share and BPS Analysis By Application– 2022 to 2032

Figure 56: India Market Y-o-Y GrowThousand Projections By Application, 2022 to 2032

Figure 57: India Market Attractiveness Analysis By Application, 2022 to 2032

Figure 58: India Market Share and BPS Analysis By End Use– 2022 to 2032

Figure 59: India Market Y-o-Y GrowThousand Projections By End Use, 2022 to 2032

Figure 60: India Market Attractiveness Analysis By End Use, 2022 to 2032

Figure 61: Japan Market Share and BPS Analysis By Product Type– 2022 to 2032

Figure 62: Japan Market Y-o-Y GrowThousand Projections By Product Type, 2022 to 2032

Figure 63: Japan Market Attractiveness Analysis By Product Type, 2022 to 2032

Figure 64: Japan Market Share and BPS Analysis By Application– 2022 to 2032

Figure 65: Japan Market Y-o-Y GrowThousand Projections By Application, 2022 to 2032

Figure 66: Japan Market Attractiveness Analysis By Application, 2022 to 2032

Figure 67: Japan Market Share and BPS Analysis By End Use– 2022 to 2032

Figure 68: Japan Market Y-o-Y GrowThousand Projections By End Use, 2022 to 2032

Figure 69: Japan Market Attractiveness Analysis By End Use, 2022 to 2032

Figure 70: Indonesia Market Share and BPS Analysis By Product Type– 2022 to 2032

Figure 71: Indonesia Market Y-o-Y GrowThousand Projections By Product Type, 2022 to 2032

Figure 72: Indonesia Market Attractiveness Analysis By Product Type, 2022 to 2032

Figure 73: Indonesia Market Share and BPS Analysis By Application– 2022 to 2032

Figure 74: Indonesia Market Y-o-Y GrowThousand Projections By Application, 2022 to 2032

Figure 75: Indonesia Market Attractiveness Analysis By Application, 2022 to 2032

Figure 76: Indonesia Market Share and BPS Analysis By End Use– 2022 to 2032

Figure 77: Indonesia Market Y-o-Y GrowThousand Projections By End Use, 2022 to 2032

Figure 78: Indonesia Market Attractiveness Analysis By End Use, 2022 to 2032

Figure 79: Malaysia Market Share and BPS Analysis By Product Type– 2022 to 2032

Figure 80: Malaysia Market Y-o-Y GrowThousand Projections By Product Type, 2022 to 2032

Figure 81: Malaysia Market Attractiveness Analysis By Product Type, 2022 to 2032

Figure 82: Malaysia Market Share and BPS Analysis By Application– 2022 to 2032

Figure 83: Malaysia Market Y-o-Y GrowThousand Projections By Application, 2022 to 2032

Figure 84: Malaysia Market Attractiveness Analysis By Application, 2022 to 2032

Figure 85: Malaysia Market Share and BPS Analysis By End Use– 2022 to 2032

Figure 86: Malaysia Market Y-o-Y GrowThousand Projections By End Use, 2022 to 2032

Figure 87: Malaysia Market Attractiveness Analysis By End Use, 2022 to 2032

Figure 88: Thousandailand Market Share and BPS Analysis By Product Type– 2022 to 2032

Figure 89: Thousandailand Market Y-o-Y GrowThousand Projections By Product Type, 2022 to 2032

Figure 90: Thousandailand Market Attractiveness Analysis By Product Type, 2022 to 2032

Figure 91: Thousandailand Market Share and BPS Analysis By Application– 2022 to 2032

Figure 92: Thousandailand Market Y-o-Y GrowThousand Projections By Application, 2022 to 2032

Figure 93: Thousandailand Market Attractiveness Analysis By Application, 2022 to 2032

Figure 94: Thousandailand Market Share and BPS Analysis By End Use– 2022 to 2032

Figure 95: Thousandailand Market Y-o-Y GrowThousand Projections By End Use, 2022 to 2032

Figure 96: Thousandailand Market Attractiveness Analysis By End Use, 2022 to 2032

Figure 97: Vietnam Market Share and BPS Analysis By Product Type– 2022 to 2032

Figure 98: Vietnam Market Y-o-Y GrowThousand Projections By Product Type, 2022 to 2032

Figure 99: Vietnam Market Attractiveness Analysis By Product Type, 2022 to 2032

Figure 100: Vietnam Market Share and BPS Analysis By Application– 2022 to 2032

Figure 101: Vietnam Market Y-o-Y GrowThousand Projections By Application, 2022 to 2032

Figure 102: Vietnam Market Attractiveness Analysis By Application, 2022 to 2032

Figure 103: Vietnam Market Share and BPS Analysis By End Use– 2022 to 2032

Figure 104: Vietnam Market Y-o-Y GrowThousand Projections By End Use, 2022 to 2032

Figure 105: Vietnam Market Attractiveness Analysis By End Use, 2022 to 2032

Figure 106: SouThousand Korea Market Share and BPS Analysis By Product Type– 2022 to 2032

Figure 107: SouThousand Korea Market Y-o-Y GrowThousand Projections By Product Type, 2022 to 2032

Figure 108: SouThousand Korea Market Attractiveness Analysis By Product Type, 2022 to 2032

Figure 109: SouThousand Korea Market Share and BPS Analysis By Application– 2022 to 2032

Figure 110: SouThousand Korea Market Y-o-Y GrowThousand Projections By Application, 2022 to 2032

Figure 111: SouThousand Korea Market Attractiveness Analysis By Application, 2022 to 2032

Figure 112: SouThousand Korea Market Share and BPS Analysis By End Use– 2022 to 2032

Figure 113: SouThousand Korea Market Y-o-Y GrowThousand Projections By End Use, 2022 to 2032

Figure 114: SouThousand Korea Market Attractiveness Analysis By End Use, 2022 to 2032

Figure 115: Rest of APAC Market Share and BPS Analysis By Product Type– 2022 to 2032

Figure 116: Rest of APAC Market Y-o-Y GrowThousand Projections By Product Type, 2022 to 2032

Figure 117: Rest of APAC Market Attractiveness Analysis By Product Type, 2022 to 2032

Figure 118: Rest of APAC Market Share and BPS Analysis By Application– 2022 to 2032

Figure 119: Rest of APAC Market Y-o-Y GrowThousand Projections By Application, 2022 to 2032

Figure 120: Rest of APAC Market Attractiveness Analysis By Application, 2022 to 2032

Figure 121: Rest of APAC Market Share and BPS Analysis By End Use– 2022 to 2032

Figure 122: Rest of APAC Market Y-o-Y GrowThousand Projections By End Use, 2022 to 2032

Figure 123: Rest of APAC Market Attractiveness Analysis By End Use, 2022 to 2032

Recommendations

Chemicals & Materials

Sulphur Bentonite Market

Published : July 2023

Chemicals & Materials

Bentonite Market

Published : June 2023

Chemicals & Materials

Organo-modified Bentonite Market

Published : February 2023

Explore Chemicals & Materials Insights

View Reports

Asia Pacific Bentonite Market