

- Market Size (2026)
- USD 435.6 Mn
- Forecast (2036)
- USD 1150.6 Mn
- CAGR (2026 to 2036)
- 10.2%
How big is GPU Fabric Fault Isolation Software Market in 2026?
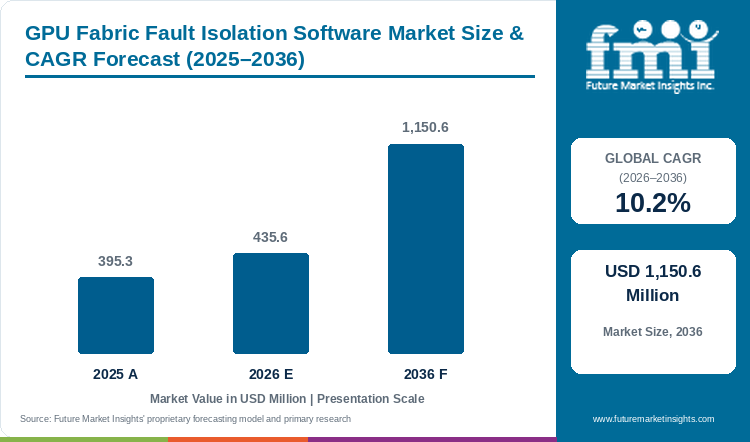
The market was valued at USD 395.3 Million in 2025 and is expected to reach USD 435.6 Million in 2026, with growth at a 10.2% CAGR from 2026 to 2036 taking its value to USD 1,150.6 Million by 2036.
Distributed work can lose progress through a degraded communication path without a simple server outage, so operators need to relate the symptom to the topology before deciding what to isolate. The first visible alarm may follow an earlier event, making time alignment and an accurate equipment map necessary for distinguishing a link defect from congestion or an application problem. A useful product narrows the investigation and preserves evidence for a measured response, reducing disruption from unnecessary restarts or the removal of healthy equipment. It also needs to fit existing incident procedures and access controls, with some customers centralizing analysis while others keep sensitive topology in a private environment. The purchase is therefore an improvement in diagnosis and restoration within an authorized workflow. The forecast covers qualifying fabric-fault software and excludes physical network equipment, accelerators and general observability products lacking the defined function. [5]
Key Market Trends & Insights
- Monitoring & telemetry holds 27.0% of platform function in 2026, associating observations with identifiable ports, switches, accelerators and the jobs experiencing a fault.
- SaaS / public cloud holds 38.0% of deployment model in 2026, offering multi-site teams a common incident record while topology access remains governed by permission.
- 251–500 kW holds 32.0% of AI rack density in 2026, where electrical or cooling events can coincide with communication degradation across nearby resources.
- Hyperscale AI data centers account for 46.0% of data center type in 2026, with distributed work exposing the effect of a local fault across otherwise healthy accelerators.
Regional Highlights
- South Korea has the highest profiled CAGR at 11.7% during 2026–2036.
- The next two profiled growth rates are France at 11.4% and UAE at 11.0% over the same period.
Market Size & Forecast
| Metric | Value |
|---|---|
| 2025 market value | USD 395.3 Million |
| 2026 market estimate | USD 435.6 Million |
| 2036 market forecast | USD 1,150.6 Million |
| Forecast CAGR, 2026–2036 | 10.2% |
The market covers software that monitors, correlates and isolates faults in GPU fabrics. Physical network equipment, accelerators and general observability products without the qualifying fabric-fault function are excluded.
Fabric faults can reduce the productive value of data-center power by leaving powered compute resources waiting on failed or degraded communication.
Infrastructure readiness and acceptance
| Documented operating context | Source |
|---|---|
| NVIDIA documents an API for identifying unhealthy devices in its UFM fabric-management environment. | [1] |
| NVIDIA described Mission Control’s AI-factory provisioning, telemetry and recovery functions in March 2025. | [2] |
| NVIDIA’s DCGM documentation describes GPU diagnostic tests and their operational requirements. | [3] |
| VIAVI introduced an 800G transport module for the OneAdvisor 800 field tester in March 2025. | [4] |
Analyst Perspective
Fault isolation should narrow the path to an authorized repair while retaining evidence for the suspected cause. Accurate topology and time-aligned events help teams avoid removing healthy equipment, with incident context remaining useful when a fault returns or responsibility passes between the network supplier and platform operator.
- Sudip Saha, Principal Analyst at Future Market Insights
How is the GPU fabric fault isolation software market segmented?
Platform Function covers Monitoring & telemetry, Planning & simulation, Optimization & control, Fault / reliability analytics and Reporting & governance. Deployment Model covers SaaS / public cloud, Private cloud, On-premise and Hybrid deployment. AI Rack Density covers 251–500 kW, 100–250 kW, Below 100 kW and Above 500 kW. Data Center Type covers Hyperscale AI data centers, Colocation AI facilities, Enterprise private AI and HPC & research centers. Commercial Model covers Direct enterprise contract, System integrator / EPC-led, Subscription / license and Managed-service contract.
Connecting diagnosis to data-center infrastructure management helps preserve the physical context needed when an incident moves between network and facilities teams.
Why does Monitoring & telemetry lead platform function demand?
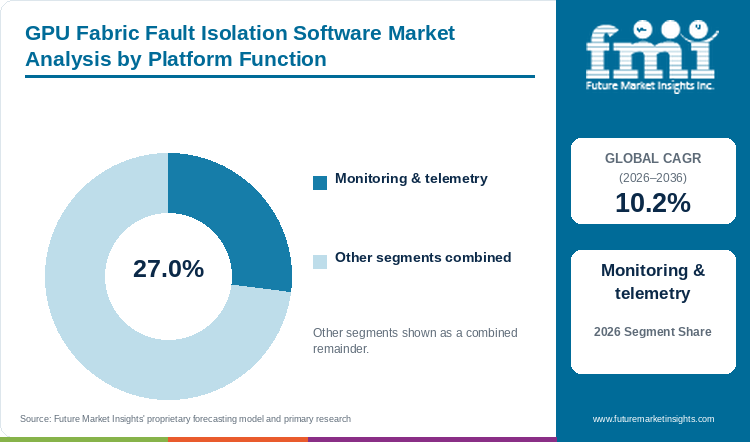
Monitoring & telemetry: 27.0% of platform function in 2026.
Port errors become actionable when they can be associated with switch state, the actual communication path and the affected job. Preserving the event sequence helps distinguish an initiating failure from downstream alarms, while accurate topology and workload records give counters a useful context. Buyers need that relationship to separate congestion from a physical defect, since collecting additional observations offers limited diagnostic value when identifiers or timing remain inconsistent across vendors.
- The Monitoring & telemetry segment accounts for 27.0% of platform function in 2026.
- Time-aligned records help operators distinguish the event that initiated a failure from alarms produced by its downstream effects.
Why does SaaS / public cloud lead deployment model demand?
SaaS / public cloud: 38.0% of deployment model in 2026.
Hosted analysis can give multi-site teams a shared incident history and common reporting, while detailed fabric records create questions about where topology may be stored and who may act on it. Customers need to distinguish permission to analyze from authority to change the live network or isolate a device. Private and hybrid arrangements remain relevant where those permissions are restricted, allowing access to useful evidence without extending operational control beyond the owner’s intent.
- The SaaS / public cloud segment accounts for 38.0% of deployment model in 2026.
- Contracts should separate permission to analyze fabric records from permission to isolate a component or change a live network.
What are the drivers, restraints, and opportunities in the GPU fabric fault isolation software market?
Distributed training makes fabric faults expensive
A distributed training job depends on communication across several devices. A localized fabric problem can therefore affect far more work than the failed component suggests. Operators need to identify the affected path without taking healthy resources out of service. Software that connects network evidence with job progress can reduce the scope of that investigation. The relevant benefit is a more precise next action rather than an increase in alert coverage. Evidence retained during the incident also helps determine whether the same fault has returned after an apparent repair.
Symptoms cross software, optical and switching boundaries
Vendor differences in counters and control privileges combine with inconsistent host and facility timestamps to make similar symptoms difficult to compare. A proof of concept using known failures and ordinary traffic can test the diagnostic method, with collectors approved for the topology or controls they access. The buyer then needs an understandable distinction between measured symptoms and the inferred cause before authorizing automation.
Topology-aware correlation can shorten fault isolation
Connecting port events with asset identity, the affected job and the repair ticket makes evidence useful within the maintenance process. A maintained equipment map can survive changes in diagnostic tools and support investigation when incidents recur, reducing the need to reconstruct the route each time. The workflow should preserve a justified next action, since an anomaly does not always require removal of a device.
Testing within AI infrastructure commissioning can provide a known-good fabric baseline against which later fault symptoms are compared.
Which country and market CAGRs are profiled for GPU fabric fault isolation software?
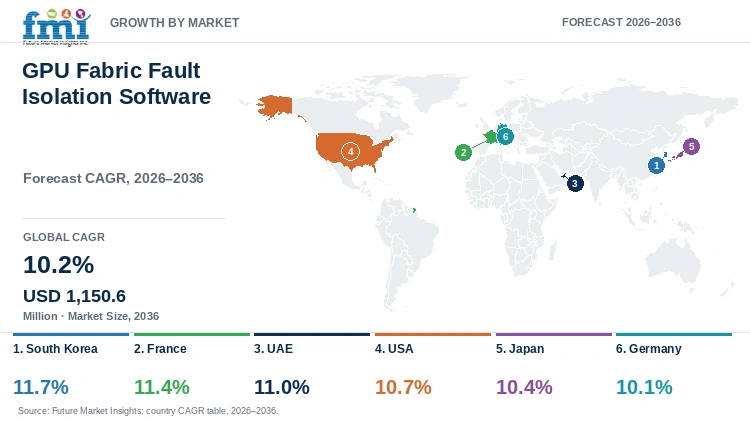
| Country | CAGR |
|---|---|
| South Korea | 11.7% |
| France | 11.4% |
| UAE | 11.0% |
| USA | 10.7% |
| Japan | 10.4% |
| Germany | 10.1% |
Country-wise Analysis
South Korea
- Shared South Korean accelerator environments can require formal software qualification and a clear connection between health evidence and service-provider procedures. The fastest profiled forecast is an 11.7% CAGR from 2026 to 2036, although an equipment award still needs an operating fabric before it creates diagnostic deployment. Once in use, the product must distinguish a defective path from traffic pressure or workload behavior before teams authorize disruptive action.
France
- Several institutions may share a French HPC interconnect, requiring a diagnostic record that relates faults to affected work without exposing another tenant’s details. Evidence ownership and escalation therefore accompany the market’s 11.4% CAGR forecast for 2026 to 2036. Buyers also need to see restored application progress, because a port counter returning to normal does not establish that the workload or original cause has recovered.
UAE
- Deployment location and access control can determine selection in UAE sovereign-cloud environments, where the supplier needs a workable analysis method within approved record boundaries. Retaining incident history across vendors helps when an intermittent fault returns after an apparent repair. The UAE is forecast to grow at an 11.0% CAGR from 2026 to 2036, with support continuity reducing the need to reconstruct evidence at each handoff.
USA
- American operators may already maintain separate inventory and GPU diagnostic systems, so a new product needs to reconcile those records within fleet change control and cybersecurity review. The USA’s 10.7% CAGR forecast for 2026 to 2036 accompanies demand for realistic failure trials that preserve topology and timing. A justified next step must distinguish a fabric defect from a host problem before intervention is authorized.
Japan
- Japanese shared-compute users need reproducible evidence when a slowdown could originate in either the platform or application, making trials across workloads useful for comparison. Local operators and remote suppliers also benefit from retained context when an intermittent event cannot easily be recreated. Japan’s forecast is a 10.4% CAGR from 2026 to 2036, with the affected path identified before maintenance makes a disruptive change.
Germany
- A German incident may cross several equipment suppliers, requiring switch evidence to be reconstructed alongside scheduler and host records. The market’s 10.1% CAGR forecast for 2026 to 2036 sits within established research and enterprise procedures, where measured symptoms need to remain distinguishable from an inferred cause. Controlled access and recorded remedial actions then give the teams responsible a useful basis for intervention.
Who are the notable companies in the GPU fabric fault isolation software market?
NVIDIA; Arista Networks; Hewlett Packard Enterprise; Broadcom; Keysight Technologies
Network suppliers contribute device knowledge, test specialists can reproduce failures and platform vendors can relate the symptoms to job progress. Buyers need those capabilities connected within an incident workflow when the fault crosses equipment and software boundaries. A clear evidence handoff lets each team contribute without treating one source of information as a complete substitute for the others.
Competitive Benchmarking: GPU Fabric Fault Isolation Software Market
| Participant | Commercial focus | Buyer qualification priority |
|---|---|---|
| NVIDIA | GPU fabric management and telemetry | Topology-aware fault correlation |
| Arista Networks | Data-center network visibility | Port, flow and congestion diagnosis |
| Hewlett Packard Enterprise | AI and data-center networking | Fabric integration and support escalation |
| Broadcom | Networking platforms and telemetry | Hardware counters and diagnostic access |
| Keysight Technologies | Network test and validation | Repeatable reproduction of failure conditions |
Key Developments in the GPU Fabric Fault Isolation Software Market
- NVIDIA documents an API for identifying unhealthy devices in its UFM fabric-management environment. [1]
- NVIDIA described Mission Control’s AI-factory provisioning, telemetry and recovery functions in March 2025. [2]
Key Players in the GPU Fabric Fault Isolation Software Market
- NVIDIA
- Arista Networks
- Hewlett Packard Enterprise
- Broadcom
- Keysight Technologies
GPU Fabric Fault Isolation Software Market - Report Scope
| Coverage field | Report scope |
|---|---|
| Market breakdown | Platform Function; Deployment Model; AI Rack Density; Data Center Type; Commercial Model; Region |
| Quantitative unit | USD Million |
| Market definition | The market covers software that monitors, correlates and isolates faults in GPU fabrics. Physical network equipment, accelerators and general observability products without the qualifying fabric-fault function are excluded. |
| Regions covered | North America; Latin America; Western Europe; Eastern Europe; East Asia; South Asia and Pacific; Middle East and Africa |
| Countries / markets profiled | South Korea; France; UAE; USA; Japan; Germany |
| Key companies profiled | NVIDIA; Arista Networks; Hewlett Packard Enterprise; Broadcom; Keysight Technologies |
| Base year / forecast period | 2026 / 2026–2036 |
| Estimate coverage | 2025 and 2026 market estimates; 2036 forecast; segment shares and country / market CAGRs. |
GPU Fabric Fault Isolation Software Market - Research Methodology
| Method | Application |
|---|---|
| Market definition | The analysis follows the stated product or service boundary and distinguishes direct category revenue from adjacent activities. |
| Secondary research | Official technical, regulatory, research and company publications provide the documented operating context and recent developments cited in this report. |
| Forecast and segmentation | Market estimates, segment shares and geographic forecasts are presented as analytical estimates within the stated commercial scope. |
| Competitive assessment | Participants are compared by their relevant products or services, commercial role and buyer qualification requirements. |
| Interpretation | The assessment considers purchasing conditions and the scope of the documented product, service or performance claim. |
GPU Fabric Fault Isolation Software Market by Segments
Platform Function
- Monitoring & telemetry
- Planning & simulation
- Optimization & control
- Fault / reliability analytics
- Reporting & governance
Deployment Model
- SaaS / public cloud
- Private cloud
- On-premise
- Hybrid deployment
AI Rack Density
- 251–500 kW
- 100–250 kW
- Below 100 kW
- Above 500 kW
Data Center Type
- Hyperscale AI data centers
- Colocation AI facilities
- Enterprise private AI
- HPC & research centers
Commercial Model
- Direct enterprise contract
- System integrator / EPC-led
- Subscription / license
- Managed-service contract
GPU Fabric Fault Isolation Software Market by Region
- North America
- United States
- Canada
- Latin America
- Brazil
- Mexico
- Argentina
- Chile
- Western Europe
- Germany
- France
- United Kingdom
- Italy
- Spain
- Benelux
- Nordics
- Eastern Europe
- Poland
- Czech Republic
- Romania
- Hungary
- East Asia
- China
- Japan
- South Korea
- South Asia and Pacific
- India
- ASEAN
- Australia and New Zealand
- Middle East and Africa
- GCC Countries
- South Africa
- Türkiye
- Israel
Research Sources and Bibliography
- [1] NVIDIA. (2025, May 28). Unhealthy Devices REST API: UFM Enterprise REST API Guide v6.21.2.
- [2] NVIDIA. (2025, March 25). Automating AI Factories with NVIDIA Mission Control.
- [3] NVIDIA. (n.d.). Data Center GPU Manager User Guide: DCGM Diagnostics.
- [4] VIAVI Solutions. (2025, March 18). VIAVI Adds 800G Module to OneAdvisor 800 Family of Field Testers.
- [5] Future Market Insights. (2026). GPU Fabric Fault Isolation Software Market: Global industry analysis and opportunity assessment, 2026–2036.
This Report Answers
- How large is the GPU fabric fault isolation software market in 2026?
- What value and CAGR are forecast through 2036?
- Which platform function segment leads in 2026?
- Which deployment model segment has the largest share?
- Which profiled country or market has the fastest forecast growth?
- Which participants are covered in the competitive assessment?
Frequently Asked Questions
How large is the GPU fabric fault isolation software market in 2026?
The market was valued at USD 395.3 Million in 2025 and is expected to reach USD 435.6 Million in 2026.
What value and CAGR are forecast through 2036?
The market is projected to reach USD 1,150.6 Million by 2036, with a 10.2% CAGR during 2026–2036.
Which platform function segment leads in 2026?
The Monitoring & telemetry segment accounts for 27.0% of platform function in 2026.
Which deployment model segment has the largest share?
The SaaS / public cloud segment accounts for 38.0% of deployment model in 2026.
Which profiled country or market has the fastest forecast growth?
South Korea has the highest profiled CAGR at 11.7% during 2026–2036.
Which participants are covered in the competitive assessment?
The assessment covers NVIDIA, Arista Networks, Hewlett Packard Enterprise, Broadcom and Keysight Technologies.
Preview the report firsthand - request a free sample
Get SampleGet the brochure for pricing and purchase details.
Get PDFTable of Content
- Key Takeaways
- Market Size and CAGR
- Top Growth Driver
- Fastest Growing Segment
- Leading Region
- Key Companies
- Emerging Opportunities
- Executive Summary
- Global Market Outlook
- Demand-side Trends
- Supply-side Trends
- Technology Roadmap Analysis
- Analysis and Recommendations
- Analyst Perspective (What is happening? Why now? What should investors know?)
- Key Questions Answered
- How large is the market?
- What is the CAGR?
- What are key trends?
- Which region dominates?
- Who are the leaders?
- Market Overview
- Market Coverage / Taxonomy
- Market Definition / Scope / Limitations
- Research Methodology
- Chapter Orientation
- Analytical Lens and Working Hypotheses
- Market Structure, Signals, and Trend Drivers
- Benchmarking and Cross-market Comparability
- Market Sizing, Forecasting, and Opportunity Mapping
- Research Design and Evidence Framework
- Desk Research Programme (Secondary Evidence)
- Expert Input and Fieldwork (Primary Evidence)
- Tooling, Models, and Reference Databases
- Data Engineering and Model Build
- Quality Assurance and Audit Trail
- Market Background
- Market Dynamics (Drivers, Restraints, Opportunity, Trends)
- Scenario Forecast (Optimistic, Likely, Conservative)
- Impact Analysis
- AI Impact
- Sustainability Impact
- Regulatory Impact
- Technology Impact
- Consumer / Buyer Analysis
- Purchase Drivers
- Adoption Barriers
- Buyer Journey
- Opportunity Map Analysis
- Product Life Cycle Analysis
- Supply Chain Analysis
- Investment Feasibility Matrix
- Value Chain Analysis
- PESTLE and Porter's Analysis
- Regulatory Landscape
- Regional Parent Market Outlook
- Production and Consumption Statistics
- Import and Export Statistics
- Global Market Analysis and Forecast, 2021 to 2036
- Historical Market Size Value (USD Million) Analysis, 2021 to 2025
- Current and Future Market Size Value (USD Million) Projections, 2026 to 2036
- Y-o-Y Growth Trend Analysis
- Absolute $ Opportunity Analysis
- Global Market Pricing Analysis, 2021 to 2036
- Global Market Analysis and Forecast, By Platform Function, 2021 to 2036
- Introduction / Key Findings
- Historical Market Size Value (USD Million) Analysis By Platform Function, 2021 to 2025
- Current and Future Market Size Value (USD Million) Analysis and Forecast By Platform Function, 2026 to 2036
- Monitoring & telemetry
- Planning & simulation
- Optimization & control
- Fault / reliability analytics
- Reporting & governance
- Y-o-Y Growth Trend Analysis By Platform Function, 2021 to 2025
- Absolute $ Opportunity Analysis By Platform Function, 2026 to 2036
- Global Market Analysis and Forecast, By Deployment Model, 2021 to 2036
- Introduction / Key Findings
- Historical Market Size Value (USD Million) Analysis By Deployment Model, 2021 to 2025
- Current and Future Market Size Value (USD Million) Analysis and Forecast By Deployment Model, 2026 to 2036
- SaaS / public cloud
- Private cloud
- On-premise
- Hybrid deployment
- Y-o-Y Growth Trend Analysis By Deployment Model, 2021 to 2025
- Absolute $ Opportunity Analysis By Deployment Model, 2026 to 2036
- Global Market Analysis and Forecast, By AI Rack Density, 2021 to 2036
- Introduction / Key Findings
- Historical Market Size Value (USD Million) Analysis By AI Rack Density, 2021 to 2025
- Current and Future Market Size Value (USD Million) Analysis and Forecast By AI Rack Density, 2026 to 2036
- 251–500 kW
- 100–250 kW
- Below 100 kW
- Above 500 kW
- Y-o-Y Growth Trend Analysis By AI Rack Density, 2021 to 2025
- Absolute $ Opportunity Analysis By AI Rack Density, 2026 to 2036
- Global Market Analysis and Forecast, By Data Center Type, 2021 to 2036
- Introduction / Key Findings
- Historical Market Size Value (USD Million) Analysis By Data Center Type, 2021 to 2025
- Current and Future Market Size Value (USD Million) Analysis and Forecast By Data Center Type, 2026 to 2036
- Hyperscale AI data centers
- Colocation AI facilities
- Enterprise private AI
- HPC & research centers
- Y-o-Y Growth Trend Analysis By Data Center Type, 2021 to 2025
- Absolute $ Opportunity Analysis By Data Center Type, 2026 to 2036
- Global Market Analysis and Forecast, By Commercial Model, 2021 to 2036
- Introduction / Key Findings
- Historical Market Size Value (USD Million) Analysis By Commercial Model, 2021 to 2025
- Current and Future Market Size Value (USD Million) Analysis and Forecast By Commercial Model, 2026 to 2036
- Direct enterprise contract
- System integrator / EPC-led
- Subscription / license
- Managed-service contract
- Y-o-Y Growth Trend Analysis By Commercial Model, 2021 to 2025
- Absolute $ Opportunity Analysis By Commercial Model, 2026 to 2036
- Global Market Analysis and Forecast, By Region, 2021 to 2036
- Introduction
- Historical Market Size Value (USD Million) Analysis By Region, 2021 to 2025
- Current Market Size Value (USD Million) Analysis and Forecast By Region, 2026 to 2036
- North America
- Latin America
- Western Europe
- Eastern Europe
- East Asia
- South Asia and Pacific
- Middle East and Africa
- Market Attractiveness Analysis By Region
- North America Market Analysis and Forecast, By Country, 2021 to 2036
- Historical Market Size Value (USD Million) Trend Analysis By Market Taxonomy, 2021 to 2025
- Market Size Value (USD Million) Forecast By Market Taxonomy, 2026 to 2036
- By Country
- United States
- Canada
- By Platform Function
- By Deployment Model
- By AI Rack Density
- By Data Center Type
- By Commercial Model
- By Country
- Market Attractiveness Analysis
- By Country
- By Platform Function
- By Deployment Model
- By AI Rack Density
- By Data Center Type
- By Commercial Model
- Key Takeaways
- Latin America Market Analysis and Forecast, By Country
- Historical Market Size Value (USD Million) Trend Analysis By Market Taxonomy, 2021 to 2025
- Market Size Value (USD Million) Forecast By Market Taxonomy, 2026 to 2036
- By Country
- Brazil
- Mexico
- Argentina
- Chile
- By Platform Function
- By Deployment Model
- By AI Rack Density
- By Data Center Type
- By Commercial Model
- By Country
- Market Attractiveness Analysis
- By Country
- By Platform Function
- By Deployment Model
- By AI Rack Density
- By Data Center Type
- By Commercial Model
- Key Takeaways
- Western Europe Market Analysis and Forecast, By Country
- Historical Market Size Value (USD Million) Trend Analysis By Market Taxonomy, 2021 to 2025
- Market Size Value (USD Million) Forecast By Market Taxonomy, 2026 to 2036
- By Country
- Germany
- France
- United Kingdom
- Italy
- Spain
- Benelux
- Nordics
- By Platform Function
- By Deployment Model
- By AI Rack Density
- By Data Center Type
- By Commercial Model
- By Country
- Market Attractiveness Analysis
- By Country
- By Platform Function
- By Deployment Model
- By AI Rack Density
- By Data Center Type
- By Commercial Model
- Key Takeaways
- Eastern Europe Market Analysis and Forecast, By Country
- Historical Market Size Value (USD Million) Trend Analysis By Market Taxonomy, 2021 to 2025
- Market Size Value (USD Million) Forecast By Market Taxonomy, 2026 to 2036
- By Country
- Poland
- Czech Republic
- Romania
- Hungary
- By Platform Function
- By Deployment Model
- By AI Rack Density
- By Data Center Type
- By Commercial Model
- By Country
- Market Attractiveness Analysis
- By Country
- By Platform Function
- By Deployment Model
- By AI Rack Density
- By Data Center Type
- By Commercial Model
- Key Takeaways
- East Asia Market Analysis and Forecast, By Country
- Historical Market Size Value (USD Million) Trend Analysis By Market Taxonomy, 2021 to 2025
- Market Size Value (USD Million) Forecast By Market Taxonomy, 2026 to 2036
- By Country
- China
- Japan
- South Korea
- By Platform Function
- By Deployment Model
- By AI Rack Density
- By Data Center Type
- By Commercial Model
- By Country
- Market Attractiveness Analysis
- By Country
- By Platform Function
- By Deployment Model
- By AI Rack Density
- By Data Center Type
- By Commercial Model
- Key Takeaways
- South Asia and Pacific Market Analysis and Forecast, By Country
- Historical Market Size Value (USD Million) Trend Analysis By Market Taxonomy, 2021 to 2025
- Market Size Value (USD Million) Forecast By Market Taxonomy, 2026 to 2036
- By Country
- India
- ASEAN
- Australia and New Zealand
- By Platform Function
- By Deployment Model
- By AI Rack Density
- By Data Center Type
- By Commercial Model
- By Country
- Market Attractiveness Analysis
- By Country
- By Platform Function
- By Deployment Model
- By AI Rack Density
- By Data Center Type
- By Commercial Model
- Key Takeaways
- Middle East and Africa Market Analysis and Forecast, By Country
- Historical Market Size Value (USD Million) Trend Analysis By Market Taxonomy, 2021 to 2025
- Market Size Value (USD Million) Forecast By Market Taxonomy, 2026 to 2036
- By Country
- GCC Countries
- South Africa
- Türkiye
- Israel
- By Platform Function
- By Deployment Model
- By AI Rack Density
- By Data Center Type
- By Commercial Model
- By Country
- Market Attractiveness Analysis
- By Country
- By Platform Function
- By Deployment Model
- By AI Rack Density
- By Data Center Type
- By Commercial Model
- Key Takeaways
- Key Countries Market Analysis
- United States
- Pricing Analysis
- Market Share Analysis, 2025
- By Platform Function
- By Deployment Model
- By AI Rack Density
- By Data Center Type
- By Commercial Model
- Canada
- Pricing Analysis
- Market Share Analysis, 2025
- By Platform Function
- By Deployment Model
- By AI Rack Density
- By Data Center Type
- By Commercial Model
- Mexico
- Pricing Analysis
- Market Share Analysis, 2025
- By Platform Function
- By Deployment Model
- By AI Rack Density
- By Data Center Type
- By Commercial Model
- Brazil
- Pricing Analysis
- Market Share Analysis, 2025
- By Platform Function
- By Deployment Model
- By AI Rack Density
- By Data Center Type
- By Commercial Model
- Chile
- Pricing Analysis
- Market Share Analysis, 2025
- By Platform Function
- By Deployment Model
- By AI Rack Density
- By Data Center Type
- By Commercial Model
- Germany
- Pricing Analysis
- Market Share Analysis, 2025
- By Platform Function
- By Deployment Model
- By AI Rack Density
- By Data Center Type
- By Commercial Model
- United Kingdom
- Pricing Analysis
- Market Share Analysis, 2025
- By Platform Function
- By Deployment Model
- By AI Rack Density
- By Data Center Type
- By Commercial Model
- Italy
- Pricing Analysis
- Market Share Analysis, 2025
- By Platform Function
- By Deployment Model
- By AI Rack Density
- By Data Center Type
- By Commercial Model
- Spain
- Pricing Analysis
- Market Share Analysis, 2025
- By Platform Function
- By Deployment Model
- By AI Rack Density
- By Data Center Type
- By Commercial Model
- France
- Pricing Analysis
- Market Share Analysis, 2025
- By Platform Function
- By Deployment Model
- By AI Rack Density
- By Data Center Type
- By Commercial Model
- India
- Pricing Analysis
- Market Share Analysis, 2025
- By Platform Function
- By Deployment Model
- By AI Rack Density
- By Data Center Type
- By Commercial Model
- ASEAN
- Pricing Analysis
- Market Share Analysis, 2025
- By Platform Function
- By Deployment Model
- By AI Rack Density
- By Data Center Type
- By Commercial Model
- Australia and New Zealand
- Pricing Analysis
- Market Share Analysis, 2025
- By Platform Function
- By Deployment Model
- By AI Rack Density
- By Data Center Type
- By Commercial Model
- China
- Pricing Analysis
- Market Share Analysis, 2025
- By Platform Function
- By Deployment Model
- By AI Rack Density
- By Data Center Type
- By Commercial Model
- Japan
- Pricing Analysis
- Market Share Analysis, 2025
- By Platform Function
- By Deployment Model
- By AI Rack Density
- By Data Center Type
- By Commercial Model
- South Korea
- Pricing Analysis
- Market Share Analysis, 2025
- By Platform Function
- By Deployment Model
- By AI Rack Density
- By Data Center Type
- By Commercial Model
- Poland
- Pricing Analysis
- Market Share Analysis, 2025
- By Platform Function
- By Deployment Model
- By AI Rack Density
- By Data Center Type
- By Commercial Model
- Hungary
- Pricing Analysis
- Market Share Analysis, 2025
- By Platform Function
- By Deployment Model
- By AI Rack Density
- By Data Center Type
- By Commercial Model
- Türkiye
- Pricing Analysis
- Market Share Analysis, 2025
- By Platform Function
- By Deployment Model
- By AI Rack Density
- By Data Center Type
- By Commercial Model
- South Africa
- Pricing Analysis
- Market Share Analysis, 2025
- By Platform Function
- By Deployment Model
- By AI Rack Density
- By Data Center Type
- By Commercial Model
- UAE
- Pricing Analysis
- Market Share Analysis, 2025
- By Platform Function
- By Deployment Model
- By AI Rack Density
- By Data Center Type
- By Commercial Model
- United States
- Market Structure Analysis
- Competition Dashboard
- Competition Benchmarking
- Market Share Analysis of Top Players
- By Regional
- By Platform Function
- By Deployment Model
- By AI Rack Density
- By Data Center Type
- By Commercial Model
- Emerging Startups
- Innovation Benchmarking
- Competition Analysis
- Competition Deep Dive
- NVIDIA
- Overview
- Product Portfolio
- Profitability by Market Segments
- Sales Footprint
- Strategy Overview
- Marketing Strategy
- Product Strategy
- Channel Strategy
- Arista Networks
- Hewlett Packard Enterprise
- Broadcom
- Keysight Technologies
- NVIDIA
- Case Studies
- Success Stories
- Recent Developments
- Competition Deep Dive
- Assumptions & Acronyms Used


