

- Market Size (2026)
- USD 420.3 Mn
- Forecast (2036)
- USD 1248.4 Mn
- CAGR (2026 to 2036)
- 11.5%
How big is GPU Cluster Load-Ramp Management Software Market in 2026?
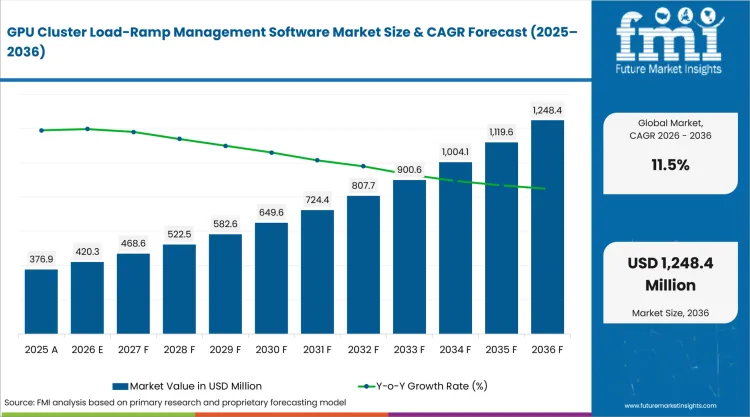
USD 420.3 million in 2026 and USD 1248.4 million by 2036 at an 11.5% CAGR.
Demand for GPU cluster load-ramp management software is projected to expand at an 11.5% CAGR between 2026 and 2036, increasing valuation from USD 420.3 million in 2026 to USD 1248.4 million by 2036. AI computing facilities are placing greater pressure on power systems because large training workloads can create rapid changes in electricity demand. NERC's July 2025 white paper documented fast and variable operating behavior in large computational loads during AI operations. The operating profile increases the need for software that can distinguish workload-driven power ramps from abnormal electrical events.
Ireland shows how grid limits change software purchasing even where compute architecture is similar. EirGrid and SONI documented about 2,000 MW of contracted transmission demand plus 300 MW at 110 kV in November 2025. The connection pipeline raises the value of load forecasts and auditable ramp controls earlier than sites with greater grid headroom.
Key Takeaways of GPU Cluster Load-Ramp Management Software Market
- GPU training clusters increase software demand because electrical teams must distinguish workload ramps from equipment faults before approving automated control actions.
- Based on software function, asset health - predictive maintenance is projected to account for 26.0% in 2026 due to the direct uptime cost of missed equipment deterioration.
- In 2026, medium-voltage distribution is expected to lead electrical layer with 31.0% share because campus operators must manage capacity before downstream events become system constraints.
- The 51-150 MW segment is likely to capture 31.0% share in 2026 attributable to repeatable campus blocks with material grid impact.
- Multi-vendor interfaces and fail-safe validation lengthen deployment because facility controls cannot automate workload responses until command ownership and fallback behavior are documented.
- Some of the key players in this market include Eaton, ABB, Siemens, and Janitza.
Analyst Perspective
"Confidence in GPU load-ramp software depends on tracing electrical events to workload timing before control logic changes site behavior. The commercial advantage appears once the same evidence supports capacity planning and fault diagnosis alongside repeatable commissioning without weakening uptime protection."
- Sudip Saha, Principal Consultant, Future Market Insights
How is the GPU Cluster Load-Ramp Management Software Market segmented?
The GPU cluster load-ramp management software market is segmented by software function, electrical layer, power capacity, facility type, route to market and region.
Software function covers asset health - predictive maintenance, capacity & load planning, dynamic load management, energy - cost optimization and compliance & reporting. Electrical layer covers medium-voltage distribution, low-voltage distribution, rack - row-level systems and substation - grid interface controls. Power capacity spans 51-150 MW, 10-50 MW, below 10 MW and above 150 MW. Facility type covers hyperscale AI, colocation, enterprise - private cloud operations and HPC - research facilities. Route to market covers OEM direct, electrical EPC - contractor, system integrator and distributor - service partner.
What supports medium-voltage distribution within the electrical layer category?
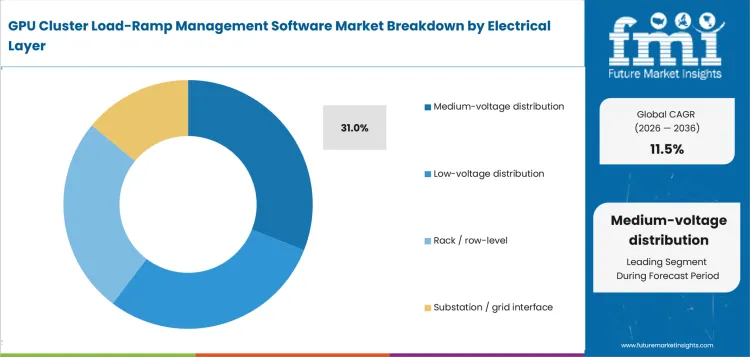
Campus operators lose rack-level context once load steps aggregate at transformers and medium-voltage feeders. Software at this layer must pair feeder loading with protection events so engineers can decide whether another compute block has usable headroom before switching activity reaches grid-facing equipment.
- By electrical layer, medium-voltage distribution is estimated to hold 31.0% in 2026 owing to the need for campus-level capacity and protection decisions before downstream events become system constraints.
- ABB's June 2025 Applied Digital partnership uses a medium-voltage UPS architecture at a 400 MW North Dakota campus, placing data center switchgear telemetry beside protection status before high-density loads are released.
What makes asset health - predictive maintenance central to the software function category?
GPU clusters can produce electrical signatures that resemble equipment stress during abrupt training transitions. Maintenance teams therefore need condition data from power monitoring systems before deciding whether a breaker alarm reflects workload behavior or equipment deterioration.
- By software function, asset health - predictive maintenance is estimated to hold 26.0% in 2026 owing to the direct uptime cost of missed equipment deterioration.
- ABB's December 2025 agreement to acquire IPEC extends early-failure detection for critical data-center electrical assets, placing predictive warning evidence closer to maintenance decisions that protect GPU uptime.
Why does the 51-150 MW band hold the stated power capacity share?
Sites in the 51-150 MW band are large enough for GPU ramps to affect feeder loading without requiring a unique campus design for every project. Repeatable block layouts let operators standardize load models and alarm logic while keeping expansion decisions tied to actual electrical headroom.
- The 51-150 MW segment is likely to capture 31.0% share in 2026 attributable to material grid impact and repeatable campus expansion.
- ABB and Kevlinx documented a 40 MVA Brussels design scalable to 100 MVA in October 2025, showing why staged data center power expansion requires software to reconcile new blocks with live electrical limits.
What supports hyperscale AI within the facility type category?
Hyperscale AI operators run enough synchronized accelerators for workload timing to become an electrical operating variable instead of a scheduling detail. Large fleets also justify dedicated analytics because one validated load model can inform capacity decisions for many halls and repeat deployments.
- In 2026, hyperscale AI is expected to lead facility type with 44.0% share because sustained high-density compute gives operators larger controllable load pools for electrical planning.
- Eaton's July 2025 NVIDIA collaboration targets 800 VDC infrastructure for 1 MW racks, making data center UPS behavior part of workload-aware capacity decisions upstream.
Why does OEM direct hold the stated route-to-market share?
OEM direct purchasing is favored where software needs device-level telemetry from power distribution units plus validated behavior from switchgear or protection equipment. A direct equipment relationship gives the operator one escalation path for firmware analysis and control logic during commissioning.
- OEM direct is set to lead the route-to-market category with 38.0% share in 2026 due to tighter access to device data and lifecycle support.
- Eaton and Siemens Energy paired modular data centers with standardized onsite power generation in June 2025, reducing design handoffs before load-ramp logic is validated for energization.
What are the drivers, restraints and opportunities in the GPU Cluster Load-Ramp Management Software Market?
Rapid GPU load changes raise the need for event-level electrical visibility, multi-vendor validation slows automated control and flexible workload scheduling gives operators a path to use constrained capacity more deliberately.
- Driver: Fast-changing AI workloads turn electrical load ramps into an uptime and grid-integration problem that facility teams must identify before protection margins are consumed.
- Restraint: Multi-vendor integration and fail-safe reviews lengthen deployment because automated responses cannot override protection or cybersecurity controls without documented validation and ownership.
- Opportunity: Workload-aware software can use verified electrical headroom to schedule flexible compute while operators wait for new grid or onsite generation capacity.
Training clusters turn workload timing into an electrical planning variable because synchronized accelerators can change site demand within seconds. The IEA projected in April 2025 that global data-center electricity use will more than double to about 945 TWh by 2030. Industrial power monitoring systems therefore need feeder-level event visibility before facility engineers release another high-density compute block.
Control integration slows adoption because GPU facilities already run protection relays and EPMS beside BMS or compute schedulers. NERC authorized Project 2026-02 in May 2026 to draft reliability standards for large computational loads and near-term integration risks. New software must pass ownership and fail-safe reviews before data center infrastructure management systems can trigger workload-aware responses.
Flexible compute schedules can use existing electrical headroom before a physical capacity expansion becomes available. Lawrence Berkeley National Laboratory documented 49 participants in a November 2024 DOE workshop evaluating load shifting and onsite energy for data centers. Load-ramp software can expose controllable headroom after operators identify which jobs can pause without breaching service commitments.
Which country CAGRs are covered in the GPU Cluster Load-Ramp Management Software Market?
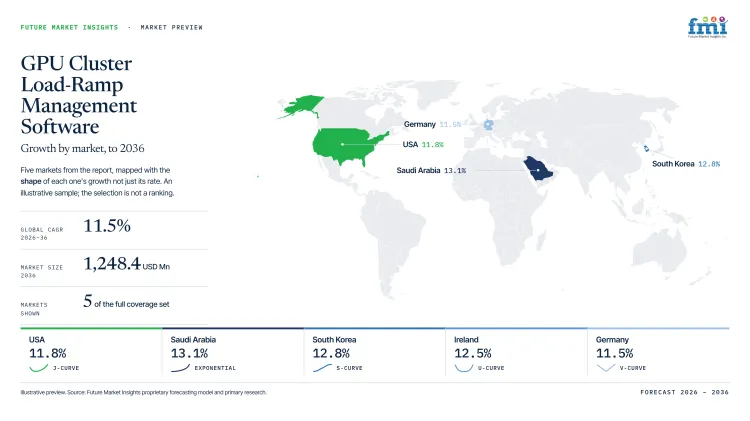
| Country | CAGR |
|---|---|
| Saudi Arabia | 13.1% |
| South Korea | 12.8% |
| Ireland | 12.5% |
| UAE | 12.2% |
| USA | 11.8% |
| Germany | 11.5% |
How do country-level CAGRs compare in the GPU Cluster Load-Ramp Management Software Market?
Saudi Arabia and South Korea form the upper growth band as AI programs add compute capacity at scale. Ireland and the UAE follow near 12% as concentrated campus programs keep electrical planning close to expansion decisions. USA and Germany grow more steadily because installed infrastructure shifts spending toward integration quality.
- Saudi Arabia is benefiting from large-scale AI and data-center expansion programs that increasingly integrate load-ramp management capabilities into new infrastructure deployments.
- South Korea’s strength in electrical automation supports the incorporation of load-ramp management software across emerging AI facility projects.
- Ireland’s concentrated data-center ecosystem enables repeat software deployments and operational standardization across high-density sites.
- The UAE’s centralized infrastructure planning encourages greater standardization of electrical requirements across AI development projects.
- The USA’s extensive installed data-center base is driving demand for load-ramp management solutions through retrofit and integration initiatives.
- Germany’s advanced automation environment places a strong emphasis on integration quality and operational reliability when deploying new software platforms
Similar CAGRs produce buying conditions because installed infrastructure and project concentration change integration requirements. The full report provides country-level CAGR analysis across North America, Latin America, Western Europe, Eastern Europe, East Asia, South Asia and Pacific, and the Middle East and Africa.
Country-wise Analysis
- Saudi Arabia is building AI campuses on greenfield sites where electrical architecture can be specified before compute halls enter commissioning. The country's GPU cluster load-ramp management software sector is projected to record 13.1% CAGR during the assessment period, driven by new compute capacity that needs coordinated power controls. The Ministry of Communications and Information Technology stated in February 2025 that KKR and Gulf Data Hub planned up to 300 MW of Saudi data-center capacity. Greenfield design gives integrators room to place telemetry early, although utility coordination and rapid campus commissioning still favor software with tested control-room interfaces and clear fallback behavior.
- South Korea is expanding public GPU capacity while power availability influences where new AI facilities are built. The national buildout also increases the need to coordinate facility automation with electricity-supply planning. At 12.8% CAGR over the forecast period, South Korea's GPU cluster load-ramp management software sector is set to expand, underpinned by new national compute capacity. The Ministry of Science and ICT said in February 2025 that the government aimed to secure 18,000 advanced GPUs by the first half of 2026. Software still must fit domestic utility studies and local facility-control practices before new capacity can be energized.
- Ireland's data-center pipeline operates within a compact power system where connection conditions influence early electrical design. The Central Statistics Office reported in June 2025 that data centers consumed 22% of metered electricity during 2024. That share raises the value of power quality equipment data because grid-facing behavior must be documented before new capacity is trusted. Ireland's GPU cluster load-ramp management software sector is estimated to grow at 12.5% CAGR through 2036, reflecting concentrated compute demand and grid-facing controls. Projects lacking matched generation or storage face longer connection paths, so operating records must serve facility control and constrained-grid planning.
- Staged commissioning defines the UAE opportunity because large AI campuses bring compute capacity online in power blocks. In the UAE, GPU cluster load-ramp management software demand is predicted to advance at 12.2% CAGR through 2036 due to centralized AI infrastructure development. Abu Dhabi Media Office announced in May 2025 that Stargate UAE will provide a 1-gigawatt compute cluster with its first 200 megawatts expected in 2026. Repeated blocks can reuse validated load models, but protection and grid evidence require testing before each phase is energized. Software providers gain an entry advantage when proven control logic shortens commissioning without changing protection ownership.
- USA data-center construction spans grid regions with different interconnection queues and limits on new large-load connections. Regional rules prevent one control template from carrying unchanged between AI campuses in separate utility territories. The USA is estimated to post 11.8% CAGR over the forecast period, driven by hyperscale construction and rising power requirements. The Energy Information Administration reported in March 2026 that national electricity demand grew about 1.7% annually from 2020 to 2025 as data centers contributed to recent growth. Site-specific data center LV/MV power distribution data guides ramp models, and software must preserve local protection settings during automated responses.
- Germany ties data-center operations to energy-efficiency requirements that must coexist with electrical monitoring and control systems. The Federal Ministry for Economic Affairs and Energy announced in June 2026 that new data centers would receive four years to meet updated PUE requirements. Gpu cluster load-ramp management software demand in Germany is anticipated to record 11.5% CAGR during the assessment period, supported by AI-capacity investment and formal efficiency obligations. Local industrial energy management systems can share reporting data with ramp analytics instead of duplicating mature-site instrumentation. Grid connection and heat-network conditions still limit how quickly operators can modify control schemes without disturbing compliance records.
Who are the notable companies in the GPU Cluster Load-Ramp Management Software Market?
Eaton, ABB, Siemens, and Janitza are the notable companies in this market.
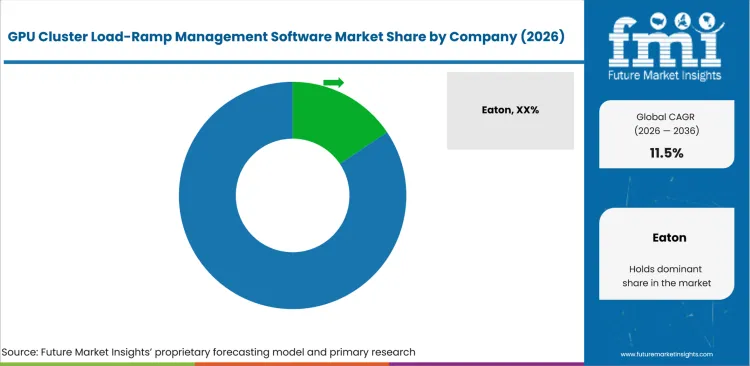
Competition centers on electrical groups that already own device telemetry or power-quality data inside data centers. Load-ramp software must interpret fast events without weakening protection logic or adding commands that operators cannot validate. Existing hardware relationships reduce integration work, but software credibility still depends on documented performance through campus control.
- Eaton and ABB cover medium-voltage equipment plus digital monitoring, giving both companies direct access to electrical data used during AI power events.
- Siemens concentrates on automation and site-level control that can associate fast workload behavior with electrical operating limits.
- Janitza concentrates on power-quality measurement and GridVis software for facilities that require detailed evidence before changing electrical controls.
Competitive Benchmarking: GPU Cluster Load-Ramp Management Software Market
| Company | Load-Ramp Sensing & Event Analytics | Multi-Layer Electrical Control Integration | Predictive Asset & Energy Optimization | Geographic Reach |
|---|---|---|---|---|
| Eaton | High | High | High | Global |
| ABB | Medium | High | High | Global |
| Siemens | High | High | Medium | Global |
| Janitza | High | Medium | Medium | Europe, North America and selected international markets |
Key Developments in the GPU Cluster Load-Ramp Management Software Market
- In March 2026, ABB extended its VoltaGrid collaboration with orders for 35 synchronous condensers and eHouses supporting AI data-center power projects. The order addresses voltage stability at high-density sites where load swings can propagate beyond server halls into onsite generation systems.
- In March 2026, Siemens invested in Emerald AI and linked its data-center partner program with Fluence and PhysicsX for workload-aware power flexibility. The program tests how compute scheduling can support faster grid connection without separating workload decisions from electrical operating limits.
- In March 2026, Eaton introduced the Beam Rubin DSX platform with NVIDIA for modular power and cooling deployment in high-density AI factories. The platform brings grid-to-chip infrastructure into one implementation path where load behavior can be validated before successive capacity blocks enter service.
Key Players in the GPU Cluster Load-Ramp Management Software Market
Integrated Power and Electrification Platforms
- Eaton
- ABB
Grid Automation and Load-Ramp Control
- Siemens
Power-Quality Intelligence
- Janitza
GPU Cluster Load-Ramp Management Software Market - Report Scope
| Coverage field | Report scope |
|---|---|
| Market breakdown | By software function, electrical layer, power capacity, facility type, route to market and region. |
| Quantitative Units | Revenue in USD million and CAGR in %. |
| Market Definition | Revenue includes software licenses, subscriptions and implementation services that monitor or manage rapid GPU-driven electrical load changes within data-center power systems. |
| Regions Covered | North America, Latin America, Western Europe, Eastern Europe, East Asia, South Asia and Pacific, and Middle East and Africa. |
| Countries Covered | Saudi Arabia, South Korea, Ireland, UAE, USA, Germany, and 20+ countries included in the full report. |
| Key Companies | Eaton, ABB, Siemens, Janitza. |
| Forecast Period | 2026 to 2036. |
| Approach | Primary and secondary research with market triangulation. |
GPU Cluster Load-Ramp Management Software Market - Research Methodology
| Method | Approach |
|---|---|
| Primary Research | FMI analysts gathered input from manufacturers, service providers, technology developers, distributors, end users, procurement teams, and subject-matter experts. Interviews examined purchasing decisions, product or service evaluation, adoption barriers, approval requirements, pricing considerations, and expectations for technical or commercial support. Respondents were also asked what evidence is required before a trial, pilot, or initial order develops into regular purchasing. |
| Desk Research | Desk research covered government statistics, regulatory publications, trade data, industry associations, technical literature, standards, company filings, product information, and official corporate announcements. Sources were reviewed for relevance, publication date, geographic coverage, and consistency with the defined market scope. Claims relating to performance, applications, approvals, capacity, investment, and commercial activity were retained only when supported by credible public evidence. |
| Market Sizing and Forecasting | The market model combined the baseline value with historical performance, segment structure, pricing and volume indicators, adoption levels, company participation, and country-level demand conditions. Forecast assumptions considered economic activity, investment trends, regulatory developments, technology adoption, purchasing cycles, supply availability, and barriers to wider market use. Segment and regional estimates were reconciled before the final market total was calculated. |
| Data Validation | Estimates were checked against multiple independent indicators, including public data, company activity, trade patterns, industry developments, and findings from primary interviews. Validation also tested whether products, services, applications, and company revenues fell within the defined market boundaries. Adjacent categories, unsupported claims, overlapping revenues, and activities without direct market relevance were excluded to reduce double counting and maintain consistency across segments and countries. |
GPU Cluster Load-Ramp Management Software Market by Segments
Software Function
- asset health - predictive maintenance
- capacity & load planning
- dynamic load management
- energy - cost optimization
- compliance & reporting
Electrical Layer
- medium-voltage distribution
- low-voltage distribution
- rack - row-level
- substation - grid interface
Power Capacity
- 51-150 MW
- 10-50 MW
- below 10 MW
- above 150 MW
Facility Type
- hyperscale AI
- colocation
- enterprise - private cloud
- HPC - research
Route to Market
- OEM direct
- electrical EPC - contractor
- system integrator
- distributor - service partner
GPU Cluster Load-Ramp Management Software Market by Region:
- North America
- United States
- Canada
- Latin America
- Brazil
- Mexico
- Argentina
- Chile
- Western Europe
- Germany
- France
- UK
- Italy
- Spain
- Benelux
- Nordics
- Eastern Europe
- Poland
- Czech Republic
- Romania
- Hungary
- East Asia
- China
- Japan
- South Korea
- South Asia and Pacific
- India
- ASEAN
- Australia and New Zealand
- Middle East and Africa
- GCC Countries
- South Africa
- Türkiye
- Israel
Research Sources and Bibliography
- North American Electric Reliability Corporation. (2025, July). Characteristics and Risks of Emerging Large Loads.
- EirGrid and SONI. (2025, November 17). Large Demand Facility Fault Ride Through Issue and Proposed Solutions.
- ABB. (2025, December 16). ABB strengthens data center and industrial monitoring capabilities with IPEC acquisition.
- ABB. (2025, June 11). ABB and Applied Digital accelerate AI-ready data centers.
- ABB. (2025, October 7). ABB and Kevlinx build energy-intelligent data centers for scalable AI workloads.
- Eaton. (2025, July 15). Eaton accelerates the transformation of data center infrastructure in the AI era with NVIDIA.
- Eaton. (2025, June 3). Eaton and Siemens Energy join forces to provide power and technology to accelerate the delivery of new data center capacity.
- International Energy Agency. (2025, April 10). Energy and AI.
- North American Electric Reliability Corporation. (2026, May 14). Standards Committee Actions without a Meeting: Project 2026-02 - Computational Loads.
- Kirchstetter, T. W., Smith, S. J., Shehabi, A., & Sartor, D. A. (2025, January). DOE Data Center Load Flexibility Workshop Summary.
- Ministry of Communications and Information Technology, Saudi Arabia. (2025, February 17). Saudi Arabia Solidifies Its Position as a Regional and Global Hub for AI with $14.9B in Investment at LEAP25.
- Ministry of Science and ICT, Republic of Korea. (2025, February 20). Korea to Expand AI Computing Infrastructure to Strengthen National AI Capabilities and Achieve Global Leadership.
- Central Statistics Office, Ireland. (2025, June 10). Data Centres Metered Electricity Consumption 2024: Key Findings.
- Abu Dhabi Media Office. (2025, May 22). Global tech alliance launches 'Stargate UAE'.
- USA Energy Information Administration. (2026, March 12). Fossil generation could rise with faster-than-expected growth in data center power demand.
- Federal Ministry for Economic Affairs and Energy, Germany. (2026, June 24). Vereinfachungen umgesetzt und Bürokratie reduziert - Bundeskabinett beschließt Energieeffizienzgesetz.
- ABB. (2026, March 26). ABB and VoltaGrid extend collaboration on data center power infrastructure.
- Siemens. (2026, March 18). Siemens expands data center partner ecosystem to scale next-generation AI infrastructure.
- Eaton. (2026, March 16). Eaton collaborates with NVIDIA to unveil the Eaton Beam Rubin DSX platform to address the nearly $7 trillion data center buildout market from grid to chip.
- Eaton. (2025, October 13). Eaton unveils next-generation architecture to advance 800 VDC power infrastructure for AI factories.
- ABB. (2025, October 13). ABB to develop next-generation AI data centers with NVIDIA.
- Eaton. (2026, January 28). Eaton expands modular data center offering for rapid deployment of AI factories from grid to chip.
- Siemens. (2025, November 19). Siemens and Delta power solutions cut data center deployment time, costs, and carbon emissions.
- ABB. (2025, December 11). ABB and Ark Data Centres power UK’s first AI data centre.
- Janitza. (2025, July 18). Successful TÜV Süd Audit and Strong Result for GRIDVIS®.
- Eaton. (2025, September 9). Eaton delivers edge-based innovation to help mitigate the impact of AI power bursting on both data centers and the grid.
- Eaton. (2025, September 15). Eaton accelerates transformation of building and data center infrastructure with Autodesk to deliver AI-powered digital energy twin and software tools.
- ABB. (2025, March 11). ABB invests in DG Matrix to advance AI data center power optimization.
- Siemens. (2026, January 8). Soluna and Siemens Collaborate to Solve GPU Power Swings in Behind-the-Meter AI.
- Janitza. (2025, July 24). Janitza acquires majority stake in Digimondo - Software expertise for complete solutions strengthened.
This Report Answers
- How large is the GPU cluster load-ramp management software market in 2026 and 2036?
- Which electrical operating conditions explain demand for workload-aware ramp analytics in AI data centers?
- Which software function accounts for 26.0% of revenue in 2026?
- How does medium-voltage distribution shape software requirements at campus level?
- Why does the 51-150 MW capacity band account for 31.0% of revenue in 2026?
- How do facility type and route-to-market choices change the control and support model?
- How do country growth rates differ among Saudi Arabia, South Korea, Ireland, UAE, USA and Germany?
- Which companies compete in electrical sensing, controls and power-quality software for GPU load ramps?
- What limits automated load responses when several electrical and compute systems share control responsibility?
Frequently Asked Questions
How big is the GPU Cluster Load-Ramp Management Software Market in 2026?
The GPU cluster load-ramp management software market is valued at USD 420.3 million in 2026 and is projected to reach USD 1248.4 million by 2036. Faster GPU load changes require electrical visibility before facility teams approve automated responses on critical power systems.
What is the CAGR of the GPU Cluster Load-Ramp Management Software Market from 2026 to 2036?
The GPU cluster load-ramp management software market is projected to grow at a CAGR of 11.5% between 2026 and 2036. Larger AI compute installations increase the need to coordinate workload behavior with electrical operating limits at high-density sites.
Which software function leads the GPU Cluster Load-Ramp Management Software Market?
The asset health - predictive maintenance segment is expected to hold 26.0% of the GPU cluster load-ramp management software market in 2026, attributable to missed-deterioration uptime risk. Condition evidence separates equipment faults from workload-driven events before maintenance teams dispatch technicians to critical power assets.
Which electrical layer carries the stated share in the GPU Cluster Load-Ramp Management Software Market?
The medium-voltage distribution segment is expected to hold 31.0% of the GPU cluster load-ramp management software market in 2026, driven by campus-level capacity and protection requirements. Medium-voltage telemetry shows aggregated GPU load steps before those changes reach grid-facing equipment and protection systems.
Which companies are active in the GPU Cluster Load-Ramp Management Software Market?
Key companies operating in the GPU cluster load-ramp management software market include Eaton, ABB, Siemens, and Janitza. Their roles cover power-event analytics and electrical automation plus predictive maintenance and power-quality monitoring for high-density data centers.
Preview the report firsthand - request a free sample
Get SampleGet the brochure for pricing and purchase details.
Get PDFTable of Content
- Key Takeaways
- Market Size and CAGR
- Top Growth Driver
- Fastest Growing Segment
- Leading Region
- Key Companies
- Emerging Opportunities
- Executive Summary
- Global Market Outlook
- Demand-side Trends
- Supply-side Trends
- Technology Roadmap Analysis
- Analysis and Recommendations
- Analyst Perspective (What is happening? Why now? What should investors know?)
- Key Questions Answered
- How large is the market?
- What is the CAGR?
- What are key trends?
- Which region dominates?
- Who are the leaders?
- Market Overview
- Market Coverage / Taxonomy
- Market Definition / Scope / Limitations
- Research Methodology
- Chapter Orientation
- Analytical Lens and Working Hypotheses
- Market Structure, Signals, and Trend Drivers
- Benchmarking and Cross-market Comparability
- Market Sizing, Forecasting, and Opportunity Mapping
- Research Design and Evidence Framework
- Desk Research Programme (Secondary Evidence)
- Expert Input and Fieldwork (Primary Evidence)
- Tooling, Models, and Reference Databases
- Data Engineering and Model Build
- Quality Assurance and Audit Trail
- Market Background
- Market Dynamics (Drivers, Restraints, Opportunity, Trends)
- Scenario Forecast (Optimistic, Likely, Conservative)
- Impact Analysis
- AI Impact
- Sustainability Impact
- Regulatory Impact
- Technology Impact
- Consumer / Buyer Analysis
- Purchase Drivers
- Adoption Barriers
- Buyer Journey
- Opportunity Map Analysis
- Product Life Cycle Analysis
- Supply Chain Analysis
- Investment Feasibility Matrix
- Value Chain Analysis
- PESTLE and Porter's Analysis
- Regulatory Landscape
- Regional Parent Market Outlook
- Production and Consumption Statistics
- Import and Export Statistics
- Global Market Analysis and Forecast, 2021 to 2036
- Historical Market Size Value (USD Million) Analysis, 2021 to 2025
- Current and Future Market Size Value (USD Million) Projections, 2026 to 2036
- Y-o-Y Growth Trend Analysis
- Absolute $ Opportunity Analysis
- Global Market Pricing Analysis, 2021 to 2036
- Global Market Analysis and Forecast, By Software Function, 2021 to 2036
- Introduction / Key Findings
- Historical Market Size Value (USD Million) Analysis By Software Function, 2021 to 2025
- Current and Future Market Size Value (USD Million) Analysis and Forecast By Software Function, 2026 to 2036
- Asset health / predictive maintenance
- Capacity & load planning
- Dynamic load management
- Energy / cost optimization
- Compliance & reporting
- Asset health / predictive maintenance
- Y-o-Y Growth Trend Analysis By Software Function, 2021 to 2025
- Absolute $ Opportunity Analysis By Software Function, 2026 to 2036
- Global Market Analysis and Forecast, By Electrical Layer, 2021 to 2036
- Introduction / Key Findings
- Historical Market Size Value (USD Million) Analysis By Electrical Layer, 2021 to 2025
- Current and Future Market Size Value (USD Million) Analysis and Forecast By Electrical Layer, 2026 to 2036
- Medium-voltage distribution
- Low-voltage distribution
- Rack / row-level
- Substation / grid interface
- Medium-voltage distribution
- Y-o-Y Growth Trend Analysis By Electrical Layer, 2021 to 2025
- Absolute $ Opportunity Analysis By Electrical Layer, 2026 to 2036
- Global Market Analysis and Forecast, By Power Capacity, 2021 to 2036
- Introduction / Key Findings
- Historical Market Size Value (USD Million) Analysis By Power Capacity, 2021 to 2025
- Current and Future Market Size Value (USD Million) Analysis and Forecast By Power Capacity, 2026 to 2036
- 51-150 MW
- 10-50 MW
- Below 10 MW
- Above 150 MW
- 51-150 MW
- Y-o-Y Growth Trend Analysis By Power Capacity, 2021 to 2025
- Absolute $ Opportunity Analysis By Power Capacity, 2026 to 2036
- Global Market Analysis and Forecast, By Facility Type, 2021 to 2036
- Introduction / Key Findings
- Historical Market Size Value (USD Million) Analysis By Facility Type, 2021 to 2025
- Current and Future Market Size Value (USD Million) Analysis and Forecast By Facility Type, 2026 to 2036
- Hyperscale AI
- Colocation
- Enterprise / private cloud
- HPC / research
- Hyperscale AI
- Y-o-Y Growth Trend Analysis By Facility Type, 2021 to 2025
- Absolute $ Opportunity Analysis By Facility Type, 2026 to 2036
- Global Market Analysis and Forecast, By Route to Market, 2021 to 2036
- Introduction / Key Findings
- Historical Market Size Value (USD Million) Analysis By Route to Market, 2021 to 2025
- Current and Future Market Size Value (USD Million) Analysis and Forecast By Route to Market, 2026 to 2036
- OEM direct
- Electrical EPC / contractor
- System integrator
- Distributor / service partner
- OEM direct
- Y-o-Y Growth Trend Analysis By Route to Market, 2021 to 2025
- Absolute $ Opportunity Analysis By Route to Market, 2026 to 2036
- Global Market Analysis and Forecast, By Region, 2021 to 2036
- Introduction
- Historical Market Size Value (USD Million) Analysis By Region, 2021 to 2025
- Current Market Size Value (USD Million) Analysis and Forecast By Region, 2026 to 2036
- North America
- Latin America
- Western Europe
- Eastern Europe
- East Asia
- South Asia and Pacific
- Middle East & Africa
- Market Attractiveness Analysis By Region
- North America Market Analysis and Forecast, By Country, 2021 to 2036
- Historical Market Size Value (USD Million) Trend Analysis By Market Taxonomy, 2021 to 2025
- Market Size Value (USD Million) Forecast By Market Taxonomy, 2026 to 2036
- By Country
- USA
- Canada
- By Software Function
- By Electrical Layer
- By Power Capacity
- By Facility Type
- By Route to Market
- By Country
- Market Attractiveness Analysis
- By Country
- By Software Function
- By Electrical Layer
- By Power Capacity
- By Facility Type
- By Route to Market
- Key Takeaways
- Latin America Market Analysis and Forecast, By Country
- Historical Market Size Value (USD Million) Trend Analysis By Market Taxonomy, 2021 to 2025
- Market Size Value (USD Million) Forecast By Market Taxonomy, 2026 to 2036
- By Country
- Brazil
- Mexico
- Chile
- Rest of Latin America
- By Software Function
- By Electrical Layer
- By Power Capacity
- By Facility Type
- By Route to Market
- By Country
- Market Attractiveness Analysis
- By Country
- By Software Function
- By Electrical Layer
- By Power Capacity
- By Facility Type
- By Route to Market
- Key Takeaways
- Western Europe Market Analysis and Forecast, By Country
- Historical Market Size Value (USD Million) Trend Analysis By Market Taxonomy, 2021 to 2025
- Market Size Value (USD Million) Forecast By Market Taxonomy, 2026 to 2036
- By Country
- Germany
- UK
- Italy
- Spain
- France
- Nordic
- BENELUX
- Rest of Western Europe
- By Software Function
- By Electrical Layer
- By Power Capacity
- By Facility Type
- By Route to Market
- By Country
- Market Attractiveness Analysis
- By Country
- By Software Function
- By Electrical Layer
- By Power Capacity
- By Facility Type
- By Route to Market
- Key Takeaways
- Eastern Europe Market Analysis and Forecast, By Country
- Historical Market Size Value (USD Million) Trend Analysis By Market Taxonomy, 2021 to 2025
- Market Size Value (USD Million) Forecast By Market Taxonomy, 2026 to 2036
- By Country
- Russia
- Poland
- Hungary
- Balkan & Baltic
- Rest of Eastern Europe
- By Software Function
- By Electrical Layer
- By Power Capacity
- By Facility Type
- By Route to Market
- By Country
- Market Attractiveness Analysis
- By Country
- By Software Function
- By Electrical Layer
- By Power Capacity
- By Facility Type
- By Route to Market
- Key Takeaways
- East Asia Market Analysis and Forecast, By Country
- Historical Market Size Value (USD Million) Trend Analysis By Market Taxonomy, 2021 to 2025
- Market Size Value (USD Million) Forecast By Market Taxonomy, 2026 to 2036
- By Country
- China
- Japan
- South Korea
- By Software Function
- By Electrical Layer
- By Power Capacity
- By Facility Type
- By Route to Market
- By Country
- Market Attractiveness Analysis
- By Country
- By Software Function
- By Electrical Layer
- By Power Capacity
- By Facility Type
- By Route to Market
- Key Takeaways
- South Asia and Pacific Market Analysis and Forecast, By Country
- Historical Market Size Value (USD Million) Trend Analysis By Market Taxonomy, 2021 to 2025
- Market Size Value (USD Million) Forecast By Market Taxonomy, 2026 to 2036
- By Country
- India
- ASEAN
- Australia & New Zealand
- Rest of South Asia and Pacific
- By Software Function
- By Electrical Layer
- By Power Capacity
- By Facility Type
- By Route to Market
- By Country
- Market Attractiveness Analysis
- By Country
- By Software Function
- By Electrical Layer
- By Power Capacity
- By Facility Type
- By Route to Market
- Key Takeaways
- Middle East & Africa Market Analysis and Forecast, By Country
- Historical Market Size Value (USD Million) Trend Analysis By Market Taxonomy, 2021 to 2025
- Market Size Value (USD Million) Forecast By Market Taxonomy, 2026 to 2036
- By Country
- Kingdom of Saudi Arabia
- Other GCC Countries
- Türkiye
- South Africa
- Other African Union
- Rest of Middle East & Africa
- By Software Function
- By Electrical Layer
- By Power Capacity
- By Facility Type
- By Route to Market
- By Country
- Market Attractiveness Analysis
- By Country
- By Software Function
- By Electrical Layer
- By Power Capacity
- By Facility Type
- By Route to Market
- Key Takeaways
- Key Countries Market Analysis
- USA
- Pricing Analysis
- Market Share Analysis, 2025
- By Software Function
- By Electrical Layer
- By Power Capacity
- By Facility Type
- By Route to Market
- Canada
- Pricing Analysis
- Market Share Analysis, 2025
- By Software Function
- By Electrical Layer
- By Power Capacity
- By Facility Type
- By Route to Market
- Mexico
- Pricing Analysis
- Market Share Analysis, 2025
- By Software Function
- By Electrical Layer
- By Power Capacity
- By Facility Type
- By Route to Market
- Brazil
- Pricing Analysis
- Market Share Analysis, 2025
- By Software Function
- By Electrical Layer
- By Power Capacity
- By Facility Type
- By Route to Market
- Chile
- Pricing Analysis
- Market Share Analysis, 2025
- By Software Function
- By Electrical Layer
- By Power Capacity
- By Facility Type
- By Route to Market
- Germany
- Pricing Analysis
- Market Share Analysis, 2025
- By Software Function
- By Electrical Layer
- By Power Capacity
- By Facility Type
- By Route to Market
- UK
- Pricing Analysis
- Market Share Analysis, 2025
- By Software Function
- By Electrical Layer
- By Power Capacity
- By Facility Type
- By Route to Market
- Italy
- Pricing Analysis
- Market Share Analysis, 2025
- By Software Function
- By Electrical Layer
- By Power Capacity
- By Facility Type
- By Route to Market
- Spain
- Pricing Analysis
- Market Share Analysis, 2025
- By Software Function
- By Electrical Layer
- By Power Capacity
- By Facility Type
- By Route to Market
- France
- Pricing Analysis
- Market Share Analysis, 2025
- By Software Function
- By Electrical Layer
- By Power Capacity
- By Facility Type
- By Route to Market
- India
- Pricing Analysis
- Market Share Analysis, 2025
- By Software Function
- By Electrical Layer
- By Power Capacity
- By Facility Type
- By Route to Market
- ASEAN
- Pricing Analysis
- Market Share Analysis, 2025
- By Software Function
- By Electrical Layer
- By Power Capacity
- By Facility Type
- By Route to Market
- Australia & New Zealand
- Pricing Analysis
- Market Share Analysis, 2025
- By Software Function
- By Electrical Layer
- By Power Capacity
- By Facility Type
- By Route to Market
- China
- Pricing Analysis
- Market Share Analysis, 2025
- By Software Function
- By Electrical Layer
- By Power Capacity
- By Facility Type
- By Route to Market
- Japan
- Pricing Analysis
- Market Share Analysis, 2025
- By Software Function
- By Electrical Layer
- By Power Capacity
- By Facility Type
- By Route to Market
- South Korea
- Pricing Analysis
- Market Share Analysis, 2025
- By Software Function
- By Electrical Layer
- By Power Capacity
- By Facility Type
- By Route to Market
- Russia
- Pricing Analysis
- Market Share Analysis, 2025
- By Software Function
- By Electrical Layer
- By Power Capacity
- By Facility Type
- By Route to Market
- Poland
- Pricing Analysis
- Market Share Analysis, 2025
- By Software Function
- By Electrical Layer
- By Power Capacity
- By Facility Type
- By Route to Market
- Hungary
- Pricing Analysis
- Market Share Analysis, 2025
- By Software Function
- By Electrical Layer
- By Power Capacity
- By Facility Type
- By Route to Market
- Kingdom of Saudi Arabia
- Pricing Analysis
- Market Share Analysis, 2025
- By Software Function
- By Electrical Layer
- By Power Capacity
- By Facility Type
- By Route to Market
- Türkiye
- Pricing Analysis
- Market Share Analysis, 2025
- By Software Function
- By Electrical Layer
- By Power Capacity
- By Facility Type
- By Route to Market
- South Africa
- Pricing Analysis
- Market Share Analysis, 2025
- By Software Function
- By Electrical Layer
- By Power Capacity
- By Facility Type
- By Route to Market
- USA
- Market Structure Analysis
- Competition Dashboard
- Competition Benchmarking
- Market Share Analysis of Top Players
- By Regional
- By Software Function
- By Electrical Layer
- By Power Capacity
- By Facility Type
- By Route to Market
- Emerging Startups
- Innovation Benchmarking
- Competition Analysis
- Competition Deep Dive
- Eaton
- Overview
- Product Portfolio
- Profitability by Market Segments
- Sales Footprint
- Strategy Overview
- Marketing Strategy
- Product Strategy
- Channel Strategy
- ABB
- Siemens
- Janitza
- Eaton
- Case Studies
- Success Stories
- Recent Developments
- Competition Deep Dive
- Assumptions & Acronyms Used


