

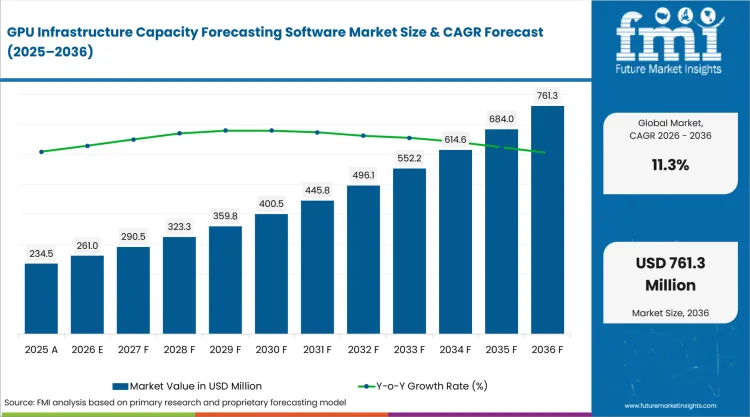
- Market Size (2026)
- USD 261.0 Mn
- Forecast (2036)
- USD 761.3 Mn
- CAGR (2026 to 2036)
- 11.3%
How big is GPU Infrastructure Capacity Forecasting Software Market in 2026?
USD 261.0 million in 2026 and USD 761.3 million by 2036 at an 11.3% CAGR.
Demand for GPU infrastructure capacity forecasting software is projected to expand at 11.3% CAGR between 2026 and 2036, raising revenue from USD 261.0 million to USD 761.3 million. Data-center operators buy these tools as accelerator clusters can exhaust electrical or cooling headroom despite unused floor space. The International Energy Agency reported in April 2026 that data-center electricity demand rose 17% during 2025, with AI-focused facilities growing 50% over the same period. Forecast software earns budget once live facility data defines usable power and thermal capacity for GPU deployment.
Power and siting conditions determine the constraint a capacity model must represent in deployment planning. USA brownfield projects often begin with utility and cooling limits that purpose-built campuses can model earlier. The USA Energy Information Administration reported in March 2026 that electricity demand grew 1.7% annually during 2020-2025 after 0.1% annual growth during 2005-2019. Higher load makes planners distinguish installed megawatts from power that can support reserved accelerators.
Key Takeawaysof GPU Infrastructure Capacity Forecasting Software Market
- AI compute expansion increases spending on forecasting software as facility power and cooling headroom now determines whether reserved GPU capacity can be activated.
- Monitoring & telemetry is projected to hold 27.0% share in 2026 owing to live facility-state data needed for credible capacity forecasts.
- In 2026, SaaS - public cloud is expected to lead deployment model with 38.0% share because centrally maintained analytics give distributed sites one forecasting view.
- The 251-500 kW band is likely to capture 32.0% share in 2026 attributable to tighter electrical and thermal headroom at higher rack densities.
- Fragmented facility and IT records can delay deployment since forecast accuracy depends on consistent asset identities and current power measurements.
- Key players in the GPU infrastructure capacity forecasting software market include Sunbird Software, Siemens, Schneider Electric, and Device42, a Freshworks company.
Analyst Perspective
"Capacity forecasting software earns its place once models separate theoretical rack capacity from power and cooling headroom that can be commissioned on schedule. A useful evaluation tests connector coverage and scenario depth against live electrical limits so planned GPU blocks stay tied to current facility conditions."
- Sudip saha, Principal Consultant, Future Market Insights
How is the GPU Infrastructure Capacity Forecasting Software Market segmented?
Segmentation covers platform function, deployment model, AI rack density, data center type, commercial model, and region.
Platform function includes monitoring & telemetry, planning & simulation, optimization & control, fault - reliability analytics, and reporting & governance. Deployment covers SaaS - public cloud, private cloud, on-premise, and hybrid deployment. AI rack density covers 251-500 kW, 100-250 kW, below 100 kW, and above 500 kW. Data center type includes hyperscale AI, colocation AI, enterprise private AI, and HPC & research centers. Commercial models include direct enterprise, system integrator - EPC-led, subscription - license, and managed-service contracts.
Why does SaaS - public cloud lead the deployment model category?
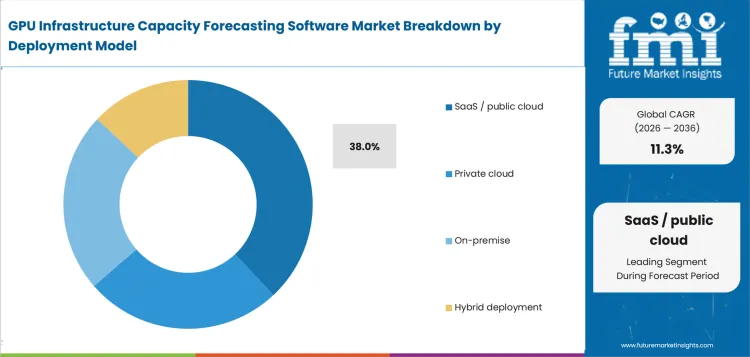
Multi-site AI operators need one forecasting view without maintaining separate analytics logic at every facility. Freshworks launched Advanced ITAM powered by Device42 in February 2025, extending hybrid IT asset management records into a centrally maintained discovery layer for distributed estates.
- Based on deployment model, SaaS - public cloud is projected to account for 38.0% in 2026 due to centrally maintained analytics for distributed AI capacity portfolios.
- Remote infrastructure teams compare headroom between sites during reservation planning without maintaining separate forecasting logic at every facility.
What makes monitoring & telemetry central to the platform function category?
Capacity forecasts lose credibility if software starts from stale asset records or nominal electrical values. Monitoring & telemetry links current rack power and environmental readings to data center infrastructure management records used for placement simulations and headroom checks.
- By platform function, monitoring & telemetry is estimated to hold 27.0% in 2026 owing to its direct role in establishing current infrastructure state.
- Sunbird Software released dcTrack 9.2.3 in April 2025, introducing the UniversalConnector G2, which provides bidirectional integration between dcTrack and multiple systems simultaneously, allowing capacity models to work from a current cross-system asset baseline.
What supports 251-500 kW in the AI rack density category?
The 251-500 kW band forces planners to test local distribution and AI data center liquid cooling limits before a rack reservation becomes deployable capacity. Schneider Electric launched high-density AI data-center solutions in June 2025, including direct-to-chip liquid cooling for denser rack infrastructure.
- In 2026, the 251-500 kW band is expected to lead AI rack density with 32.0% share because planned high-density racks tighten electrical and thermal headroom.
- Operators in this band need scenario tools that test how a planned GPU block changes remaining power and cooling capacity during pre-delivery planning.
How do hyperscale AI data centers shape the data center type category?
Hyperscale AI data centers require forecasts that extend from utility intake to individual deployment blocks. The broader data center infrastructure market uses phased builds where planners must identify which power and cooling sections can be commissioned next.
- By data center type, hyperscale AI data centers are forecast to represent 46.0% in 2026 driven by site-wide coordination needs at megawatt scale.
- Siemens and nVent announced a liquid cooling and power reference architecture in December 2025 purpose-built for hyperscale AI workloads, combining Siemens' industrial-grade electrical and automation systems with nVent liquid cooling technology to help operators deploy 100 MW hyperscale AI data centers faster and more sustainably.
What drives direct enterprise contract leadership in the commercial model category?
Direct enterprise contracts fit deployments where software providers configure connectors and capacity rules for one facility estate. Power quality monitoring belongs in the forecast input set because high-density racks expose electrical constraints the model must respect. Freshworks and Unisys announced a strategic relationship in February 2025 to resell Freshworks ITSM solutions including Freshservice and Device42, confirming an integrator-led route for clients preferring bundled IT service delivery.
- Direct enterprise contract is set to lead the commercial model category with 42.0% share in 2026 due to site-specific integration and accountable lifecycle support.
- Integrator-led routes suit clients that prefer one service relationship, but direct contracts preserve clearer ownership of forecast logic and connector maintenance.
What are the drivers, restraints and opportunities in the GPU Infrastructure Capacity Forecasting Software Market?
Rising accelerator power density makes usable headroom a financial planning constraint, grid and commissioning delays can defer software value, and closed-loop IT/OT models open a route from forecast to operational action.
- Driver: Higher accelerator density makes electrical and cooling headroom a financial constraint on GPU deployment schedules.
- Restraint: Grid timing and infrastructure-data gaps can delay trustworthy forecasts or defer usable GPU capacity.
- Opportunity: Integrated digital twins can turn capacity forecasts into earlier placement and commissioning decisions for operators.
Power Density Changes Deployment Timing
Accelerated servers are raising site power density faster than conventional infrastructure planning cycles can absorb. The International Energy Agency projected in April 2025 that electricity consumption from accelerated servers would grow about 30% annually through 2030. Capacity software earns budget only if current critical power and cooling limits are updated for reserved GPU blocks. Current limits reduce the risk of expensive compute waiting for facility headroom at delivery.
Grid Timing Limits Forecast Value
Grid connection timing can defeat a technically sound capacity plan since software cannot supply electrical headroom the utility has not delivered. Lawrence Berkeley National Laboratory reported in June 2026 that its large-load review identified more than 40 potential solutions for connection bottlenecks affecting data centers and other large loads. Forecasting software providers need scenario ranges that separate model confidence from the external utility schedule governing real commissioning dates.
Digital Twins Extend Forecast Use
Capacity forecasting becomes operationally useful once a model exchanges information with power-system and cooling controls. ETAP and Schneider Electric announced a grid-to-chip AI-factory digital twin in March 2025 that simulates power requirements with NVIDIA Omniverse. The same model can test planned GPU deployments against current electrical limits during workload placement and commissioning planning. A shared model extends forecasting into operating decisions without requiring separate capacity assumptions in downstream tools.
Which country CAGRs are covered in the GPU Infrastructure Capacity Forecasting Software Market?
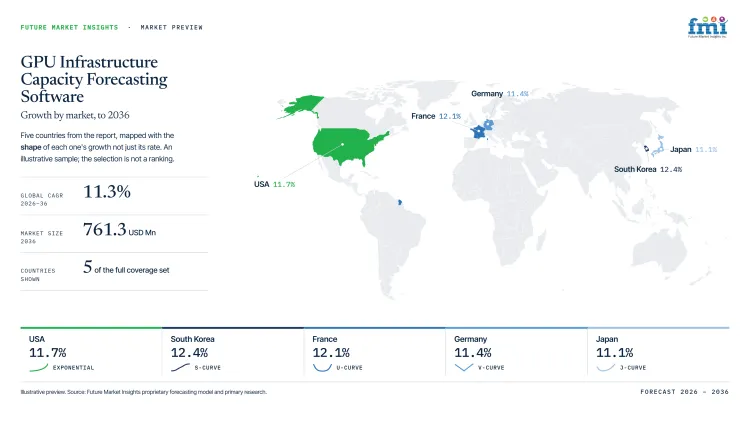
| Country | CAGR |
|---|---|
| UAE | 12.7% |
| South Korea | 12.4% |
| France | 12.1% |
| USA | 11.7% |
| Germany | 11.4% |
| Japan | 11.1% |
How do country-level CAGRs compare in the GPU Infrastructure Capacity Forecasting Software Market?
The 1.6-percentage-point spread between UAE and Japan separates new AI campuses from markets with mature facility estates. Planned capacity enters in coordinated blocks in UAE and South Korea alongside France. USA and Germany join Japan where grid readiness and compliance or siting constraints are visible.
- UAE favors design-stage modeling since gigawatt campus plans require staged electrical blocks before commissioning.
- South Korea concentrates GPU acquisition in national programs aligning compute allocation with facility power.
- France has Paris-region projects where phased connections separate announced megawatts from usable facility headroom.
- USA brownfield expansions face existing switchgear and cooling limits that complicate available floor space.
- Germany emphasizes auditable energy data since operators must document data-center efficiency and electricity consumption.
- Japan coordinates power and telecommunications siting so planners compare infrastructure availability during site selection decisions.
Comparable CAGRs produce different revenue timing since project scale and infrastructure readiness vary by country. The full report provides country-level CAGR analysis across North America, Latin America, Western Europe, Eastern Europe, East Asia, South Asia and Pacific, and the Middle East and Africa.
Country-wise Analysis
- USA data-center operators often expand GPU capacity inside facilities built for earlier server generations. The USA Energy Information Administration estimated in May 2026 that servers accounted for 7% of commercial-sector electricity use during 2025. Demand for GPU infrastructure capacity forecasting software in USA is forecast to rise at 11.7% CAGR over the forecast period, shaped by brownfield expansions with tighter electrical limits. Existing data center power management systems provide usable telemetry, but utility service limits and cooling upgrades progress on separate schedules. Capacity-software providers that preserve asset identities between forecast updates can reduce manual reconciliation during phased GPU additions at existing facilities.
- Korean public AI programs concentrate GPU pools that must be reconciled with power at participating data-center sites. Adoption of GPU infrastructure capacity forecasting software in South Korea is estimated to expand at 12.4% CAGR through 2036, supported by coordinated national compute investment. The Ministry of Science and ICT announced in February 2025 that Korea would secure 18,000 high-performance GPUs by the first half of 2026. Government-backed compute plans give local integrators a defined planning base for shared capacity and private-cloud headroom. Site allocation and power access can progress on different schedules, so useful forecasts must preserve data lineage as allocation changes.
- Japanese developers evaluate electricity and telecommunications availability together during site selection for new AI data-center locations. The Ministry of Economy, Trade and Industry joined the Ministry of Internal Affairs and Communications in publishing Watt-Bit Collaboration Report 1.0 during June 2025. GPU infrastructure capacity forecasting software sales in Japan are forecast to expand at 11.1% CAGR by 2036, influenced by coordinated infrastructure planning. Existing high-performance computing operations give planners a technical base for models that compare electrical headroom with network reach during regional site evaluation. Regional power and network lead times can diverge enough to make capacity reservations difficult to reverse once location decisions harden.
- French AI infrastructure plans now include several new campuses and substantial Paris-region data-center capacity that must enter service in phases. France is estimated to post 12.1% CAGR over the forecast period, reinforced by multi-site AI campus development and phased commissioning. France's economy ministry reported in May 2025 that four planned Paris-region data centers represented 584 MW of combined capacity. Grid delivery and cooling commissioning may follow different schedules even where data center liquid cooling designs support dense rack clusters. Forecasting-software providers need dependency models that expose utility and thermal milestones while accelerator installation dates are still adjustable for each campus.
- German data-center operators face energy-reporting duties that increase the value of consistent facility measurements and auditable records. Umweltbundesamt documented in May 2025 that the Energy Efficiency Act requires operators to submit annual electricity-consumption and efficiency data to the national data-center register. Fragmented identifiers can force manual reconciliation between capacity records and energy reporting even though engineering controls already provide an integration base. In Germany GPU infrastructure capacity forecasting software demand is predicted to advance at 11.4% CAGR through 2036, shaped by auditable facility-state requirements. Software that preserves measurement lineage reduces duplicate handling during annual register submissions and routine capacity forecast updates for facility teams.
- UAE capacity planning starts early in the design cycle as several AI campuses use large staged power blocks. UAE is projected to grow at 12.7% CAGR through 2036, driven by gigawatt-scale AI infrastructure commissioned in phases. The UAE Ministry of Foreign Affairs confirmed in May 2025 that a planned Abu Dhabi cluster would include a 1 GW AI data center inside a 5 GW campus. Direct-to-chip coolant fluids become relevant at those rack densities as thermal systems must reach readiness with each staged power block. Capacity records also need live commissioning data to replace design assumptions as staged electrical blocks enter service.
Who are the notable companies in the GPU Infrastructure Capacity Forecasting Software Market?
Sunbird Software, Siemens, Schneider Electric, and Device42, a Freshworks company are the notable companies in this market.
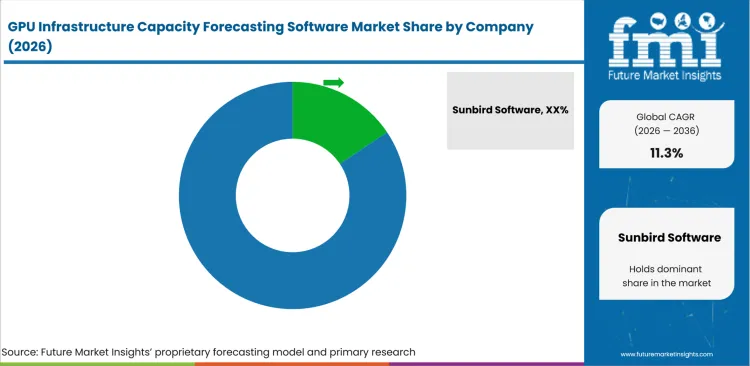
Competition separates specialist DCIM and infrastructure-discovery software from electrical groups that model power systems and AI facility controls. Sunbird Software and Freshworks' Device42 business compete through operational data quality and dependency relationships used for capacity decisions. Siemens and Schneider Electric extend forecasting into power-system models and facility controls that represent phased electrical constraints. Entry depends on current records that do not overstate capacity a facility can safely use.
- Sunbird Software and Freshworks' Device42 business focuses on current infrastructure records and dependency mapping for capacity decisions inside complex enterprise estates.
- Siemens contributes power-system engineering and digital-twin planning for facilities that require phased electrical infrastructure beside AI workloads.
- Schneider Electric links DCIM software with power and cooling control designs for high-density AI data-center operations.
Competitive Benchmarking: GPU Infrastructure Capacity Forecasting Software Market
| Company | Operational Data Integration | Infrastructure Relationship Modeling | Deployment / Controls Integration | Geographic Reach |
|---|---|---|---|---|
| Sunbird Software | High | High | Medium | North America with global enterprise deployments |
| Siemens | Medium | High | High | Global operations in major data-center regions |
| Schneider Electric | High | High | High | Global operations in major data-center regions |
| Device42, a Freshworks company | High | High | Medium | Global software customers through international IT operations |
Key Developments in the GPU Infrastructure Capacity Forecasting Software Market
- In June 2026, Siemens announced an NVIDIA Vera Rubin-aligned reference architecture with NVIDIA and Fluence that translated AI-factory requirements into deployable electrical power and controls design.
- In September 2025, Schneider Electric announced AI infrastructure reference designs with NVIDIA that integrate power management and liquid-cooling controls with NVIDIA Mission Control for high-density deployments.
- In September 2025, Device42 released version 19.07.10 with SaaS discovery and business-service improvements that extend the asset relationships available to hybrid infrastructure planning.
Key Players in the GPU Infrastructure Capacity Forecasting Software Market
Capacity Intelligence and Discovery Platforms
- Sunbird Software
- Device42, a Freshworks company
Electrical and Digital-Twin Infrastructure
- Siemens
DCIM and AI Facility Controls
- Schneider Electric
GPU Infrastructure Capacity Forecasting Software Market - Report Scope
| Coverage field | Report scope |
|---|---|
| Market breakdown | By platform function, deployment model, AI rack density, data center type, commercial model, and region. |
| Quantitative Units | Revenue in USD million and CAGR in %. |
| Market Definition | Revenue includes software subscriptions, licenses, maintenance, and software-related services sold specifically for forecasting usable GPU infrastructure capacity from facility and IT data. Hardware, cloud compute consumption, construction revenue, and unrelated infrastructure-management revenue are excluded. |
| Regions Covered | North America, Latin America, Western Europe, Eastern Europe, East Asia, South Asia and Pacific, and Middle East and Africa. |
| Countries Covered | USA, South Korea, Japan, France, Germany, UAE, and 25+ additional countries included in the full report. |
| Key Companies | Sunbird Software, Siemens, Schneider Electric, Device42, a Freshworks company. |
| Forecast Period | 2026 to 2036. |
| Approach | Primary and secondary research with market triangulation. |
GPU Infrastructure Capacity Forecasting Software Market - Research Methodology
| Method | Approach |
|---|---|
| Primary Research | FMI analysts gathered input from manufacturers, service providers, technology developers, distributors, end users, procurement teams, and subject-matter experts. Interviews examined purchasing decisions, product or service evaluation, adoption barriers, approval requirements, pricing considerations, and expectations for technical or commercial support. Respondents were also asked what evidence is required before a trial, pilot, or initial order develops into regular purchasing. |
| Desk Research | Desk research covered government statistics, regulatory publications, trade data, industry associations, technical literature, standards, company filings, product information, and official corporate announcements. Sources were reviewed for relevance, publication date, geographic coverage, and consistency with the defined market scope. Claims relating to performance, applications, approvals, capacity, investment, and commercial activity were retained only when supported by credible public evidence. |
| Market Sizing and Forecasting | The market model combined the baseline value with historical performance, segment structure, pricing and volume indicators, adoption levels, company participation, and country-level demand conditions. Forecast assumptions considered economic activity, investment trends, regulatory developments, technology adoption, purchasing cycles, supply availability, and barriers to wider market use. Segment and regional estimates were reconciled before the final market total was calculated. |
| Data Validation | Estimates were checked against multiple independent indicators, including public data, company activity, trade patterns, industry developments, and findings from primary interviews. Validation also tested whether products, services, applications, and company revenues fell within the defined market boundaries. Adjacent categories, unsupported claims, overlapping revenues, and activities without direct market relevance were excluded to reduce double counting and maintain consistency across segments and countries. |
GPU Infrastructure Capacity Forecasting Software Market by Segments
GPU Infrastructure Capacity Forecasting Software Market segmented by Platform Function:
- Monitoring & telemetry
- Planning & simulation
- Optimization & control
- Fault - reliability analytics
- Reporting & governance
GPU Infrastructure Capacity Forecasting Software Market segmented by Deployment Model:
- SaaS - public cloud
- Private cloud
- On-premise
- Hybrid deployment
GPU Infrastructure Capacity Forecasting Software Market segmented by AI Rack Density:
- 251-500 kW
- 100-250 kW
- Below 100 kW
- Above 500 kW
GPU Infrastructure Capacity Forecasting Software Market segmented by Data Center Type:
- Hyperscale AI data centers
- Colocation AI facilities
- Enterprise private AI
- HPC & research centers
GPU Infrastructure Capacity Forecasting Software Market segmented by Commercial Model:
- Direct enterprise contract
- System integrator - EPC-led
- Subscription - license
- Managed-service contract
GPU Infrastructure Capacity Forecasting Software Market by Region:
- North America
- United States
- Canada
- Latin America
- Brazil
- Mexico
- Argentina
- Chile
- Western Europe
- Germany
- France
- United Kingdom
- Italy
- Spain
- Benelux
- Nordics
- Eastern Europe
- Poland
- Czech Republic
- Romania
- Hungary
- East Asia
- China
- Japan
- South Korea
- South Asia and Pacific
- India
- ASEAN
- Australia and New Zealand
- Middle East and Africa
- GCC Countries
- South Africa
- Türkiye
- Israel
Research Sources and Bibliography
- International Energy Agency. (2026, April 16). Data centre electricity use surged in 2025, even with tightening bottlenecks driving a scramble for solutions.
- International Energy Agency. (2025, April 10). Energy and AI.
- USA Energy Information Administration. (2026, March 12). Fossil generation could rise with faster-than-expected growth in data center power demand.
- USA Energy Information Administration. (2026, May 19). Data center server energy use grows across the commercial building stock.
- Ministry of Science and ICT, Republic of Korea. (2025, February 20). Korea to Expand AI Computing Infrastructure to Strengthen National AI Capabilities and Achieve Global Leadership.
- Ministry of Economy, Trade and Industry, Japan. (2025, June 12). Report 1.0 of the Public-Private Advisory Council on Watt-Bit Collaboration Published.
- Ministry of the Economy, France. (2025, May 21). IA : des investissements records annoncés lors du Sommet Choose France 2025.
- Umweltbundesamt. (2025, May). Aufbau eines Registers für Rechenzentren in Deutschland und Entwicklung eines Bewertungssystems für energieeffiziente Rechenzentren.
- United Arab Emirates Ministry of Foreign Affairs. (2025, May 16). UAE/US Framework on Advanced Technology Cooperation.
- Sunbird Software. (2025, April 25). Sunbird dcTrack Release 9.2.3 Available Now.
- Sunbird Software. (2025, December 2). Sunbird dcTrack Release 9.3 Available Now.
- Freshworks. (2025, February 5). Freshservice gets an ITAM boost with Device42.
- Freshworks. (2025, February 26). Freshworks and Unisys Join Forces to Transform IT Service Management for Mid-Market and Enterprise Companies.
- Device42. (2025, April 2). ADM and UI enhancements - v19.05 MA.
- Device42. (2025, September 3). SaaS Discovery and Business Service Improvements - v19.07.10 MA.
- Device42. (2026, July 31). Reporting and Security enhancements - v19.10 MA.
- Schneider Electric. (2025, February 27). Schneider Electric Opens New Data Center and Microgrid Testing Labs at Global R&D Center in Massachusetts.
- Schneider Electric. (2025, March 18). ETAP and Schneider Electric Unveil Worlds First Digital Twin to Simulate AI Factory Power Requirements from Grid to Chip Level Using NVIDIA Omniverse.
- Schneider Electric. (2025, June 11). Schneider Electric Launches New Data Center Solutions to Meet Challenges of High-Density AI and Accelerated Compute Applications.
- Schneider Electric. (2025, September 18). Schneider Electric Announces New Reference Designs, Featuring Integrated Power Management and Liquid Cooling Controls, Supporting NVIDIA Mission Control and NVIDIA GB300 NVL72.
- Schneider Electric. (2025, October 13). Schneider Electric Highlights Innovation in 800 VDC Power Systems in support of NVIDIA’s next generation GPUs.
- Schneider Electric. (2026, June 15). Schneider Electric and Hon Hai Technology Group (Foxconn) announce strategic collaboration to accelerate next-generation AI data centers.
- Siemens. (2025, November 19). Siemens and Delta power solutions cut data center deployment time, costs, and carbon emissions.
- Siemens. (2025, December 9). Siemens and nVent to release joint reference architecture purpose-built for NVIDIA AI data centers.
- Siemens. (2026, March 17). Siemens and Rittal partner to design data center infrastructure of the future.
- Siemens. (2026, March 18). Siemens expands data center partner ecosystem to scale next-generation AI infrastructure.
- Siemens. (2026, June 1). Siemens and partners develop reference architecture purpose-built for NVIDIA AI data centers.
- Lawrence Berkeley National Laboratory. (2026, June). Speed to Power: Solutions for Accelerating Large Load Connections.
This bibliography is provided for reader reference and is not exhaustive. The full report contains the complete reference list and detailed citations.
This Report Answers
- What are the 2026 and 2036 values for GPU infrastructure capacity forecasting software?
- Which facility conditions increase demand for GPU infrastructure capacity forecasting software?
- Why does monitoring & telemetry hold its stated platform function share?
- Why does SaaS - public cloud hold its stated deployment model share?
- How does the 251-500 kW band change capacity planning?
- How do country CAGRs differ by infrastructure condition?
- How do Sunbird Software, Siemens, Schneider Electric, and Device42 differ?
- Which infrastructure constraints can delay software value or GPU activation?
Frequently Asked Questions
How big is the GPU Infrastructure Capacity Forecasting Software Market in 2026?
The GPU infrastructure capacity forecasting software market is valued at USD 261.0 million in 2026 and is projected to reach USD 761.3 million by 2036. AI infrastructure expansion raises software demand as usable power and cooling headroom limits the timing of GPU deployment.
What is the CAGR of the GPU Infrastructure Capacity Forecasting Software Market from 2026 to 2036?
The GPU infrastructure capacity forecasting software market is projected to grow at a CAGR of 11.3% between 2026 and 2036. Denser accelerator deployments require operators to test usable facility headroom during activation planning for additional GPU capacity at each site.
Which platform function leads the GPU Infrastructure Capacity Forecasting Software Market?
The monitoring & telemetry segment is expected to hold 27.0% of the GPU infrastructure capacity forecasting software market in 2026, attributable to current facility-state data. Operators use this current baseline for placement testing or approval of additional GPU capacity at a site.
Which deployment model leads the GPU Infrastructure Capacity Forecasting Software Market?
The SaaS - public cloud segment is projected to hold 38.0% of deployment model revenue in 2026, supported by centrally maintained analytics for distributed sites. Remote infrastructure teams compare site headroom without maintaining separate forecasting logic at every facility location.
Which companies are active in the GPU Infrastructure Capacity Forecasting Software Market?
Key companies operating in the market include Sunbird Software and Freshworks' Device42 business alongside Siemens and Schneider Electric. Their offerings span infrastructure discovery and data integration plus electrical-system modeling and facility-control support for high-density AI deployments.
Preview the report firsthand - request a free sample
Get SampleGet the brochure for pricing and purchase details.
Get PDFTable of Content
- Key Takeaways
- Market Size and CAGR
- Top Growth Driver
- Fastest Growing Segment
- Leading Region
- Key Companies
- Emerging Opportunities
- Executive Summary
- Global Market Outlook
- Demand-side Trends
- Supply-side Trends
- Technology Roadmap Analysis
- Analysis and Recommendations
- Analyst Perspective (What is happening? Why now? What should investors know?)
- Key Questions Answered
- How large is the market?
- What is the CAGR?
- What are key trends?
- Which region dominates?
- Who are the leaders?
- Market Overview
- Market Coverage / Taxonomy
- Market Definition / Scope / Limitations
- Research Methodology
- Chapter Orientation
- Analytical Lens and Working Hypotheses
- Market Structure, Signals, and Trend Drivers
- Benchmarking and Cross-market Comparability
- Market Sizing, Forecasting, and Opportunity Mapping
- Research Design and Evidence Framework
- Desk Research Programme (Secondary Evidence)
- Expert Input and Fieldwork (Primary Evidence)
- Tooling, Models, and Reference Databases
- Data Engineering and Model Build
- Quality Assurance and Audit Trail
- Market Background
- Market Dynamics (Drivers, Restraints, Opportunity, Trends)
- Scenario Forecast (Optimistic, Likely, Conservative)
- Impact Analysis
- AI Impact
- Sustainability Impact
- Regulatory Impact
- Technology Impact
- Consumer / Buyer Analysis
- Purchase Drivers
- Adoption Barriers
- Buyer Journey
- Opportunity Map Analysis
- Product Life Cycle Analysis
- Supply Chain Analysis
- Investment Feasibility Matrix
- Value Chain Analysis
- PESTLE and Porter's Analysis
- Regulatory Landscape
- Regional Parent Market Outlook
- Production and Consumption Statistics
- Import and Export Statistics
- Global Market Analysis and Forecast, 2021 to 2036
- Historical Market Size Value (USD Million) Analysis, 2021 to 2025
- Current and Future Market Size Value (USD Million) Projections, 2026 to 2036
- Y-o-Y Growth Trend Analysis
- Absolute $ Opportunity Analysis
- Global Market Pricing Analysis, 2021 to 2036
- Global Market Analysis and Forecast, By Platform Function, 2021 to 2036
- Introduction / Key Findings
- Historical Market Size Value (USD Million) Analysis By Platform Function, 2021 to 2025
- Current and Future Market Size Value (USD Million) Analysis and Forecast By Platform Function, 2026 to 2036
- Monitoring & telemetry
- Planning & simulation
- Optimization & control
- Fault / reliability analytics
- Reporting & governance
- Monitoring & telemetry
- Y-o-Y Growth Trend Analysis By Platform Function, 2021 to 2025
- Absolute $ Opportunity Analysis By Platform Function, 2026 to 2036
- Global Market Analysis and Forecast, By Deployment Model, 2021 to 2036
- Introduction / Key Findings
- Historical Market Size Value (USD Million) Analysis By Deployment Model, 2021 to 2025
- Current and Future Market Size Value (USD Million) Analysis and Forecast By Deployment Model, 2026 to 2036
- SaaS / public cloud
- Private cloud
- On-premise
- Hybrid deployment
- SaaS / public cloud
- Y-o-Y Growth Trend Analysis By Deployment Model, 2021 to 2025
- Absolute $ Opportunity Analysis By Deployment Model, 2026 to 2036
- Global Market Analysis and Forecast, By AI Rack Density, 2021 to 2036
- Introduction / Key Findings
- Historical Market Size Value (USD Million) Analysis By AI Rack Density, 2021 to 2025
- Current and Future Market Size Value (USD Million) Analysis and Forecast By AI Rack Density, 2026 to 2036
- 251-500 kW
- 100-250 kW
- Below 100 kW
- Above 500 kW
- 251-500 kW
- Y-o-Y Growth Trend Analysis By AI Rack Density, 2021 to 2025
- Absolute $ Opportunity Analysis By AI Rack Density, 2026 to 2036
- Global Market Analysis and Forecast, By Data Center Type, 2021 to 2036
- Introduction / Key Findings
- Historical Market Size Value (USD Million) Analysis By Data Center Type, 2021 to 2025
- Current and Future Market Size Value (USD Million) Analysis and Forecast By Data Center Type, 2026 to 2036
- Hyperscale AI data centers
- Colocation AI facilities
- Enterprise private AI
- HPC & research centers
- Hyperscale AI data centers
- Y-o-Y Growth Trend Analysis By Data Center Type, 2021 to 2025
- Absolute $ Opportunity Analysis By Data Center Type, 2026 to 2036
- Global Market Analysis and Forecast, By Commercial Model, 2021 to 2036
- Introduction / Key Findings
- Historical Market Size Value (USD Million) Analysis By Commercial Model, 2021 to 2025
- Current and Future Market Size Value (USD Million) Analysis and Forecast By Commercial Model, 2026 to 2036
- Direct enterprise contract
- System integrator / EPC-led
- Subscription / license
- Managed-service contract
- Direct enterprise contract
- Y-o-Y Growth Trend Analysis By Commercial Model, 2021 to 2025
- Absolute $ Opportunity Analysis By Commercial Model, 2026 to 2036
- Global Market Analysis and Forecast, By Region, 2021 to 2036
- Introduction
- Historical Market Size Value (USD Million) Analysis By Region, 2021 to 2025
- Current Market Size Value (USD Million) Analysis and Forecast By Region, 2026 to 2036
- North America
- Latin America
- Western Europe
- Eastern Europe
- East Asia
- South Asia and Pacific
- Middle East & Africa
- Market Attractiveness Analysis By Region
- North America Market Analysis and Forecast, By Country, 2021 to 2036
- Historical Market Size Value (USD Million) Trend Analysis By Market Taxonomy, 2021 to 2025
- Market Size Value (USD Million) Forecast By Market Taxonomy, 2026 to 2036
- By Country
- USA
- Canada
- By Platform Function
- By Deployment Model
- By AI Rack Density
- By Data Center Type
- By Commercial Model
- By Country
- Market Attractiveness Analysis
- By Country
- By Platform Function
- By Deployment Model
- By AI Rack Density
- By Data Center Type
- By Commercial Model
- Key Takeaways
- Latin America Market Analysis and Forecast, By Country
- Historical Market Size Value (USD Million) Trend Analysis By Market Taxonomy, 2021 to 2025
- Market Size Value (USD Million) Forecast By Market Taxonomy, 2026 to 2036
- By Country
- Brazil
- Mexico
- Chile
- Rest of Latin America
- By Platform Function
- By Deployment Model
- By AI Rack Density
- By Data Center Type
- By Commercial Model
- By Country
- Market Attractiveness Analysis
- By Country
- By Platform Function
- By Deployment Model
- By AI Rack Density
- By Data Center Type
- By Commercial Model
- Key Takeaways
- Western Europe Market Analysis and Forecast, By Country
- Historical Market Size Value (USD Million) Trend Analysis By Market Taxonomy, 2021 to 2025
- Market Size Value (USD Million) Forecast By Market Taxonomy, 2026 to 2036
- By Country
- Germany
- UK
- Italy
- Spain
- France
- Nordic
- BENELUX
- Rest of Western Europe
- By Platform Function
- By Deployment Model
- By AI Rack Density
- By Data Center Type
- By Commercial Model
- By Country
- Market Attractiveness Analysis
- By Country
- By Platform Function
- By Deployment Model
- By AI Rack Density
- By Data Center Type
- By Commercial Model
- Key Takeaways
- Eastern Europe Market Analysis and Forecast, By Country
- Historical Market Size Value (USD Million) Trend Analysis By Market Taxonomy, 2021 to 2025
- Market Size Value (USD Million) Forecast By Market Taxonomy, 2026 to 2036
- By Country
- Russia
- Poland
- Hungary
- Balkan & Baltic
- Rest of Eastern Europe
- By Platform Function
- By Deployment Model
- By AI Rack Density
- By Data Center Type
- By Commercial Model
- By Country
- Market Attractiveness Analysis
- By Country
- By Platform Function
- By Deployment Model
- By AI Rack Density
- By Data Center Type
- By Commercial Model
- Key Takeaways
- East Asia Market Analysis and Forecast, By Country
- Historical Market Size Value (USD Million) Trend Analysis By Market Taxonomy, 2021 to 2025
- Market Size Value (USD Million) Forecast By Market Taxonomy, 2026 to 2036
- By Country
- China
- Japan
- South Korea
- By Platform Function
- By Deployment Model
- By AI Rack Density
- By Data Center Type
- By Commercial Model
- By Country
- Market Attractiveness Analysis
- By Country
- By Platform Function
- By Deployment Model
- By AI Rack Density
- By Data Center Type
- By Commercial Model
- Key Takeaways
- South Asia and Pacific Market Analysis and Forecast, By Country
- Historical Market Size Value (USD Million) Trend Analysis By Market Taxonomy, 2021 to 2025
- Market Size Value (USD Million) Forecast By Market Taxonomy, 2026 to 2036
- By Country
- India
- ASEAN
- Australia & New Zealand
- Rest of South Asia and Pacific
- By Platform Function
- By Deployment Model
- By AI Rack Density
- By Data Center Type
- By Commercial Model
- By Country
- Market Attractiveness Analysis
- By Country
- By Platform Function
- By Deployment Model
- By AI Rack Density
- By Data Center Type
- By Commercial Model
- Key Takeaways
- Middle East & Africa Market Analysis and Forecast, By Country
- Historical Market Size Value (USD Million) Trend Analysis By Market Taxonomy, 2021 to 2025
- Market Size Value (USD Million) Forecast By Market Taxonomy, 2026 to 2036
- By Country
- Kingdom of Saudi Arabia
- Other GCC Countries
- Türkiye
- South Africa
- Other African Union
- Rest of Middle East & Africa
- By Platform Function
- By Deployment Model
- By AI Rack Density
- By Data Center Type
- By Commercial Model
- By Country
- Market Attractiveness Analysis
- By Country
- By Platform Function
- By Deployment Model
- By AI Rack Density
- By Data Center Type
- By Commercial Model
- Key Takeaways
- Key Countries Market Analysis
- USA
- Pricing Analysis
- Market Share Analysis, 2025
- By Platform Function
- By Deployment Model
- By AI Rack Density
- By Data Center Type
- By Commercial Model
- Canada
- Pricing Analysis
- Market Share Analysis, 2025
- By Platform Function
- By Deployment Model
- By AI Rack Density
- By Data Center Type
- By Commercial Model
- Mexico
- Pricing Analysis
- Market Share Analysis, 2025
- By Platform Function
- By Deployment Model
- By AI Rack Density
- By Data Center Type
- By Commercial Model
- Brazil
- Pricing Analysis
- Market Share Analysis, 2025
- By Platform Function
- By Deployment Model
- By AI Rack Density
- By Data Center Type
- By Commercial Model
- Chile
- Pricing Analysis
- Market Share Analysis, 2025
- By Platform Function
- By Deployment Model
- By AI Rack Density
- By Data Center Type
- By Commercial Model
- Germany
- Pricing Analysis
- Market Share Analysis, 2025
- By Platform Function
- By Deployment Model
- By AI Rack Density
- By Data Center Type
- By Commercial Model
- UK
- Pricing Analysis
- Market Share Analysis, 2025
- By Platform Function
- By Deployment Model
- By AI Rack Density
- By Data Center Type
- By Commercial Model
- Italy
- Pricing Analysis
- Market Share Analysis, 2025
- By Platform Function
- By Deployment Model
- By AI Rack Density
- By Data Center Type
- By Commercial Model
- Spain
- Pricing Analysis
- Market Share Analysis, 2025
- By Platform Function
- By Deployment Model
- By AI Rack Density
- By Data Center Type
- By Commercial Model
- France
- Pricing Analysis
- Market Share Analysis, 2025
- By Platform Function
- By Deployment Model
- By AI Rack Density
- By Data Center Type
- By Commercial Model
- India
- Pricing Analysis
- Market Share Analysis, 2025
- By Platform Function
- By Deployment Model
- By AI Rack Density
- By Data Center Type
- By Commercial Model
- ASEAN
- Pricing Analysis
- Market Share Analysis, 2025
- By Platform Function
- By Deployment Model
- By AI Rack Density
- By Data Center Type
- By Commercial Model
- Australia & New Zealand
- Pricing Analysis
- Market Share Analysis, 2025
- By Platform Function
- By Deployment Model
- By AI Rack Density
- By Data Center Type
- By Commercial Model
- China
- Pricing Analysis
- Market Share Analysis, 2025
- By Platform Function
- By Deployment Model
- By AI Rack Density
- By Data Center Type
- By Commercial Model
- Japan
- Pricing Analysis
- Market Share Analysis, 2025
- By Platform Function
- By Deployment Model
- By AI Rack Density
- By Data Center Type
- By Commercial Model
- South Korea
- Pricing Analysis
- Market Share Analysis, 2025
- By Platform Function
- By Deployment Model
- By AI Rack Density
- By Data Center Type
- By Commercial Model
- Russia
- Pricing Analysis
- Market Share Analysis, 2025
- By Platform Function
- By Deployment Model
- By AI Rack Density
- By Data Center Type
- By Commercial Model
- Poland
- Pricing Analysis
- Market Share Analysis, 2025
- By Platform Function
- By Deployment Model
- By AI Rack Density
- By Data Center Type
- By Commercial Model
- Hungary
- Pricing Analysis
- Market Share Analysis, 2025
- By Platform Function
- By Deployment Model
- By AI Rack Density
- By Data Center Type
- By Commercial Model
- Kingdom of Saudi Arabia
- Pricing Analysis
- Market Share Analysis, 2025
- By Platform Function
- By Deployment Model
- By AI Rack Density
- By Data Center Type
- By Commercial Model
- Türkiye
- Pricing Analysis
- Market Share Analysis, 2025
- By Platform Function
- By Deployment Model
- By AI Rack Density
- By Data Center Type
- By Commercial Model
- South Africa
- Pricing Analysis
- Market Share Analysis, 2025
- By Platform Function
- By Deployment Model
- By AI Rack Density
- By Data Center Type
- By Commercial Model
- USA
- Market Structure Analysis
- Competition Dashboard
- Competition Benchmarking
- Market Share Analysis of Top Players
- By Regional
- By Platform Function
- By Deployment Model
- By AI Rack Density
- By Data Center Type
- By Commercial Model
- Emerging Startups
- Innovation Benchmarking
- Competition Analysis
- Competition Deep Dive
- Sunbird Software
- Overview
- Product Portfolio
- Profitability by Market Segments
- Sales Footprint
- Strategy Overview
- Marketing Strategy
- Product Strategy
- Channel Strategy
- Siemens
- Schneider Electric
- Device42
- Sunbird Software
- Case Studies
- Success Stories
- Recent Developments
- Competition Deep Dive
- Assumptions & Acronyms Used


