

- Market Size (2026)
- USD 100.6 Mn
- Forecast (2036)
- USD 341.5 Mn
- CAGR (2026 to 2036)
- 13.0%
How big is GPU Rack Resilience Testing Services Market in 2026?
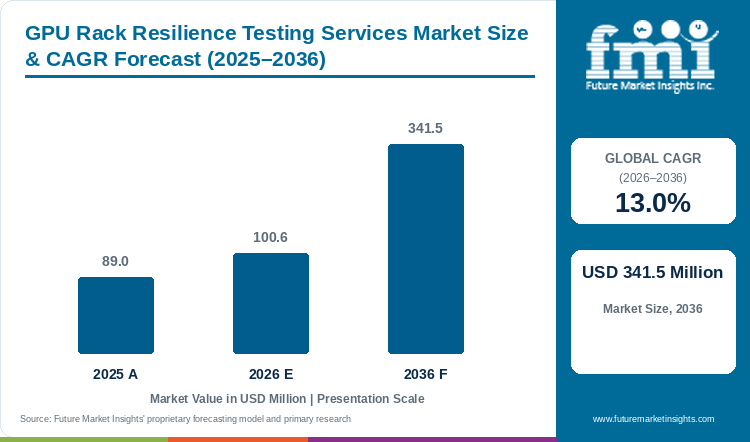
The market was valued at USD 89.0 Million in 2025 and is expected to reach USD 100.6 Million in 2026, with growth at a 13.0% CAGR from 2026 to 2036 taking its value to USD 341.5 Million by 2036.
Full-load operation does not establish how a rack behaves when supporting equipment fails, which is the distinct question addressed through controlled resilience scenarios. Owners need to specify whether acceptance requires uninterrupted work or recovery after an allowed interruption, then agree permissions, stop conditions and restoration steps that protect neighboring systems. Shared dependencies and control sequences can undermine redundancy even when duplicate components are installed, making the record useful when it identifies a weakness that can be corrected and retested. New halls allow early scenario planning, whereas operating facilities may require restricted windows or representative simulations. South Korean procurement and Japanese power coordination illustrate how local project conditions affect physical testing. The forecast covers defined resilience validation and associated engineering or acceptance, excluding compute hardware, general construction and maintenance without that purpose. [5]
Key Market Trends & Insights
- Commissioning & acceptance holds 27.0% of service scope in 2026, providing a formal opportunity to demonstrate agreed failure and recovery scenarios before production release.
- New AI hall build holds 36.0% of project stage in 2026, allowing isolation points and restoration procedures to be planned while construction access remains available.
- 251–500 kW holds 32.0% of AI rack density in 2026, making protection coordination and heat-rejection margin relevant to the consequences of a controlled fault.
- Hyperscale AI data centers account for 46.0% of data center type in 2026, where shared plant can create dependencies beyond the redundant components installed in one rack.
Regional Highlights
- Saudi Arabia has the highest profiled CAGR at 14.6% during 2026–2036.
- The next two profiled growth rates are South Korea at 14.3% and UAE at 14.0% over the same period.
Market Size & Forecast
| Metric | Value |
|---|---|
| 2025 market value | USD 89.0 Million |
| 2026 market estimate | USD 100.6 Million |
| 2036 market forecast | USD 341.5 Million |
| Forecast CAGR, 2026–2036 | 13.0% |
The market covers GPU-rack resilience testing and associated engineering verification, commissioning, acceptance and requalification services. Compute hardware, facility construction and general maintenance without the defined resilience-validation purpose are excluded.
Rack resilience testing includes the response of data-center power to interruptions and transitions, not only the availability of redundant hardware.
Infrastructure readiness and acceptance
| Documented operating context | Source |
|---|---|
| ETAP and Schneider Electric announced a grid-to-chip AI-factory power digital twin in March 2025. | [1] |
| Jacobs released an AI data-center digital-twin solution in March 2026 covering compute, power and cooling interactions. | [2] |
| NVIDIA’s DCGM documentation describes GPU diagnostic tests and their operational requirements. | [3] |
| Vertiv launched a liquid-cooling services portfolio in February 2025 covering deployment and ongoing system support. | [4] |
Analyst Perspective
A resilience test needs a safe intervention boundary and an agreed account of what successful recovery means for both equipment and workloads. Recording the initial state, restoration sequence and unresolved exceptions makes the result useful for handover and later changes, with authority to stop the exercise established before a fault is introduced.
- Nikhil Kaitwade, Principal Analyst at Future Market Insights
How is the GPU rack resilience testing services market segmented?
Service Scope covers Commissioning & acceptance, Design & engineering, Performance validation, Retrofit & migration and Managed support. Project Stage covers New AI hall build, Rack/pod deployment, Capacity expansion, Legacy conversion and Ongoing operations. AI Rack Density covers 251–500 kW, 100–250 kW, Below 100 kW and Above 500 kW. Data Center Type covers Hyperscale AI data centers, Colocation AI facilities, Enterprise private AI and HPC & research centers. Commercial Model covers Direct enterprise contract, System integrator / EPC-led, Subscription / license and Managed-service contract.
The operating history in data-center infrastructure management can help select representative failure scenarios and preserve the exceptions found during testing.
Why does Commissioning & acceptance lead service scope demand?
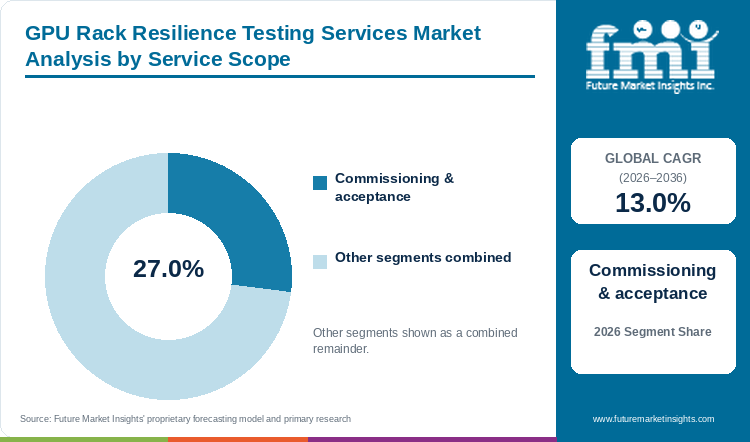
Commissioning & acceptance: 27.0% of service scope in 2026.
Commissioning offers a formal opportunity to witness a specified failure and recovery sequence before production release, with the expected workload outcome agreed in advance. Installed redundancy cannot demonstrate that transfer will work, so the record needs the condition introduced, the response observed and any scenarios outside the permitted boundary. Distinguishing continuity from recovery after interruption gives operators evidence they can use without implying that one exercise covers every possible failure.
- The Commissioning & acceptance segment accounts for 27.0% of service scope in 2026.
- The owner should agree whether a scenario is intended to prove continuity of workload operation or recovery after a permitted interruption.
Why does New AI hall build lead project stage demand?
New AI hall build: 36.0% of project stage in 2026.
Early planning in a new hall makes isolation points, temporary loads and restoration procedures part of the project while access remains available. A stable electrical and cooling baseline still needs to be established before a fault is introduced, allowing the team to distinguish an incomplete installation from a failure of the intended design. Coordination with the future operator reduces pressure to omit a meaningful scenario merely because handover is approaching.
- The New AI hall build segment accounts for 36.0% of project stage in 2026.
- Planning isolation and restoration early can make a meaningful failure test possible without exposing equipment outside the agreed scope.
What are the drivers, restraints, and opportunities in the GPU rack resilience testing services market?
Rack resilience depends on controlled failure behavior
Redundancy has value only when the installation transfers or recovers as intended. AI racks sharing power and cooling plant can be affected by a failure beyond their own enclosure. Owners therefore need to test the actual response rather than rely only on design diagrams. A controlled exercise can reveal incorrect settings or shared dependencies before production work is exposed. The purchase is justified by that evidence and the ability to correct deficiencies. It should show what happens after the protective response as well as whether an alarm was raised.
Destructive scenarios and test windows limit coverage
A resilience exercise needs permission, defined affected systems and stop conditions, with a restoration plan for unexpected behavior. Narrow live-site windows or unfinished electrical and cooling work can reduce valid coverage, making scope and rescheduling responsibilities part of the contract. Distinguishing corrective installation from verification allows a safely bounded test to produce evidence that the owner can interpret and act on.
Structured recovery tests strengthen owner acceptance
Resilience evidence can be renewed when racks are refreshed or supporting systems change. Providers can use digital models to prepare the relevant scenarios and compare them with physical observations. The recurring service should focus on changes that affect the original result rather than repeat every procedure automatically. Linking the test script to sensor records and witnessed criteria makes the outcome easier to review. This gives owners a practical way to keep the evidence current. A single commissioning exercise should not be treated as proof of resilience for the entire life of the installation.
Resilience work extends AI infrastructure commissioning by examining controlled failures and recovery paths rather than limiting acceptance to normal operation.
Which country and market CAGRs are profiled for GPU rack resilience testing services?
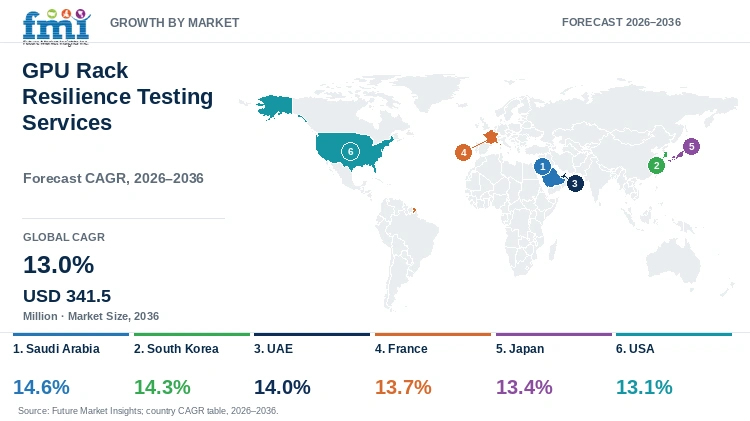
| Country | CAGR |
|---|---|
| Saudi Arabia | 14.6% |
| South Korea | 14.3% |
| UAE | 14.0% |
| France | 13.7% |
| Japan | 13.4% |
| USA | 13.1% |
Country-wise Analysis
Saudi Arabia
- Saudi Arabian programs may coordinate resilience work across racks, bringing coolant preparation and power-interruption scenarios into one recovery plan. The fastest profiled forecast is a 14.6% CAGR from 2026 to 2036, with water handling and thermal conditions influencing representative tests. The record needs to show the state of both workloads and infrastructure afterward, since detecting the failure does not establish a usable return to service.
South Korea
- Public-private compute expansion in South Korea requires validation plans to follow site readiness, procurement eligibility and power-system reviews. The country’s 14.3% CAGR forecast for 2026 to 2036 includes work where some scenarios can be performed safely on site while others need staged simulation. Agreeing that boundary early allows meaningful preparation without treating restricted physical coverage as evidence for every resilience question.
UAE
- Phased UAE campuses need repeatable scenarios that match the power and cooling released at each stage, with owner-operators and designers agreeing the sequence before rack arrival. Within the 14.0% CAGR forecast for 2026 to 2036, shared infrastructure makes configuration records and unresolved exceptions useful across suppliers. An interim arrangement must remain identifiable so later replacement with the final system prompts review of the original result.
France
- A firm power and cooling design gives French providers the basis for site-specific resilience scenarios, followed by safe limits and authority to stop an exercise. Buyers need to decide whether the intended outcome is continuous service or eventual equipment recovery within France’s 13.7% CAGR forecast for 2026 to 2036. Recording that distinction supports handover and maintenance planning more clearly than a generic certification claim.
Japan
- Power availability and network siting can affect the order of Japanese resilience tests, while operating facilities may require tightly controlled windows. Japan is forecast to grow at a 13.4% CAGR from 2026 to 2036 as contractors establish initial states and recovery expectations before intervention. New cooling loops connected to retained plant need particular attention, with outstanding conditions kept visible in the operating record.
USA
- American resilience contracts may be awarded before a new installation or upgrade is ready for physical tests, requiring controlled baselines at energization and coordination across computing and facilities teams. The 13.1% CAGR forecast for 2026 to 2036 accompanies repeat scenarios that retain local protection limits. Traceable recovery criteria then support later changes without turning the exercise into an unintended combination of faults.
Who are the notable companies in the GPU rack resilience testing services market?
Vertiv; Siemens; Jacobs; Schneider Electric; Eaton
A resilience provider must design a representative failure without creating unnecessary risk outside the test boundary. The owner's requirements should determine the scenario and expected recovery. This calls for operational judgment as well as familiarity with the equipment being tested.
Competitive Benchmarking: GPU Rack Resilience Testing Services Market
| Participant | Commercial focus | Buyer qualification priority |
|---|---|---|
| Vertiv | Power, cooling and infrastructure services | Integrated commissioning and service access |
| Siemens | Electrical and building-system integration | Protection logic and controls handover |
| Jacobs | Engineering and facility integration | Cross-system acceptance and owner requirements |
| Schneider Electric | Power, cooling and prefabricated infrastructure | Interface definition and system-level testing |
| Eaton | Power infrastructure and services | Protection coordination and recovery behavior |
Key Developments in the GPU Rack Resilience Testing Services Market
- ETAP and Schneider Electric announced a grid-to-chip AI-factory power digital twin in March 2025. [1]
- Jacobs released an AI data-center digital-twin solution in March 2026 covering compute, power and cooling interactions. [2]
Key Players in the GPU Rack Resilience Testing Services Market
- Vertiv
- Siemens
- Jacobs
- Schneider Electric
- Eaton
GPU Rack Resilience Testing Services Market - Report Scope
| Coverage field | Report scope |
|---|---|
| Market breakdown | Service Scope; Project Stage; AI Rack Density; Data Center Type; Commercial Model; Region |
| Quantitative unit | USD Million |
| Market definition | The market covers GPU-rack resilience testing and associated engineering verification, commissioning, acceptance and requalification services. Compute hardware, facility construction and general maintenance without the defined resilience-validation purpose are excluded. |
| Regions covered | North America; Latin America; Western Europe; Eastern Europe; East Asia; South Asia and Pacific; Middle East and Africa |
| Countries / markets profiled | Saudi Arabia; South Korea; UAE; France; Japan; USA |
| Key companies profiled | Vertiv; Siemens; Jacobs; Schneider Electric; Eaton |
| Base year / forecast period | 2026 / 2026–2036 |
| Estimate coverage | 2025 and 2026 market estimates; 2036 forecast; segment shares and country / market CAGRs. |
GPU Rack Resilience Testing Services Market - Research Methodology
| Method | Application |
|---|---|
| Market definition | The analysis follows the stated product or service boundary and distinguishes direct category revenue from adjacent activities. |
| Secondary research | Official technical, regulatory, research and company publications provide the documented operating context and recent developments cited in this report. |
| Forecast and segmentation | Market estimates, segment shares and geographic forecasts are presented as analytical estimates within the stated commercial scope. |
| Competitive assessment | Participants are compared by their relevant products or services, commercial role and buyer qualification requirements. |
| Interpretation | The assessment considers purchasing conditions and the scope of the documented product, service or performance claim. |
GPU Rack Resilience Testing Services Market by Segments
Service Scope
- Commissioning & acceptance
- Design & engineering
- Performance validation
- Retrofit & migration
- Managed support
Project Stage
- New AI hall build
- Rack/pod deployment
- Capacity expansion
- Legacy conversion
- Ongoing operations
AI Rack Density
- 251–500 kW
- 100–250 kW
- Below 100 kW
- Above 500 kW
Data Center Type
- Hyperscale AI data centers
- Colocation AI facilities
- Enterprise private AI
- HPC & research centers
Commercial Model
- Direct enterprise contract
- System integrator / EPC-led
- Subscription / license
- Managed-service contract
GPU Rack Resilience Testing Services Market by Region
- North America
- United States
- Canada
- Latin America
- Brazil
- Mexico
- Argentina
- Chile
- Western Europe
- Germany
- France
- United Kingdom
- Italy
- Spain
- Benelux
- Nordics
- Eastern Europe
- Poland
- Czech Republic
- Romania
- Hungary
- East Asia
- China
- Japan
- South Korea
- South Asia and Pacific
- India
- ASEAN
- Australia and New Zealand
- Middle East and Africa
- GCC Countries
- South Africa
- Türkiye
- Israel
Research Sources and Bibliography
- [1] Schneider Electric. (2025, March 18). ETAP and Schneider Electric Unveil World’s First Digital Twin to Simulate AI Factory Power Requirements from Grid to Chip Level Using NVIDIA Omniverse.
- [2] Jacobs. (2026, March 16). Jacobs releases digital twin solution for AI data centers.
- [3] NVIDIA. (n.d.). Data Center GPU Manager User Guide: DCGM Diagnostics.
- [4] Vertiv. (2025, February 11). Vertiv announces global launch of liquid cooling services portfolio.
- [5] Future Market Insights. (2026). GPU Rack Resilience Testing Services Market: Global industry analysis and opportunity assessment, 2026–2036.
This Report Answers
- How large is the GPU rack resilience testing services market in 2026?
- What value and CAGR are forecast through 2036?
- Which service scope segment leads in 2026?
- Which project stage segment has the largest share?
- Which profiled country or market has the fastest forecast growth?
- Which participants are covered in the competitive assessment?
Frequently Asked Questions
How large is the GPU rack resilience testing services market in 2026?
The market was valued at USD 89.0 Million in 2025 and is expected to reach USD 100.6 Million in 2026.
What value and CAGR are forecast through 2036?
The market is projected to reach USD 341.5 Million by 2036, with a 13.0% CAGR during 2026–2036.
Which service scope segment leads in 2026?
The Commissioning & acceptance segment accounts for 27.0% of service scope in 2026.
Which project stage segment has the largest share?
The New AI hall build segment accounts for 36.0% of project stage in 2026.
Which profiled country or market has the fastest forecast growth?
Saudi Arabia has the highest profiled CAGR at 14.6% during 2026–2036.
Which participants are covered in the competitive assessment?
The assessment covers Vertiv, Siemens, Jacobs, Schneider Electric and Eaton.
Preview the report firsthand - request a free sample
Get SampleGet the brochure for pricing and purchase details.
Get PDFTable of Content
- Key Takeaways
- Market Size and CAGR
- Top Growth Driver
- Fastest Growing Segment
- Leading Region
- Key Companies
- Emerging Opportunities
- Executive Summary
- Global Market Outlook
- Demand-side Trends
- Supply-side Trends
- Technology Roadmap Analysis
- Analysis and Recommendations
- Analyst Perspective (What is happening? Why now? What should investors know?)
- Key Questions Answered
- How large is the market?
- What is the CAGR?
- What are key trends?
- Which region dominates?
- Who are the leaders?
- Market Overview
- Market Coverage / Taxonomy
- Market Definition / Scope / Limitations
- Research Methodology
- Chapter Orientation
- Analytical Lens and Working Hypotheses
- Market Structure, Signals, and Trend Drivers
- Benchmarking and Cross-market Comparability
- Market Sizing, Forecasting, and Opportunity Mapping
- Research Design and Evidence Framework
- Desk Research Programme (Secondary Evidence)
- Expert Input and Fieldwork (Primary Evidence)
- Tooling, Models, and Reference Databases
- Data Engineering and Model Build
- Quality Assurance and Audit Trail
- Market Background
- Market Dynamics (Drivers, Restraints, Opportunity, Trends)
- Scenario Forecast (Optimistic, Likely, Conservative)
- Impact Analysis
- AI Impact
- Sustainability Impact
- Regulatory Impact
- Technology Impact
- Consumer / Buyer Analysis
- Purchase Drivers
- Adoption Barriers
- Buyer Journey
- Opportunity Map Analysis
- Product Life Cycle Analysis
- Supply Chain Analysis
- Investment Feasibility Matrix
- Value Chain Analysis
- PESTLE and Porter's Analysis
- Regulatory Landscape
- Regional Parent Market Outlook
- Production and Consumption Statistics
- Import and Export Statistics
- Global Market Analysis and Forecast, 2021 to 2036
- Historical Market Size Value (USD Million) Analysis, 2021 to 2025
- Current and Future Market Size Value (USD Million) Projections, 2026 to 2036
- Y-o-Y Growth Trend Analysis
- Absolute $ Opportunity Analysis
- Global Market Pricing Analysis, 2021 to 2036
- Global Market Analysis and Forecast, By Service Scope, 2021 to 2036
- Introduction / Key Findings
- Historical Market Size Value (USD Million) Analysis By Service Scope, 2021 to 2025
- Current and Future Market Size Value (USD Million) Analysis and Forecast By Service Scope, 2026 to 2036
- Commissioning & acceptance
- Design & engineering
- Performance validation
- Retrofit & migration
- Managed support
- Y-o-Y Growth Trend Analysis By Service Scope, 2021 to 2025
- Absolute $ Opportunity Analysis By Service Scope, 2026 to 2036
- Global Market Analysis and Forecast, By Project Stage, 2021 to 2036
- Introduction / Key Findings
- Historical Market Size Value (USD Million) Analysis By Project Stage, 2021 to 2025
- Current and Future Market Size Value (USD Million) Analysis and Forecast By Project Stage, 2026 to 2036
- New AI hall build
- Rack/pod deployment
- Capacity expansion
- Legacy conversion
- Ongoing operations
- Y-o-Y Growth Trend Analysis By Project Stage, 2021 to 2025
- Absolute $ Opportunity Analysis By Project Stage, 2026 to 2036
- Global Market Analysis and Forecast, By AI Rack Density, 2021 to 2036
- Introduction / Key Findings
- Historical Market Size Value (USD Million) Analysis By AI Rack Density, 2021 to 2025
- Current and Future Market Size Value (USD Million) Analysis and Forecast By AI Rack Density, 2026 to 2036
- 251–500 kW
- 100–250 kW
- Below 100 kW
- Above 500 kW
- Y-o-Y Growth Trend Analysis By AI Rack Density, 2021 to 2025
- Absolute $ Opportunity Analysis By AI Rack Density, 2026 to 2036
- Global Market Analysis and Forecast, By Data Center Type, 2021 to 2036
- Introduction / Key Findings
- Historical Market Size Value (USD Million) Analysis By Data Center Type, 2021 to 2025
- Current and Future Market Size Value (USD Million) Analysis and Forecast By Data Center Type, 2026 to 2036
- Hyperscale AI data centers
- Colocation AI facilities
- Enterprise private AI
- HPC & research centers
- Y-o-Y Growth Trend Analysis By Data Center Type, 2021 to 2025
- Absolute $ Opportunity Analysis By Data Center Type, 2026 to 2036
- Global Market Analysis and Forecast, By Commercial Model, 2021 to 2036
- Introduction / Key Findings
- Historical Market Size Value (USD Million) Analysis By Commercial Model, 2021 to 2025
- Current and Future Market Size Value (USD Million) Analysis and Forecast By Commercial Model, 2026 to 2036
- Direct enterprise contract
- System integrator / EPC-led
- Subscription / license
- Managed-service contract
- Y-o-Y Growth Trend Analysis By Commercial Model, 2021 to 2025
- Absolute $ Opportunity Analysis By Commercial Model, 2026 to 2036
- Global Market Analysis and Forecast, By Region, 2021 to 2036
- Introduction
- Historical Market Size Value (USD Million) Analysis By Region, 2021 to 2025
- Current Market Size Value (USD Million) Analysis and Forecast By Region, 2026 to 2036
- North America
- Latin America
- Western Europe
- Eastern Europe
- East Asia
- South Asia and Pacific
- Middle East and Africa
- Market Attractiveness Analysis By Region
- North America Market Analysis and Forecast, By Country, 2021 to 2036
- Historical Market Size Value (USD Million) Trend Analysis By Market Taxonomy, 2021 to 2025
- Market Size Value (USD Million) Forecast By Market Taxonomy, 2026 to 2036
- By Country
- United States
- Canada
- By Service Scope
- By Project Stage
- By AI Rack Density
- By Data Center Type
- By Commercial Model
- By Country
- Market Attractiveness Analysis
- By Country
- By Service Scope
- By Project Stage
- By AI Rack Density
- By Data Center Type
- By Commercial Model
- Key Takeaways
- Latin America Market Analysis and Forecast, By Country
- Historical Market Size Value (USD Million) Trend Analysis By Market Taxonomy, 2021 to 2025
- Market Size Value (USD Million) Forecast By Market Taxonomy, 2026 to 2036
- By Country
- Brazil
- Mexico
- Argentina
- Chile
- By Service Scope
- By Project Stage
- By AI Rack Density
- By Data Center Type
- By Commercial Model
- By Country
- Market Attractiveness Analysis
- By Country
- By Service Scope
- By Project Stage
- By AI Rack Density
- By Data Center Type
- By Commercial Model
- Key Takeaways
- Western Europe Market Analysis and Forecast, By Country
- Historical Market Size Value (USD Million) Trend Analysis By Market Taxonomy, 2021 to 2025
- Market Size Value (USD Million) Forecast By Market Taxonomy, 2026 to 2036
- By Country
- Germany
- France
- United Kingdom
- Italy
- Spain
- Benelux
- Nordics
- By Service Scope
- By Project Stage
- By AI Rack Density
- By Data Center Type
- By Commercial Model
- By Country
- Market Attractiveness Analysis
- By Country
- By Service Scope
- By Project Stage
- By AI Rack Density
- By Data Center Type
- By Commercial Model
- Key Takeaways
- Eastern Europe Market Analysis and Forecast, By Country
- Historical Market Size Value (USD Million) Trend Analysis By Market Taxonomy, 2021 to 2025
- Market Size Value (USD Million) Forecast By Market Taxonomy, 2026 to 2036
- By Country
- Poland
- Czech Republic
- Romania
- Hungary
- By Service Scope
- By Project Stage
- By AI Rack Density
- By Data Center Type
- By Commercial Model
- By Country
- Market Attractiveness Analysis
- By Country
- By Service Scope
- By Project Stage
- By AI Rack Density
- By Data Center Type
- By Commercial Model
- Key Takeaways
- East Asia Market Analysis and Forecast, By Country
- Historical Market Size Value (USD Million) Trend Analysis By Market Taxonomy, 2021 to 2025
- Market Size Value (USD Million) Forecast By Market Taxonomy, 2026 to 2036
- By Country
- China
- Japan
- South Korea
- By Service Scope
- By Project Stage
- By AI Rack Density
- By Data Center Type
- By Commercial Model
- By Country
- Market Attractiveness Analysis
- By Country
- By Service Scope
- By Project Stage
- By AI Rack Density
- By Data Center Type
- By Commercial Model
- Key Takeaways
- South Asia and Pacific Market Analysis and Forecast, By Country
- Historical Market Size Value (USD Million) Trend Analysis By Market Taxonomy, 2021 to 2025
- Market Size Value (USD Million) Forecast By Market Taxonomy, 2026 to 2036
- By Country
- India
- ASEAN
- Australia and New Zealand
- By Service Scope
- By Project Stage
- By AI Rack Density
- By Data Center Type
- By Commercial Model
- By Country
- Market Attractiveness Analysis
- By Country
- By Service Scope
- By Project Stage
- By AI Rack Density
- By Data Center Type
- By Commercial Model
- Key Takeaways
- Middle East and Africa Market Analysis and Forecast, By Country
- Historical Market Size Value (USD Million) Trend Analysis By Market Taxonomy, 2021 to 2025
- Market Size Value (USD Million) Forecast By Market Taxonomy, 2026 to 2036
- By Country
- GCC Countries
- South Africa
- Türkiye
- Israel
- By Service Scope
- By Project Stage
- By AI Rack Density
- By Data Center Type
- By Commercial Model
- By Country
- Market Attractiveness Analysis
- By Country
- By Service Scope
- By Project Stage
- By AI Rack Density
- By Data Center Type
- By Commercial Model
- Key Takeaways
- Key Countries Market Analysis
- United States
- Pricing Analysis
- Market Share Analysis, 2025
- By Service Scope
- By Project Stage
- By AI Rack Density
- By Data Center Type
- By Commercial Model
- Canada
- Pricing Analysis
- Market Share Analysis, 2025
- By Service Scope
- By Project Stage
- By AI Rack Density
- By Data Center Type
- By Commercial Model
- Mexico
- Pricing Analysis
- Market Share Analysis, 2025
- By Service Scope
- By Project Stage
- By AI Rack Density
- By Data Center Type
- By Commercial Model
- Brazil
- Pricing Analysis
- Market Share Analysis, 2025
- By Service Scope
- By Project Stage
- By AI Rack Density
- By Data Center Type
- By Commercial Model
- Chile
- Pricing Analysis
- Market Share Analysis, 2025
- By Service Scope
- By Project Stage
- By AI Rack Density
- By Data Center Type
- By Commercial Model
- Germany
- Pricing Analysis
- Market Share Analysis, 2025
- By Service Scope
- By Project Stage
- By AI Rack Density
- By Data Center Type
- By Commercial Model
- United Kingdom
- Pricing Analysis
- Market Share Analysis, 2025
- By Service Scope
- By Project Stage
- By AI Rack Density
- By Data Center Type
- By Commercial Model
- Italy
- Pricing Analysis
- Market Share Analysis, 2025
- By Service Scope
- By Project Stage
- By AI Rack Density
- By Data Center Type
- By Commercial Model
- Spain
- Pricing Analysis
- Market Share Analysis, 2025
- By Service Scope
- By Project Stage
- By AI Rack Density
- By Data Center Type
- By Commercial Model
- France
- Pricing Analysis
- Market Share Analysis, 2025
- By Service Scope
- By Project Stage
- By AI Rack Density
- By Data Center Type
- By Commercial Model
- India
- Pricing Analysis
- Market Share Analysis, 2025
- By Service Scope
- By Project Stage
- By AI Rack Density
- By Data Center Type
- By Commercial Model
- ASEAN
- Pricing Analysis
- Market Share Analysis, 2025
- By Service Scope
- By Project Stage
- By AI Rack Density
- By Data Center Type
- By Commercial Model
- Australia and New Zealand
- Pricing Analysis
- Market Share Analysis, 2025
- By Service Scope
- By Project Stage
- By AI Rack Density
- By Data Center Type
- By Commercial Model
- China
- Pricing Analysis
- Market Share Analysis, 2025
- By Service Scope
- By Project Stage
- By AI Rack Density
- By Data Center Type
- By Commercial Model
- Japan
- Pricing Analysis
- Market Share Analysis, 2025
- By Service Scope
- By Project Stage
- By AI Rack Density
- By Data Center Type
- By Commercial Model
- South Korea
- Pricing Analysis
- Market Share Analysis, 2025
- By Service Scope
- By Project Stage
- By AI Rack Density
- By Data Center Type
- By Commercial Model
- Poland
- Pricing Analysis
- Market Share Analysis, 2025
- By Service Scope
- By Project Stage
- By AI Rack Density
- By Data Center Type
- By Commercial Model
- Hungary
- Pricing Analysis
- Market Share Analysis, 2025
- By Service Scope
- By Project Stage
- By AI Rack Density
- By Data Center Type
- By Commercial Model
- Türkiye
- Pricing Analysis
- Market Share Analysis, 2025
- By Service Scope
- By Project Stage
- By AI Rack Density
- By Data Center Type
- By Commercial Model
- South Africa
- Pricing Analysis
- Market Share Analysis, 2025
- By Service Scope
- By Project Stage
- By AI Rack Density
- By Data Center Type
- By Commercial Model
- Saudi Arabia
- Pricing Analysis
- Market Share Analysis, 2025
- By Service Scope
- By Project Stage
- By AI Rack Density
- By Data Center Type
- By Commercial Model
- UAE
- Pricing Analysis
- Market Share Analysis, 2025
- By Service Scope
- By Project Stage
- By AI Rack Density
- By Data Center Type
- By Commercial Model
- United States
- Market Structure Analysis
- Competition Dashboard
- Competition Benchmarking
- Market Share Analysis of Top Players
- By Regional
- By Service Scope
- By Project Stage
- By AI Rack Density
- By Data Center Type
- By Commercial Model
- Emerging Startups
- Innovation Benchmarking
- Competition Analysis
- Competition Deep Dive
- Vertiv
- Overview
- Product Portfolio
- Profitability by Market Segments
- Sales Footprint
- Strategy Overview
- Marketing Strategy
- Product Strategy
- Channel Strategy
- Siemens
- Jacobs
- Schneider Electric
- Eaton
- Vertiv
- Case Studies
- Success Stories
- Recent Developments
- Competition Deep Dive
- Assumptions & Acronyms Used


