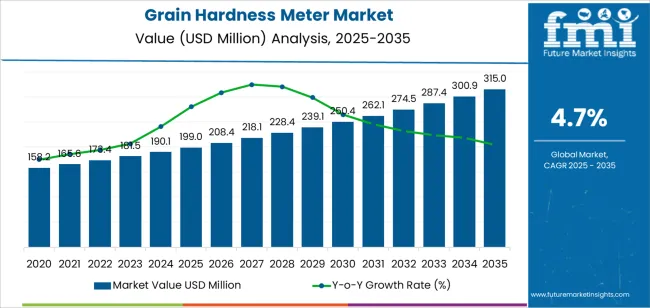
The global grain hardness meter market is projected to reach USD 315.0 million by 2035, recording an absolute increase of USD 116.0 million over the forecast period. The market is valued at USD 199.0 million in 2025 and is set to rise at a CAGR of 4.7% during the assessment period. The overall market size is expected to grow by nearly 1.6 times during the same period, supported by increasing demand for grain quality assessment solutions in agricultural and food processing operations worldwide, driving demand for efficient testing equipment and increasing investments in food safety compliance and quality control improvement projects globally. However, high equipment costs for advanced models and limited adoption in smallholder farming operations may pose challenges to market expansion.
The market expansion between 2025 and 2035 reflects fundamental shifts in grain quality management practices and food safety compliance requirements across agricultural production, grain trading, and food processing operations. Grain hardness meter manufacturers are developing integrated instruments that combine precise measurement capabilities, digital data recording features, and user-friendly interfaces that enable grain handlers to optimize quality assessment and processing decisions. The transition from subjective visual inspection to objective hardness measurement addresses industry challenges related to grain classification accuracy, processing efficiency optimization, and end-product quality consistency in markets where grain hardness directly influences milling performance and food product characteristics.
Technology advancement in digital sensor systems, automated measurement protocols, and wireless data connectivity creates opportunities for enhanced testing accuracy and operational efficiency improvements. Grain hardness meter providers are incorporating touchscreen displays for intuitive operation, internal memory storage for test result archiving, and standardized testing chambers that accommodate diverse grain types and varieties. The market benefits from food safety regulation trends in major grain-producing regions where quality documentation requirements and traceability standards necessitate objective grain characteristic measurement. Distribution channels through agricultural equipment suppliers, laboratory instrument distributors, and food testing equipment specialists expand deployment across grain elevators, flour mills, research facilities, and quality control laboratories serving cereal processing industries.
Between 2025 and 2030, the grain hardness meter market is projected to expand from USD 199.0 million to USD 250.3 million, resulting in a value increase of USD 51.3 million, which represents 44.2% of the total forecast growth for the decade. This phase of development will be shaped by rising demand for objective grain quality assessment and food processing optimization, product innovation in digital measurement technologies and automated testing systems, as well as expanding adoption across grain trading operations and cereal processing facilities. Companies are establishing competitive positions through investment in advanced sensor technologies, standardized testing protocols, and strategic market expansion across wheat milling, rice processing, and feed manufacturing applications.
From 2030 to 2035, the market is forecast to grow from USD 250.3 million to USD 315.0 million, adding another USD 64.7 million, which constitutes 55.8% of the overall ten-year expansion. This period is expected to be characterized by the expansion of specialized testing instruments, including portable field testing units and laboratory-grade precision systems tailored for specific grain types and research requirements, strategic collaborations between instrument manufacturers and agricultural research institutions, and an enhanced focus on data integration capabilities and cloud-based quality management platforms. The growing emphasis on grain quality traceability and processing efficiency optimization will drive demand for advanced, reliable grain hardness meter solutions across diverse agricultural and food industry applications.
| Metric | Value |
|---|---|
| Market Value (2025) | USD 199.0 million |
| Market Forecast Value (2035) | USD 315.0 million |
| Forecast CAGR (2025-2035) | 4.7% |
The grain hardness meter market grows by enabling agricultural and food processing operations to achieve superior grain quality assessment and processing efficiency while maintaining consistent product specifications. Grain handlers and processors face mounting pressure to optimize milling performance and end-product quality, with grain hardness measurements typically correlating 70-85% with flour yield and texture characteristics, making objective testing essential for commercial grain valuation and processing optimization. The food industry's need for consistent raw material quality creates demand for reliable testing instruments that enable accurate grain classification and processing parameter adjustment across diverse grain varieties and harvest conditions.
Food safety regulations requiring grain quality documentation and processing control standards drive adoption in flour milling, rice processing, and feed manufacturing applications, where grain hardness has a direct impact on production efficiency and product quality consistency. The global expansion of organized grain trading and increasing quality premiums for superior grain characteristics accelerate grain hardness meter demand as commercial operations implement objective testing protocols to support quality-based pricing and supplier management. However, equipment purchase costs for precision instruments and technical training requirements for proper operation may limit adoption rates among smaller grain handlers and regions with limited quality testing infrastructure.
The market is segmented by instrument type, application, and region. By instrument type, the market is divided into digital hardness tester and pointer-type hardness tester. Based on application, the market is categorized into food processing, agricultural scientific research, feed industry, and others. Regionally, the market is divided into Asia Pacific, Europe, North America, Latin America, and Middle East & Africa.
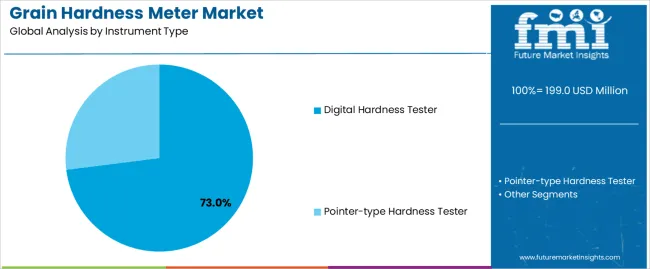
The digital hardness tester segment represents the dominant force in the grain hardness meter market, capturing approximately 73.0% of total market share in 2025. This advanced category encompasses instruments featuring electronic sensors, digital display interfaces, automated measurement protocols, and data storage capabilities, delivering comprehensive testing functionality with enhanced accuracy and operational convenience. The digital hardness tester segment's market leadership stems from its exceptional measurement precision eliminating operator subjectivity, integrated data management enabling traceability and quality documentation, and compatibility with modern laboratory information management systems that streamline quality control workflows.
The pointer-type hardness tester segment maintains a 27.0% market share, serving operations requiring cost-effective testing solutions through mechanical measurement mechanisms, simple operation procedures, and no electrical power requirements. This segment benefits from lower equipment costs and operational simplicity suitable for basic quality assessment in field conditions and small-scale operations.
Key advantages driving the digital hardness tester segment include superior measurement accuracy with coefficient of variation below 3% enabling reliable grain classification and quality assessment, automated testing protocols reducing operator influence and improving result consistency across multiple users and testing sessions, integrated data recording capabilities supporting quality documentation requirements and statistical analysis of grain characteristics, enhanced operational efficiency through rapid testing cycles completing measurements in 30-60 seconds per sample.
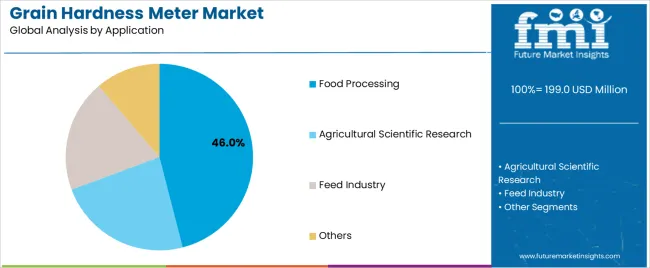
Food processing dominates the grain hardness meter market with approximately 46.0% market share in 2025, reflecting the substantial utilization of hardness testing in flour milling, rice processing, and cereal manufacturing operations where grain hardness directly influences processing efficiency and product quality outcomes. The food processing segment's market leadership is reinforced by widespread adoption across commercial mills and processing facilities where hardness measurement informs milling parameter optimization, grain blending decisions, and finished product quality prediction.
The agricultural scientific research segment represents 28.0% market share through specialized requirements in breeding programs, variety evaluation studies, and agronomic research where grain hardness serves as key quality trait measurement. The feed industry segment accounts for 16.0% market share, serving operations assessing grain quality for animal nutrition applications. Others applications represent 10.0% market share, including grain trading, storage management, and quality certification services requiring objective grain characteristic documentation.
Key market dynamics supporting application preferences include flour milling operations requiring hardness assessment to optimize extraction rates and predict flour properties for specific end-product applications, rice processing facilities utilizing hardness measurement to classify grain varieties and adjust polishing parameters for quality consistency, feed manufacturing operations assessing grain hardness to ensure appropriate grinding characteristics and nutritional value for animal feed formulations, research institutions conducting variety evaluation and breeding selection programs where hardness measurement supports genetic improvement objectives.
The market is driven by three concrete demand factors tied to quality optimization and processing efficiency. First, flour milling efficiency requirements accelerate hardness testing adoption, with grain hardness correlating directly to flour extraction rates that vary 8-12% between soft and hard wheat varieties, creating economic incentives for mills to implement testing protocols that optimize grain procurement and processing parameters. Second, quality-based grain pricing systems drive commercial testing demand, with price premiums of 5-15% for preferred hardness characteristics in wheat, rice, and specialty grain markets, requiring objective measurement infrastructure to support fair trading and supplier quality management. Third, food safety traceability requirements motivate quality documentation, with regulatory standards in major markets mandating grain characteristic records throughout processing chains, necessitating instrumentation that provides verifiable measurement data and digital record-keeping capabilities.
Market restraints include high equipment investment costs affecting adoption rates, with precision digital hardness testers priced between 3,000-15,000 USD per unit, posing barriers for small-scale processors and developing market grain handlers operating with limited capital budgets. Technical expertise requirements create additional challenges, as proper instrument operation and result interpretation necessitate operator training and understanding of grain quality principles, limiting adoption in operations without qualified technical personnel or laboratory infrastructure. Sample preparation standardization concerns impact measurement reliability, particularly when testing protocols vary across facilities and operators, creating result inconsistencies that reduce confidence in hardness measurement as quality assessment tool.
Key trends indicate growing integration of hardness testing with comprehensive grain quality analysis systems that measure multiple parameters including moisture, protein content, and kernel damage for holistic quality assessment. Technology advancement trends toward portable field testing instruments enabling on-site grain evaluation at harvest and receiving operations, cloud-connected devices supporting real-time data sharing across supply chain participants, and artificial intelligence algorithms correlating hardness measurements with processing outcomes to optimize production decisions are driving next-generation product development. However, the market thesis could face disruption if alternative rapid grain quality assessment technologies such as near-infrared spectroscopy gain widespread adoption for simultaneous multi-parameter measurement, potentially reducing standalone hardness meter demand, or if grain breeding programs successfully narrow hardness variation within commercial varieties, diminishing the economic value of routine hardness testing in processing operations.
| Country | CAGR (2025-2035) |
|---|---|
| China | 6.3% |
| India | 5.9% |
| Germany | 5.4% |
| Brazil | 4.9% |
| USA | 4.5% |
| UK | 4.0% |
| Japan | 3.5% |
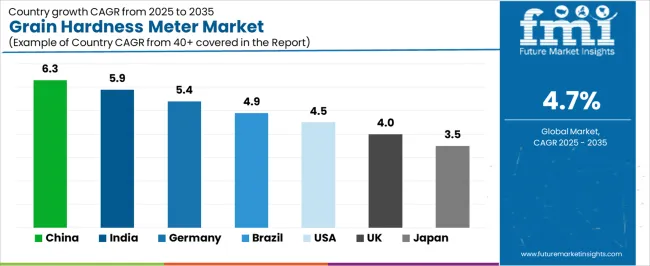
The grain hardness meter market is gaining momentum worldwide, with China taking the lead thanks to aggressive grain processing capacity expansion and growing food quality control infrastructure development. Close behind, India benefits from agricultural modernization initiatives and expanding commercial grain handling operations, positioning itself as a strategic growth hub in the Asia-Pacific region. Germany shows strong advancement, where precision measurement culture and established food processing sector strengthen its role in European quality testing equipment markets. The USA demonstrates steady growth through advanced grain trading systems and research institution investments, signaling continued commitment to grain quality science. The UK stands out for its food safety compliance emphasis and laboratory testing infrastructure, while Brazil and Japan continue to record consistent progress driven by food processing industry development and quality assurance program expansion. Together, China and India anchor the global expansion story, while established markets build stability and diversity into the market's growth path.
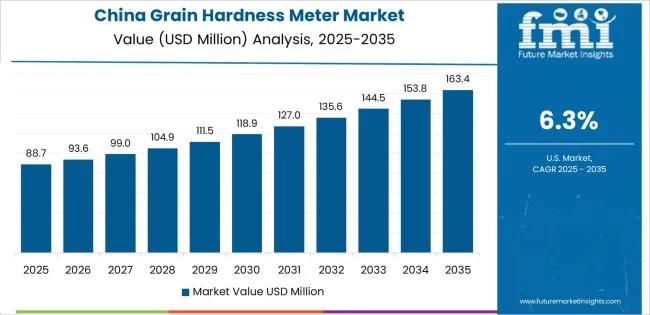
China demonstrates the strongest growth potential in the grain hardness meter market with a CAGR of 6.3% through 2035. The country's leadership position stems from comprehensive grain processing industry expansion, intensive food quality control infrastructure development, and growing quality-based grain trading systems driving adoption of objective testing equipment. Growth is concentrated in major grain-producing and processing regions, including Henan, Shandong, Hebei, and Jiangsu provinces, where flour mills and rice processors are implementing hardness testing protocols for quality management and processing optimization. Distribution channels through agricultural equipment suppliers, laboratory instrument distributors, and food testing equipment providers expand deployment across commercial mills, grain elevators, and quality inspection facilities. The country's food safety modernization initiatives provide support for quality testing infrastructure, including laboratory equipment standards and testing protocol development programs.
Key market factors include grain processing concentration in major production regions with comprehensive quality control requirements across commercial milling operations, domestic instrument manufacturing capabilities enabling cost-competitive testing equipment supply for price-sensitive market segments serving local processing industry, food safety regulation enforcement driving quality documentation requirements with increasing emphasis on objective grain characteristic measurement, technology advancement featuring integration with domestic laboratory management systems and quality control platforms adapted for Chinese food industry applications.
In major grain-producing states, processing centers, and research institutions, the adoption of grain hardness testing instruments is accelerating across flour mills, rice processors, and agricultural research facilities, driven by commercial processing expansion and quality improvement initiatives. The market demonstrates strong growth momentum with a CAGR of 5.9% through 2035, linked to comprehensive food processing sector development and increasing focus on grain quality management. Indian processors are implementing hardness testing equipment to optimize milling efficiency while supporting quality-based procurement systems in organized grain markets. The country's agricultural research programs create demand for testing instrumentation, while increasing emphasis on food quality standards drives adoption of objective measurement systems that ensure product consistency.
Leading grain processing development regions, including Punjab, Haryana, Uttar Pradesh, and Karnataka, driving grain hardness meter adoption across milling operations. Growing organized food processing sector enabling systematic specification of quality testing equipment in modern processing facilities and quality laboratories. Government food processing promotion programs accelerating investment in quality control infrastructure including testing equipment for grain characterization. Policy support through food safety regulations and quality standards linked to agricultural product development initiatives promoting objective quality assessment practices.
Advanced food processing sector in Germany demonstrates sophisticated implementation of grain quality testing systems, with documented installations showing 15-25% milling efficiency improvement through systematic hardness-based grain classification and processing optimization. The country's food industry infrastructure in major regions, including Bavaria, North Rhine-Westphalia, Baden-Württemberg, and Lower Saxony, showcases integration of precision testing technologies with existing quality management systems, leveraging expertise in analytical instrumentation and food science. German processors emphasize measurement accuracy and traceability standards, creating demand for certified testing instruments that support comprehensive quality documentation and regulatory compliance requirements. The market maintains steady growth through focus on processing efficiency optimization and food quality assurance, with a CAGR of 5.4% through 2035.
Key development areas include precision measurement capabilities achieving repeatability within 2% supporting reliable grain classification for processing optimization, technical certification standards ensuring instrument quality through calibration protocols and performance verification with documented measurement traceability, strategic partnerships between instrument manufacturers and food research institutions enabling validation studies and testing protocol development, integration of digital data management systems and comprehensive quality platforms for centralized quality control across multi-site processing operations.
The Brazilian market demonstrates growing grain hardness meter adoption based on food processing industry expansion and increasing quality differentiation in grain markets driving demand for objective testing capabilities. The country shows solid potential with a CAGR of 4.9% through 2035, driven by wheat milling capacity growth and agricultural research investments across major grain-producing regions, including Rio Grande do Sul, Paraná, São Paulo, and Mato Grosso states. Brazilian processors are adopting hardness testing equipment to support quality-based grain sourcing and milling parameter optimization for domestic and export markets. Technology deployment channels through food industry equipment suppliers, laboratory instrument distributors, and agricultural technology providers expand coverage across processing facilities and research institutions.
Leading market segments include wheat milling operations implementing hardness testing for variety classification and blending optimization serving domestic flour markets and bakery industries, agricultural research institutions conducting variety evaluation programs for wheat and rice improvement supporting breeding objectives and cultivation recommendations, feed manufacturing operations assessing grain hardness to optimize grinding processes and ensure consistent feed pellet quality for livestock production, strategic focus on processing efficiency supporting investment in quality testing equipment as food industry modernizes operations.
The USA market demonstrates established grain hardness meter adoption based on advanced grain quality science infrastructure and comprehensive trading systems incorporating quality specifications. The country shows solid potential with a CAGR of 4.5% through 2035, driven by research institution investments and replacement cycles for aging equipment across major grain-producing regions, including Great Plains wheat belt, Corn Belt states, and Pacific Northwest grain production areas. American research facilities and commercial processors are implementing advanced hardness testing systems that integrate with comprehensive grain quality databases and processing optimization programs. Technology deployment channels through established scientific instrument suppliers, agricultural equipment distributors, and food industry service providers expand deployment across universities, USDA facilities, and commercial grain operations.
Key market characteristics include agricultural research infrastructure supporting grain quality science with comprehensive testing equipment specifications in breeding programs and variety evaluation studies, grain trading systems incorporating hardness specifications in commercial contracts requiring objective measurement capabilities for quality verification and dispute resolution, technology partnerships between instrument manufacturers and research institutions enabling development of standardized testing protocols and calibration procedures, strategic emphasis on measurement precision and data integration supporting advanced grain quality research and processing optimization initiatives.
In major food processing regions and research facilities, laboratories are implementing grain hardness testing instruments that comply with food safety management system requirements, with documented integration supporting 20-30% reduction in quality variation through systematic grain assessment and processing control. The market shows steady growth potential with a CAGR of 4.0% through 2035, linked to established food quality culture, laboratory accreditation requirements, and emphasis on measurement traceability standards. British facilities are adopting hardness testing equipment that ensures compliance with quality assurance protocols while supporting continuous improvement in processing efficiency.
Market development factors include food safety management system requirements driving systematic quality testing protocols in commercial food processing operations utilizing grain ingredients, laboratory accreditation standards necessitating validated testing methods and calibrated instrumentation for grain quality assessment supporting certification requirements, strategic partnerships between food processors and testing equipment suppliers ensuring appropriate instrument specification for quality control applications, emphasis on measurement traceability and data integrity supporting preference for digital instruments with comprehensive documentation capabilities.
Grain hardness meter market in Japan demonstrates mature implementation focused on precision instrumentation and integration with comprehensive grain quality research programs serving breeding institutions and specialty grain processors. The country maintains steady growth momentum with a CAGR of 3.5% through 2035, driven by agricultural research continuity and specialty grain processing requirements in major research centers and food manufacturing regions. Major research facilities showcase deployment of high-precision testing instruments that achieve exceptional measurement accuracy and reliability for scientific research applications and quality control programs.
Key market characteristics include precision research standards driving specification of high-accuracy testing instruments that maintain measurement repeatability within 1% for scientific studies, specialty grain processing requirements supporting demand for hardness measurement in rice quality assessment and noodle wheat characterization for traditional food production, technology development by domestic instrument manufacturers incorporating advanced sensor technologies and precision mechanical systems for optimal performance, collaboration between research institutions and equipment manufacturers enabling continuous improvement of testing methodologies and instrument capabilities for grain quality science advancement.
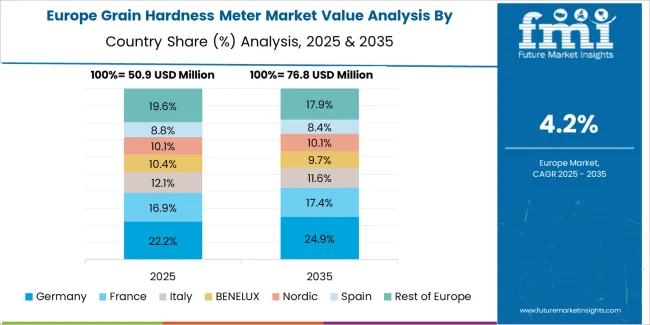
The grain hardness meter market in Europe is projected to grow from USD 73.5 million in 2025 to USD 105.4 million by 2035, registering a CAGR of 3.7% over the forecast period. Germany is expected to maintain its leadership position with a 31.8% market share in 2025, declining slightly to 31.2% by 2035, supported by its extensive food processing infrastructure and major milling centers, including Bavaria, North Rhine-Westphalia, and Baden-Württemberg regions.
The United Kingdom follows with a 18.3% share in 2025, projected to reach 18.1% by 2035, driven by established laboratory testing infrastructure and food quality assurance programs. France holds a 16.7% share in 2025, expected to maintain 16.6% by 2035 through grain research institutions and milling industry presence. Italy commands a 13.2% share in both 2025 and 2035, backed by pasta wheat quality assessment requirements. Spain accounts for 9.6% in 2025, rising to 9.7% by 2035 on food processing expansion. The Netherlands maintains 4.5% in 2025, reaching 4.6% by 2035 on agricultural research activities. The Rest of Europe region is anticipated to hold 5.9% in 2025, expanding to 6.1% by 2035, attributed to increasing grain hardness meter adoption in Nordic countries and emerging Central and Eastern European grain quality testing programs.
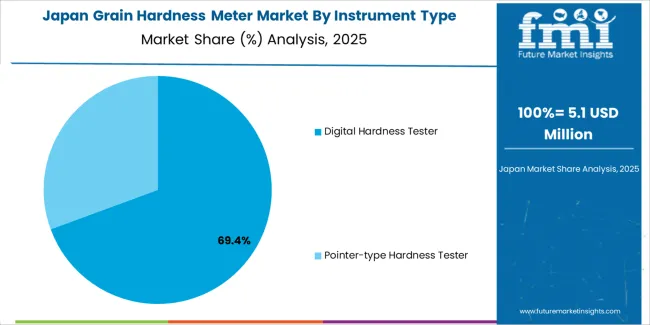
The Japanese grain hardness meter market demonstrates a mature and precision-focused landscape, characterized by sophisticated integration of high-accuracy testing instruments and comprehensive quality research programs with existing agricultural research infrastructure across breeding institutions, food research centers, and specialty grain processors. Japan's emphasis on measurement precision and data reliability drives demand for advanced testing equipment that supports rigorous scientific research protocols and quality control standards in grain evaluation applications. The market benefits from established relationships between domestic instrument manufacturers and research institutions, creating service ecosystems that prioritize measurement accuracy and technical support programs. Research centers and processing facilities showcase advanced hardness meter implementations where instruments achieve measurement coefficient of variation below 2% through precision engineering and comprehensive calibration protocols.
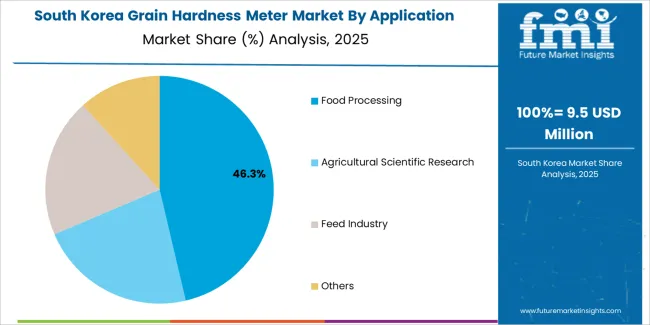
The South Korean grain hardness meter market is characterized by growing international instrument supplier presence, with companies maintaining significant positions through comprehensive product portfolios and technical services capabilities for agricultural research and food processing applications. The market demonstrates increasing emphasis on grain quality research and food processing modernization, as Korean research institutions increasingly demand advanced testing instruments that integrate with modern laboratory equipment and quality management systems deployed across research facilities. Regional scientific equipment distributors are gaining market share through strategic partnerships with international manufacturers, offering specialized services including technical training support and maintenance programs for research and quality control laboratories. The competitive landscape shows increasing collaboration between global instrument manufacturers and Korean agricultural research specialists, creating hybrid service models that combine international product technology with local market knowledge and customer support capabilities.
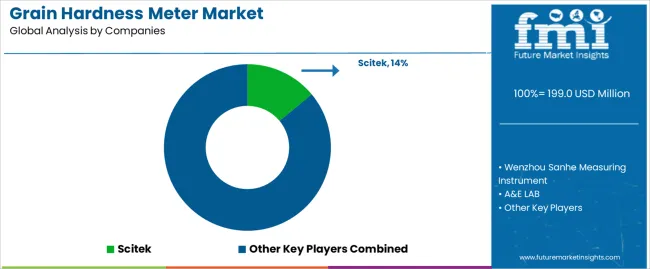
The grain hardness meter market features approximately 18-22 meaningful players with moderate fragmentation, where the top three companies control roughly 32-38% of global market share through established engineering capabilities and comprehensive distribution networks. Competition centers on measurement accuracy, instrument reliability, and technical support rather than price competition alone. Scitek leads with approximately 14.0% market share through its specialized grain testing instrument portfolio.
Market leaders include Scitek, Wenzhou Sanhe Measuring Instrument, and A&E LAB, which maintain competitive advantages through proven testing technologies, established customer relationships, and deep expertise in grain quality assessment across multiple agricultural and food industry applications, creating reliability advantages with research institutions and commercial processors. These companies leverage research and development capabilities in sensor technologies and ongoing technical support relationships to defend market positions while expanding into specialized grain testing and comprehensive quality analysis applications.
Challengers encompass Anton Paar GmbH and LAB-FAC, which compete through precision instrumentation portfolios and strong regional presence in key food processing markets. Product specialists, including NEWJIELI Technology, Infitek, and Zhejiang NADE Scientific Instrument, focus on specific instrument types or regional markets, offering differentiated capabilities in digital testing systems, customization services, and competitive pricing structures.
Regional players and emerging instrument manufacturers create competitive pressure through cost-competitive equipment offerings and local service advantages, particularly in high-growth markets where domestic manufacturers including Zhejiang Top Instrument, Serve Real Instruments, Akyol Ticaret Degirmen Levazımatı, GAO Tek, and National Analytical Corp provide localized technical support and favorable pricing adapted to regional market conditions. Market dynamics favor companies that combine reliable measurement performance with comprehensive after-sales service offerings that address complete instrument lifecycle requirements from calibration through maintenance support.
| Item | Value |
|---|---|
| Quantitative Units | USD 199.0 million |
| Instrument Type | Digital Hardness Tester, Pointer-type Hardness Tester |
| Application | Food Processing, Agricultural Scientific Research, Feed Industry, Others |
| Regions Covered | Asia Pacific, Europe, North America, Latin America, Middle East & Africa |
| Country Covered | China, India, Germany, Brazil, USA, UK, Japan, and 40+ countries |
| Key Companies Profiled | Scitek, Wenzhou Sanhe Measuring Instrument, A&E LAB, Anton Paar GmbH, LAB-FAC, NEWJIELI Technology, Infitek, Zhejiang NADE Scientific Instrument, Zhejiang Top Instrument, Serve Real Instruments, Akyol Ticaret Degirmen Levazımatı, GAO Tek, National Analytical Corp |
| Additional Attributes | Dollar sales by instrument type and application categories, regional adoption trends across Asia Pacific, Europe, and North America, competitive landscape with testing instrument manufacturers and distribution networks, equipment specifications and measurement accuracy characteristics, integration with grain quality control programs and food processing operations, innovations in digital sensor technologies and automated testing protocols, and development of portable field testing instruments with enhanced data management and connectivity capabilities. |
The global grain hardness meter market is estimated to be valued at USD 199.0 million in 2025.
The market size for the grain hardness meter market is projected to reach USD 315.0 million by 2035.
The grain hardness meter market is expected to grow at a 4.7% CAGR between 2025 and 2035.
The key product types in grain hardness meter market are digital hardness tester and pointer-type hardness tester.
In terms of application, food processing segment to command 46.0% share in the grain hardness meter market in 2025.


Full Research Suite comprises of:
Market outlook & trends analysis
Interviews & case studies
Strategic recommendations
Vendor profiles & capabilities analysis
5-year forecasts
8 regions and 60+ country-level data splits
Market segment data splits
12 months of continuous data updates
DELIVERED AS:
PDF EXCEL ONLINE
Grain Cooling Spear Market Size and Share Forecast Outlook 2025 to 2035
Grain Roller Market Size and Share Forecast Outlook 2025 to 2035
Grain Mill Grinder Market Size and Share Forecast Outlook 2025 to 2035
Grain Alcohol Market Size and Share Forecast Outlook 2025 to 2035
Grain-Free Pet Food Market Trends - Growth & Industry Forecast 2024 to 2034
Grain And Seed Cleaning Equipment Market
Migraine Treatment Market Insights by Drug Class, Route of Administration, Distribution Channel, Treatment, and Region through 2035
Migraine Nasal Spray Market Outlook – Trends, Growth & Forecast 2025 to 2035
Feed Grain Market Analysis - Size, Share, and Forecast Outlook 2025 to 2035
Multigrain Premix Market Trends – Healthy Baking & Industry Expansion 2025 to 2035
Horse Grain Feeders Market Size and Share Forecast Outlook 2025 to 2035
Whole Grain & High Fiber Foods Market Growth – Demand, Trends & Forecast 2025–2035
Whole Grain Salty Snacks Market Analysis by Product Type, Product Claim, Source, Distribution Channel and Region Through 2035
Multi-Grain Premixes Market
Acute Migraine Treatment Market Trends – Analysis & Forecast 2024-2034
United Kingdom Whole Grain and High Fiber Foods Market Report – Trends & Forecast 2025–2035
United States Whole Grain and High Fiber Foods Market Report – Trends & Forecast 2025–2035
Commercial Grain Mill Market Size and Share Forecast Outlook 2025 to 2035
Dried Spent Grain Market Trends – Growth & Industry Forecast 2025 to 2035
Europe Whole Grain and High Fiber Foods Market Insights – Size & Forecast 2025–2035

Thank you!
You will receive an email from our Business Development Manager. Please be sure to check your SPAM/JUNK folder too.
Chat With
MaRIA