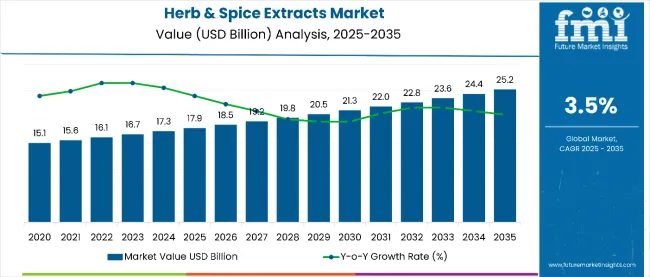
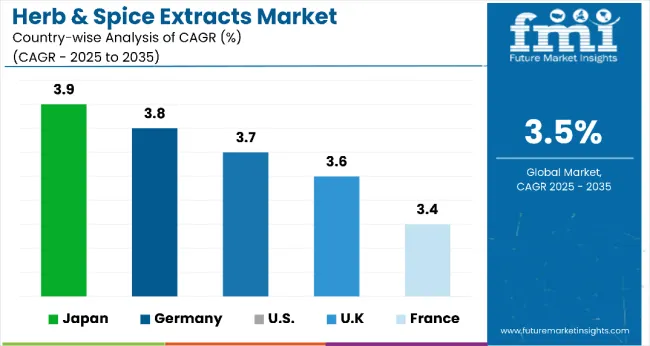
According to future market insights research, the global herb & spice extracts market is anticipated to thrive at an average CAGR of 3.5% during the projected period. The market value is projected to increase from US$ 16.7 billion in 2023 to US$ 23.6 billion by 2033.
Attributes | Details |
---|---|
Market Size Value in 2023 | US$ 16.7 billion |
Market Forecast Value in 2033 | US$ 23.6 billion |
Global Growth Rate (2023 to 2033) | 3.5% CAGR |
Forecast Period | 2023 to 2033 |
Market Share of India in South Asia | 31% |
Wide use of spices and herbs powder extract, along with new extraction techniques for a lesser amount of waste raw material, is helping the herb and spice extracts market.
Herbal extracts are made from the seeds, stems, and flowers of herbs. Spice extracts come from stems, nuts, berries, barks, and vegetables and are sweet and pungent. Spice and herb extracts have been used to impart tastes, colors, and preservation of consumer goods in foods, beverages, and pharmaceuticals. The varied industry, along with new applications of these, are fueling the sales of herb & spice extracts.
Don't pay for what you don't need
Customize your report by selecting specific countries or regions and save 30%!
As per FMI - Demand for organic spices and herbs is being driven by increased interest in unusual flavors and growing healthcare consciousness among customers. Millennials are particularly interested in the many flavors and cuisine that reflect regional differences in culture.
Global study on the herb & spice extracts market explains that multiple health advantages, like decreasing blood sugar levels, enhancing brain function, increasing immunity, possessing anti-inflammatory characteristics, and many more, are provided by spices and herbs to consumers. In addition, spices and herbs extracts are a great source of important nutrients, making them an important food component for making a variety of foods that taste delicious and are good for you. These natural ingredients also give the food its scent, flavor, and color, which will drive the market for the forecast period, expanding the herb & spice extract market size.
Herb & spice extracts market outlook explains that spices and seasonings are packed with a variety of medicinal and physiological advantages. Spices make food flavor and taste better and impact human health in a variety of ways. Most spices include antiviral and antibacterial effects, as well as traces of vital nutrients. Numerous health advantages of spices include their strong antioxidant content, ability to lower blood sugar and prevent diabetes, and enhancement of both skin and cognitive function, fueling the demand for herb & spice extracts.
Allicin, a potent chemical found in garlic, reduces the risk of heart illness and inhibits the development of cancer cells. Due to rising consumer knowledge of the health advantages of herbs and spices extract, the industry has seen a surge in the use of spices. These spices are used by several healthy food producers in this area to present and create goods that promote health and draw in the area's nutrition consumers. Let’s look at some of the major factors that need to be highlighted:
Herb & spice extracts market survey suggests that a big number of herbs are used as medicines or are processed to be used as medicine. Characterization of herbs also involves their medicinal application. Approximately 350,000 higher plants are estimated to exist on our planet and related to this number, we could say that only a few medicinal plants were studied scientifically. The extract and essential oils extracted from these plants are further used in chronic diseases and their prevention. The medicinal use of these herbs and spice extracts fuels the market growth.
Research teams at biomedical research labs study to evaluate health conditions, toxicity, and other diseases and their side effects on the food processed with the applications of these herb and spice extracts. Herb and spice extracts are also used in packaged food to enhance the flavor. Before adding these herbs and spices to the food, the herbs & spices are processed, distilled, and extracted through multiple temperatures for its wider food applications.
FMI explains that the revolutionary trend of introducing steam distillation for extracting essential oils from herbs and spices is finding its space in the manufacturing units. The process can be explained with hot steam flowing through the raw ingredient, opening cavities that hold oil inside. The steam’s temperature can be manually adjusted for various herbs and spices. For example, lavender oil can be extracted through the same steam distillation process without thermal damage.
Herb & spice extracts demand analysis explains that the market offers a lot of trade potential, especially for small-scale farmers in places like the United States, where spices and herb extracts are in high demand. Small-scale farmers produce a substantial share of the extracts marketed in local and export markets, and worldwide commerce generates billions of dollars in revenue. Hot and spicy food consumption has surged recently, and Americans are increasingly seeking bolder ethnic flavors.
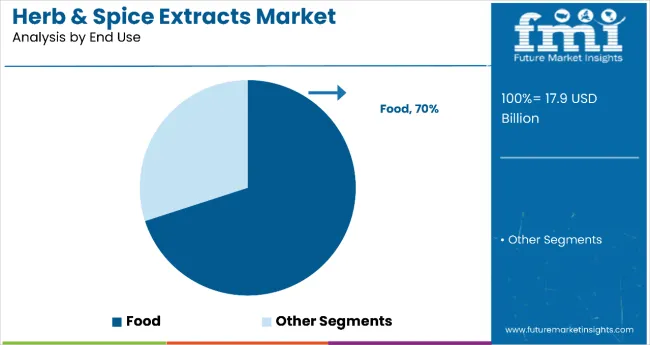
Spices and herb extracts are utilized in the food and beverage industry for a variety of applications, particularly in bakeries. The demand for organic spice/herb extracts has increased in the United States, as has the desire for organic food. This expands the herb & spice extracts market size.
Consumers are growing a desire for new and unusual spices and flavors as Western foods become more accessible and mainstream. The rise in popularity of Western food can be attributed to the growing diverse population and the increasing number of individuals going to foreign locations.
Ethnic spice blends are predicted to meet the growing need for a diversified mix of herbs and spices, which is mostly due to the growing popularity of ethnic cuisines and nutritious foods, as well as the increased consumption of convenience, processed, and ready-to-eat dishes. In addition, most new goods on the market are marketed as "street food" in order to appeal to a wider range of customers.
Germany's spice and herbs extract industry is driven by shifting customers' personal tastes, healthy living practices, and ease. Another emerging trend is a preference for Asian cuisines, which include Japanese and Chinese. Allspice and peppers are the most popular spices in Germany, whereas oregano and thyme are the most popular herbs. Germany is well-known as a global trading hub for herbal extracts and spices, both in terms of importing from countries that produce and trading among its members as well as other countries.
Spices and herb extracts are utilized for a variety of applications in the food and beverage industry, particularly in bakeries, and Brazil dominates the market in South America. The organic food industry in South America has developed in tandem with the demand for organic spice/herb extracts, strengthening the market analyzed in the region. Furthermore, as Asian cuisines become more popular in Brazil, the country imports spices and herb extracts from Asia-Pacific countries such as India, China, Vietnam, and others.
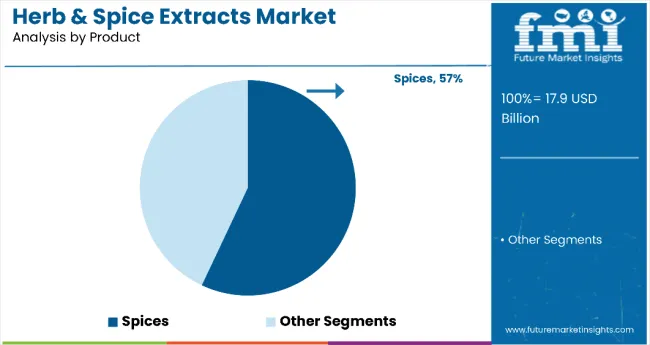
Over the last decade, the food & service industry has grown dramatically. A variety of factors influence consumer preferences, including their hectic lifestyles and the rising working population. Spice Extracts is the most profitable segment, with a present market share of 47 percent and a projected market share of 57 percent in the forecasted time.
Over the projected period, increased demand for spices in food and beverages, seasonings, and condiments is expected to drive segmental growth. This has opened new possibilities for food and ingredient producers to use Spices and herbs extracts as flexible food ingredients because they can be utilized in several recipes, pushing the sales of herb & spice extracts.
For the millennial populace, herbs and spices have been utilized to maintain and enhance human beauty. Spices and herbs have traditionally been related to Indian and Chinese cuisines for several purposes. Turmeric and sandalwood have been utilized for skin care and also for smells by women in these locations.
As purchasers aspire for a desirable and trendy look, cosmetics and personal care expenditure is increasing. Cosmetics manufacturers, cosmetic ODMs, and contract manufacturers use organic ingredients to deliver benefits to consumers while avoiding side effects. Herbs and spices are in high demand as natural compounds.
With the advent of the coronavirus epidemic, the marketplace for spices and herbs has seen a sharp increase, and some specific spices intended to boost immunity, such as ginger, garlic, and turmeric, have seen a phenomenal response from consumers worldwide. Since regions like Europe rely heavily on trade from emerging economies, supply chain risk previously persisted. However, the risk is less of an issue now because Europe is among the top destinations for herbal remedies, spices, and seasonings, as well as other products with a well-known value and local demand. This fuels the sales of herb & spice extracts in the region.
The pandemic's global reach would significantly influence agriculture products, and moving forward, most of the food and beverage industry will see a sharp increase in raw material costs. This would impact the purchasing power.
Get the data you need at a Fraction of the cost
Personalize your report by choosing insights you need
and save 40%!
Herb and spice extract manufacturers prioritize research and development projects in order to provide clients with new and improved goods. Companies form collaborations with other manufacturers in order to develop potential products that will suit the needs of their customers.
Manufacturers are also making significant investments in sophisticated manufacturing technology to boost process efficiency while lowering manufacturing costs and time. Market players are also using backward integration to purchase raw materials from manufacturers.
Synthite Industries Ltd., for example, has incorporated Farmtech, a backward-integrated raw-materials sustainable project, to work directly with farmers and maintain the quality of fresh ingredients, pushing the sales of herb & spice extracts.
Key Players
The growing agro-industry has held growth prospects for the market. This scenario has made the startup landscape extend its boundaries. New companies work for multiple extractions technology such as steam distillation, infusion, digestion, and percolation. Startups are also reaching consumers through increased awareness and familiarity, forming multiple strategies for enhancing the eating patterns of end users. Let’s look at some of the major startup plans that have developed in the market ecosystem:
With the rise of multiple diseases, the conventional herbal method for relief is being used. The taste and odor are what drive the sales of beverages and food items. Though healthfulness, convenience, and sustainability are the major driving force for the herbs and spice extracts. Food products use it for nutrients and taste enhancements, while pharmaceuticals use its oil extracts to prevent and cure multiple diseases. Food producers and manufacturers are extending their nutritional benefits to consumers who cook food at home and prefer healthy eating.
The best quality extracts are obtained with the pinch of innovation and technology. Steam distillation is used for the isolation of antimicrobial and antioxidant compounds from herbs and spices. For example, clove, rosemary, and thyme hold these compounds that can be extracted further for industrial applications.
Product Development:
Herb & spice extracts market outlook explains that from diluting the ingredient to solubilizing it, the raw material's natural flavor can be obtained and further used to enhance the product development procedure. This happens as new components get added to the product, helping it grow and reach the masses easily.
Food products without any essential oil and flavor create and vicious circle for the vendor as the demand for these products keeps on reducing. While spice and herb extracts and flavors deliver odor and taste components in versatile forms and for a variety of purposes. It fuels the demand for herb & spice extracts.
Attribute | Details |
---|---|
Forecast Period | 2023 to 2033 |
Historical Data Available for | 2018 to 2023 |
Market Analysis | USD billion for Value and Units for Volume |
Key Regions Covered |
|
Key Countries Covered |
|
Key Segments Covered |
|
Key Companies Profiled |
|
Report Coverage | Market Forecast, Company Share Analysis, Competitive Landscape, DROT Analysis, Market Dynamics and Challenges, and Strategic Growth Initiatives |
Customization & Pricing | Available upon Request |
The market crossed US$ 16.7 billion in 2022.
The market is projected to reach a market valuation of US$ 23.6 billion by 2032 end.
The market is expected to advance at a CAGR of 3.5% through 2032.
Givaudan SA, Fermanich SA, and Kerry Group Plc. Are key players in the market.
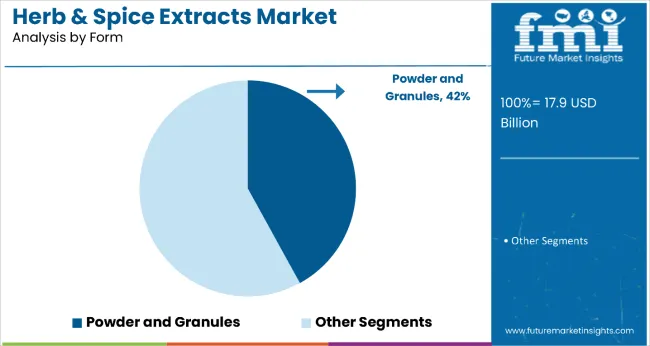
The rising demand for powder forms of spice and herb extract is in high demand.
1. Executive Summary 1.1. Global Market Outlook 1.2. Demand-side Trends 1.3. Supply-side Trends 1.4. Technology Roadmap Analysis 1.5. Analysis and Recommendations 2. Market Overview 2.1. Market Coverage / Taxonomy 2.2. Market Definition / Scope / Limitations 3. Market Background 3.1. Market Dynamics 3.1.1. Drivers 3.1.2. Restraints 3.1.3. Opportunity 3.1.4. Trends 3.2. Scenario Forecast 3.2.1. Demand in Optimistic Scenario 3.2.2. Demand in Likely Scenario 3.2.3. Demand in Conservative Scenario 3.3. Opportunity Map Analysis 3.4. Product Life Cycle Analysis 3.5. Supply Chain Analysis 3.5.1. Supply Side Participants and their Roles 3.5.1.1. Producers 3.5.1.2. Mid-Level Participants (Traders/ Agents/ Brokers) 3.5.1.3. Wholesalers and Distributors 3.5.2. Value Added and Value Created at Node in the Supply Chain 3.5.3. List of Raw Material Suppliers 3.5.4. List of Existing and Potential Buyer’s 3.6. Investment Feasibility Matrix 3.7. Value Chain Analysis 3.7.1. Profit Margin Analysis 3.7.2. Wholesalers and Distributors 3.7.3. Retailers 3.8. PESTLE and Porter’s Analysis 3.9. Regulatory Landscape 3.9.1. By Key Regions 3.9.2. By Key Countries 3.10. Regional Parent Market Outlook 3.11. Production and Consumption Statistics 3.12. Import and Export Statistics 4. Global Market Analysis 2017 to 2022 and Forecast, 2023 to 2033 4.1. Historical Market Size Value (US$ Million) & Volume (MT) Analysis, 2017 to 2022 4.2. Current and Future Market Size Value (US$ Million) & Volume (MT) Projections, 2023 to 2033 4.2.1. Y-o-Y Growth Trend Analysis 4.2.2. Absolute $ Opportunity Analysis 5. Global Market Analysis 2017 to 2022 and Forecast 2023 to 2033, By Product Type 5.1. Introduction / Key Findings 5.2. Historical Market Size Value (US$ Million) & Volume (MT) Analysis By Product Type, 2017 to 2022 5.3. Current and Future Market Size Value (US$ Million) & Volume (MT) Analysis and Forecast By Product Type, 2023 to 2033 5.3.1. Herbs 5.3.2. Spices 5.3.3. Paprila 5.3.4. Cumin 5.4. Y-o-Y Growth Trend Analysis By Product Type, 2017 to 2022 5.5. Absolute $ Opportunity Analysis By Product Type, 2023 to 2033 6. Global Market Analysis 2017 to 2022 and Forecast 2023 to 2033, By End Use 6.1. Introduction / Key Findings 6.2. Historical Market Size Value (US$ Million) & Volume (MT) Analysis By End Use, 2017 to 2022 6.3. Current and Future Market Size Value (US$ Million) & Volume (MT) Analysis and Forecast By End Use, 2023 to 2033 6.3.1. Food 6.3.1.1. Biscuits 6.3.1.2. Breads/Cakes 6.3.1.3. Candies 6.3.1.4. Other Baked Goods 6.3.1.5. Snacks 6.3.1.6. Butter Ice Creams 6.3.1.7. Cheese/Cheese Products 6.3.1.8. Flavored Milk 6.3.1.9. Other Dairy Products 6.3.1.10. Flavored/Infused Oils 6.3.1.11. Processed Food 6.3.1.12. Sauces, Dressings, and Condiments 6.3.1.13. Snacks & Savory Products 6.3.1.14. Soups 6.3.1.15. Others 6.3.2. Beverage 6.3.3. Food Service 6.3.4. Retail 6.4. Y-o-Y Growth Trend Analysis By End Use, 2017 to 2022 6.5. Absolute $ Opportunity Analysis By End Use, 2023 to 2033 7. Global Market Analysis 2017 to 2022 and Forecast 2023 to 2033, By Form 7.1. Introduction / Key Findings 7.2. Historical Market Size Value (US$ Million) & Volume (MT) Analysis By Form, 2017 to 2022 7.3. Current and Future Market Size Value (US$ Million) & Volume (MT) Analysis and Forecast By Form, 2023 to 2033 7.3.1. Flakes 7.3.2. Paste 7.3.3. Powder & Granules 7.3.4. Whole/Fresh 7.4. Y-o-Y Growth Trend Analysis By Form, 2017 to 2022 7.5. Absolute $ Opportunity Analysis By Form, 2023 to 2033 8. Global Market Analysis 2017 to 2022 and Forecast 2023 to 2033, By Sales Channel 8.1. Introduction / Key Findings 8.2. Historical Market Size Value (US$ Million) & Volume (MT) Analysis By Sales Channel, 2017 to 2022 8.3. Current and Future Market Size Value (US$ Million) & Volume (MT) Analysis and Forecast By Sales Channel, 2023 to 2033 8.3.1. Direct 8.3.2. Indirect 8.3.2.1. Online Retail 8.3.2.2. Store-based Retailing 8.4. Y-o-Y Growth Trend Analysis By Sales Channel, 2017 to 2022 8.5. Absolute $ Opportunity Analysis By Sales Channel, 2023 to 2033 9. Global Market Analysis 2017 to 2022 and Forecast 2023 to 2033, By Nature 9.1. Introduction / Key Findings 9.2. Historical Market Size Value (US$ Million) & Volume (MT) Analysis By Nature, 2017 to 2022 9.3. Current and Future Market Size Value (US$ Million) & Volume (MT) Analysis and Forecast By Nature, 2023 to 2033 9.3.1. Conventional 9.3.2. Natural 9.3.3. Non-GMO 9.3.4. Organic 9.3.5. Vegan 9.4. Y-o-Y Growth Trend Analysis By Nature, 2017 to 2022 9.5. Absolute $ Opportunity Analysis By Nature, 2023 to 2033 10. Global Market Analysis 2017 to 2022 and Forecast 2023 to 2033, By Region 10.1. Introduction 10.2. Historical Market Size Value (US$ Million) & Volume (MT) Analysis By Region, 2017 to 2022 10.3. Current Market Size Value (US$ Million) & Volume (MT) Analysis and Forecast By Region, 2023 to 2033 10.3.1. North America 10.3.2. Latin America 10.3.3. Europe 10.3.4. East Asia 10.3.5. South Asia 10.3.6. Oceania 10.3.7. MEA 10.4. Market Attractiveness Analysis By Region 11. North America Market Analysis 2017 to 2022 and Forecast 2023 to 2033, By Country 11.1. Historical Market Size Value (US$ Million) & Volume (MT) Trend Analysis By Market Taxonomy, 2017 to 2022 11.2. Market Size Value (US$ Million) & Volume (MT) Forecast By Market Taxonomy, 2023 to 2033 11.2.1. By Country 11.2.1.1. U.S. 11.2.1.2. Canada 11.2.2. By Product Type 11.2.3. By End Use 11.2.4. By Form 11.2.5. By Sales Channel 11.2.6. By Nature 11.3. Market Attractiveness Analysis 11.3.1. By Country 11.3.2. By Product Type 11.3.3. By End Use 11.3.4. By Form 11.3.5. By Sales Channel 11.3.6. By Nature 11.4. Key Takeaways 12. Latin America Market Analysis 2017 to 2022 and Forecast 2023 to 2033, By Country 12.1. Historical Market Size Value (US$ Million) & Volume (MT) Trend Analysis By Market Taxonomy, 2017 to 2022 12.2. Market Size Value (US$ Million) & Volume (MT) Forecast By Market Taxonomy, 2023 to 2033 12.2.1. By Country 12.2.1.1. Argentina 12.2.1.2. Brazil 12.2.1.3. Chile 12.2.1.4. Mexico 12.2.1.5. Peru 12.2.1.6. Rest of Latin America 12.2.2. By Product Type 12.2.3. By End Use 12.2.4. By Form 12.2.5. By Sales Channel 12.2.6. By Nature 12.3. Market Attractiveness Analysis 12.3.1. By Country 12.3.2. By Product Type 12.3.3. By End Use 12.3.4. By Form 12.3.5. By Sales Channel 12.3.6. By Nature 12.4. Key Takeaways 13. Europe Market Analysis 2017 to 2022 and Forecast 2023 to 2033, By Country 13.1. Historical Market Size Value (US$ Million) & Volume (MT) Trend Analysis By Market Taxonomy, 2017 to 2022 13.2. Market Size Value (US$ Million) & Volume (MT) Forecast By Market Taxonomy, 2023 to 2033 13.2.1. By Country 13.2.1.1. Benelux 13.2.1.2. EU-4 13.2.1.3. Nordics 13.2.1.4. Poland 13.2.1.5. Russia 13.2.1.6. U.K. 13.2.1.7. Rest of Europe 13.2.2. By Product Type 13.2.3. By End Use 13.2.4. By Form 13.2.5. By Sales Channel 13.2.6. By Nature 13.3. Market Attractiveness Analysis 13.3.1. By Country 13.3.2. By Product Type 13.3.3. By End Use 13.3.4. By Form 13.3.5. By Sales Channel 13.3.6. By Nature 13.4. Key Takeaways 14. East Asia Market Analysis 2017 to 2022 and Forecast 2023 to 2033, By Country 14.1. Historical Market Size Value (US$ Million) & Volume (MT) Trend Analysis By Market Taxonomy, 2017 to 2022 14.2. Market Size Value (US$ Million) & Volume (MT) Forecast By Market Taxonomy, 2023 to 2033 14.2.1. By Country 14.2.1.1. China 14.2.1.2. Japan 14.2.1.3. South Korea 14.2.2. By Product Type 14.2.3. By End Use 14.2.4. By Form 14.2.5. By Sales Channel 14.2.6. By Nature 14.3. Market Attractiveness Analysis 14.3.1. By Country 14.3.2. By Product Type 14.3.3. By End Use 14.3.4. By Form 14.3.5. By Sales Channel 14.3.6. By Nature 14.4. Key Takeaways 15. South Asia Market Analysis 2017 to 2022 and Forecast 2023 to 2033, By Country 15.1. Historical Market Size Value (US$ Million) & Volume (MT) Trend Analysis By Market Taxonomy, 2017 to 2022 15.2. Market Size Value (US$ Million) & Volume (MT) Forecast By Market Taxonomy, 2023 to 2033 15.2.1. By Country 15.2.1.1. India 15.2.1.2. Indonesia 15.2.1.3. Malaysia 15.2.1.4. Singapore 15.2.1.5. Thailand 15.2.1.6. Rest of South Asia 15.2.2. By Product Type 15.2.3. By End Use 15.2.4. By Form 15.2.5. By Sales Channel 15.2.6. By Nature 15.3. Market Attractiveness Analysis 15.3.1. By Country 15.3.2. By Product Type 15.3.3. By End Use 15.3.4. By Form 15.3.5. By Sales Channel 15.3.6. By Nature 15.4. Key Takeaways 16. Oceania Market Analysis 2017 to 2022 and Forecast 2023 to 2033, By Country 16.1. Historical Market Size Value (US$ Million) & Volume (MT) Trend Analysis By Market Taxonomy, 2017 to 2022 16.2. Market Size Value (US$ Million) & Volume (MT) Forecast By Market Taxonomy, 2023 to 2033 16.2.1. By Country 16.2.1.1. Australia 16.2.1.2. New Zealand 16.2.2. By Product Type 16.2.3. By End Use 16.2.4. By Form 16.2.5. By Sales Channel 16.2.6. By Nature 16.3. Market Attractiveness Analysis 16.3.1. By Country 16.3.2. By Product Type 16.3.3. By End Use 16.3.4. By Form 16.3.5. By Sales Channel 16.3.6. By Nature 16.4. Key Takeaways 17. MEA Market Analysis 2017 to 2022 and Forecast 2023 to 2033, By Country 17.1. Historical Market Size Value (US$ Million) & Volume (MT) Trend Analysis By Market Taxonomy, 2017 to 2022 17.2. Market Size Value (US$ Million) & Volume (MT) Forecast By Market Taxonomy, 2023 to 2033 17.2.1. By Country 17.2.1.1. GCC Countries 17.2.1.2. South Africa 17.2.1.3. Turkey 17.2.1.4. Rest of MEA 17.2.2. By Product Type 17.2.3. By End Use 17.2.4. By Form 17.2.5. By Sales Channel 17.2.6. By Nature 17.3. Market Attractiveness Analysis 17.3.1. By Country 17.3.2. By Product Type 17.3.3. By End Use 17.3.4. By Form 17.3.5. By Sales Channel 17.3.6. By Nature 17.4. Key Takeaways 18. Key Countries Market Analysis 18.1. U.S. 18.1.1. Pricing Analysis 18.1.2. Market Share Analysis, 2022 18.1.2.1. By Product Type 18.1.2.2. By End Use 18.1.2.3. By Form 18.1.2.4. By Sales Channel 18.1.2.5. By Nature 18.2. Canada 18.2.1. Pricing Analysis 18.2.2. Market Share Analysis, 2022 18.2.2.1. By Product Type 18.2.2.2. By End Use 18.2.2.3. By Form 18.2.2.4. By Sales Channel 18.2.2.5. By Nature 18.3. Argentina 18.3.1. Pricing Analysis 18.3.2. Market Share Analysis, 2022 18.3.2.1. By Product Type 18.3.2.2. By End Use 18.3.2.3. By Form 18.3.2.4. By Sales Channel 18.3.2.5. By Nature 18.4. Brazil 18.4.1. Pricing Analysis 18.4.2. Market Share Analysis, 2022 18.4.2.1. By Product Type 18.4.2.2. By End Use 18.4.2.3. By Form 18.4.2.4. By Sales Channel 18.4.2.5. By Nature 18.5. Chile 18.5.1. Pricing Analysis 18.5.2. Market Share Analysis, 2022 18.5.2.1. By Product Type 18.5.2.2. By End Use 18.5.2.3. By Form 18.5.2.4. By Sales Channel 18.5.2.5. By Nature 18.6. Mexico 18.6.1. Pricing Analysis 18.6.2. Market Share Analysis, 2022 18.6.2.1. By Product Type 18.6.2.2. By End Use 18.6.2.3. By Form 18.6.2.4. By Sales Channel 18.6.2.5. By Nature 18.7. Peru 18.7.1. Pricing Analysis 18.7.2. Market Share Analysis, 2022 18.7.2.1. By Product Type 18.7.2.2. By End Use 18.7.2.3. By Form 18.7.2.4. By Sales Channel 18.7.2.5. By Nature 18.8. Benelux 18.8.1. Pricing Analysis 18.8.2. Market Share Analysis, 2022 18.8.2.1. By Product Type 18.8.2.2. By End Use 18.8.2.3. By Form 18.8.2.4. By Sales Channel 18.8.2.5. By Nature 18.9. EU-4 18.9.1. Pricing Analysis 18.9.2. Market Share Analysis, 2022 18.9.2.1. By Product Type 18.9.2.2. By End Use 18.9.2.3. By Form 18.9.2.4. By Sales Channel 18.9.2.5. By Nature 18.10. Nordics 18.10.1. Pricing Analysis 18.10.2. Market Share Analysis, 2022 18.10.2.1. By Product Type 18.10.2.2. By End Use 18.10.2.3. By Form 18.10.2.4. By Sales Channel 18.10.2.5. By Nature 18.11. Poland 18.11.1. Pricing Analysis 18.11.2. Market Share Analysis, 2022 18.11.2.1. By Product Type 18.11.2.2. By End Use 18.11.2.3. By Form 18.11.2.4. By Sales Channel 18.11.2.5. By Nature 18.12. Russia 18.12.1. Pricing Analysis 18.12.2. Market Share Analysis, 2022 18.12.2.1. By Product Type 18.12.2.2. By End Use 18.12.2.3. By Form 18.12.2.4. By Sales Channel 18.12.2.5. By Nature 18.13. U.K. 18.13.1. Pricing Analysis 18.13.2. Market Share Analysis, 2022 18.13.2.1. By Product Type 18.13.2.2. By End Use 18.13.2.3. By Form 18.13.2.4. By Sales Channel 18.13.2.5. By Nature 18.14. China 18.14.1. Pricing Analysis 18.14.2. Market Share Analysis, 2022 18.14.2.1. By Product Type 18.14.2.2. By End Use 18.14.2.3. By Form 18.14.2.4. By Sales Channel 18.14.2.5. By Nature 18.15. Japan 18.15.1. Pricing Analysis 18.15.2. Market Share Analysis, 2022 18.15.2.1. By Product Type 18.15.2.2. By End Use 18.15.2.3. By Form 18.15.2.4. By Sales Channel 18.15.2.5. By Nature 18.16. South Korea 18.16.1. Pricing Analysis 18.16.2. Market Share Analysis, 2022 18.16.2.1. By Product Type 18.16.2.2. By End Use 18.16.2.3. By Form 18.16.2.4. By Sales Channel 18.16.2.5. By Nature 18.17. India 18.17.1. Pricing Analysis 18.17.2. Market Share Analysis, 2022 18.17.2.1. By Product Type 18.17.2.2. By End Use 18.17.2.3. By Form 18.17.2.4. By Sales Channel 18.17.2.5. By Nature 18.18. Indonesia 18.18.1. Pricing Analysis 18.18.2. Market Share Analysis, 2022 18.18.2.1. By Product Type 18.18.2.2. By End Use 18.18.2.3. By Form 18.18.2.4. By Sales Channel 18.18.2.5. By Nature 18.19. Malaysia 18.19.1. Pricing Analysis 18.19.2. Market Share Analysis, 2022 18.19.2.1. By Product Type 18.19.2.2. By End Use 18.19.2.3. By Form 18.19.2.4. By Sales Channel 18.19.2.5. By Nature 18.20. Singapore 18.20.1. Pricing Analysis 18.20.2. Market Share Analysis, 2022 18.20.2.1. By Product Type 18.20.2.2. By End Use 18.20.2.3. By Form 18.20.2.4. By Sales Channel 18.20.2.5. By Nature 18.21. Thailand 18.21.1. Pricing Analysis 18.21.2. Market Share Analysis, 2022 18.21.2.1. By Product Type 18.21.2.2. By End Use 18.21.2.3. By Form 18.21.2.4. By Sales Channel 18.21.2.5. By Nature 18.22. Australia 18.22.1. Pricing Analysis 18.22.2. Market Share Analysis, 2022 18.22.2.1. By Product Type 18.22.2.2. By End Use 18.22.2.3. By Form 18.22.2.4. By Sales Channel 18.22.2.5. By Nature 18.23. New Zealand 18.23.1. Pricing Analysis 18.23.2. Market Share Analysis, 2022 18.23.2.1. By Product Type 18.23.2.2. By End Use 18.23.2.3. By Form 18.23.2.4. By Sales Channel 18.23.2.5. By Nature 18.24. GCC Countries 18.24.1. Pricing Analysis 18.24.2. Market Share Analysis, 2022 18.24.2.1. By Product Type 18.24.2.2. By End Use 18.24.2.3. By Form 18.24.2.4. By Sales Channel 18.24.2.5. By Nature 18.25. South Africa 18.25.1. Pricing Analysis 18.25.2. Market Share Analysis, 2022 18.25.2.1. By Product Type 18.25.2.2. By End Use 18.25.2.3. By Form 18.25.2.4. By Sales Channel 18.25.2.5. By Nature 18.26. Turkey 18.26.1. Pricing Analysis 18.26.2. Market Share Analysis, 2022 18.26.2.1. By Product Type 18.26.2.2. By End Use 18.26.2.3. By Form 18.26.2.4. By Sales Channel 18.26.2.5. By Nature 19. Market Structure Analysis 19.1. Competition Dashboard 19.2. Competition Benchmarking 19.3. Market Share Analysis of Top Players 19.3.1. By Regional 19.3.2. By Product Type 19.3.3. By End Use 19.3.4. By Form 19.3.5. By Sales Channel 19.3.6. By Nature 20. Competition Analysis 20.1. Competition Deep Dive 20.1.1. Givaudan S.A 20.1.1.1. Overview 20.1.1.2. Product Portfolio 20.1.1.3. Profitability by Market Segments 20.1.1.4. Sales Footprint 20.1.1.5. Strategy Overview 20.1.1.5.1. Marketing Strategy 20.1.1.5.2. Product Strategy 20.1.1.5.3. Channel Strategy 20.1.2. Kerry Group Plc. 20.1.2.1. Overview 20.1.2.2. Product Portfolio 20.1.2.3. Profitability by Market Segments 20.1.2.4. Sales Footprint 20.1.2.5. Strategy Overview 20.1.2.5.1. Marketing Strategy 20.1.2.5.2. Product Strategy 20.1.2.5.3. Channel Strategy 20.1.3. Takasago International Corporation 20.1.3.1. Overview 20.1.3.2. Product Portfolio 20.1.3.3. Profitability by Market Segments 20.1.3.4. Sales Footprint 20.1.3.5. Strategy Overview 20.1.3.5.1. Marketing Strategy 20.1.3.5.2. Product Strategy 20.1.3.5.3. Channel Strategy 20.1.4. Sensient Technologies Corporation 20.1.4.1. Overview 20.1.4.2. Product Portfolio 20.1.4.3. Profitability by Market Segments 20.1.4.4. Sales Footprint 20.1.4.5. Strategy Overview 20.1.4.5.1. Marketing Strategy 20.1.4.5.2. Product Strategy 20.1.4.5.3. Channel Strategy 20.1.5. Archer Daniels Midland Company 20.1.5.1. Overview 20.1.5.2. Product Portfolio 20.1.5.3. Profitability by Market Segments 20.1.5.4. Sales Footprint 20.1.5.5. Strategy Overview 20.1.5.5.1. Marketing Strategy 20.1.5.5.2. Product Strategy 20.1.5.5.3. Channel Strategy 20.1.6. Ajinomoto Co., Inc. 20.1.6.1. Overview 20.1.6.2. Product Portfolio 20.1.6.3. Profitability by Market Segments 20.1.6.4. Sales Footprint 20.1.6.5. Strategy Overview 20.1.6.5.1. Marketing Strategy 20.1.6.5.2. Product Strategy 20.1.6.5.3. Channel Strategy 20.1.7. Symrise AG 20.1.7.1. Overview 20.1.7.2. Product Portfolio 20.1.7.3. Profitability by Market Segments 20.1.7.4. Sales Footprint 20.1.7.5. Strategy Overview 20.1.7.5.1. Marketing Strategy 20.1.7.5.2. Product Strategy 20.1.7.5.3. Channel Strategy 20.1.8. Firmenich SA 20.1.8.1. Overview 20.1.8.2. Product Portfolio 20.1.8.3. Profitability by Market Segments 20.1.8.4. Sales Footprint 20.1.8.5. Strategy Overview 20.1.8.5.1. Marketing Strategy 20.1.8.5.2. Product Strategy 20.1.8.5.3. Channel Strategy 20.1.9. Kalsec Inc. 20.1.9.1. Overview 20.1.9.2. Product Portfolio 20.1.9.3. Profitability by Market Segments 20.1.9.4. Sales Footprint 20.1.9.5. Strategy Overview 20.1.9.5.1. Marketing Strategy 20.1.9.5.2. Product Strategy 20.1.9.5.3. Channel Strategy 20.1.10. Olam International 20.1.10.1. Overview 20.1.10.2. Product Portfolio 20.1.10.3. Profitability by Market Segments 20.1.10.4. Sales Footprint 20.1.10.5. Strategy Overview 20.1.10.5.1. Marketing Strategy 20.1.10.5.2. Product Strategy 20.1.10.5.3. Channel Strategy 20.1.11. McCormick & Company, Inc. 20.1.11.1. Overview 20.1.11.2. Product Portfolio 20.1.11.3. Profitability by Market Segments 20.1.11.4. Sales Footprint 20.1.11.5. Strategy Overview 20.1.11.5.1. Marketing Strategy 20.1.11.5.2. Product Strategy 20.1.11.5.3. Channel Strategy 20.1.12. Frutarom Industries Ltd 20.1.12.1. Overview 20.1.12.2. Product Portfolio 20.1.12.3. Profitability by Market Segments 20.1.12.4. Sales Footprint 20.1.12.5. Strategy Overview 20.1.12.5.1. Marketing Strategy 20.1.12.5.2. Product Strategy 20.1.12.5.3. Channel Strategy 20.1.13. Robertet SA 20.1.13.1. Overview 20.1.13.2. Product Portfolio 20.1.13.3. Profitability by Market Segments 20.1.13.4. Sales Footprint 20.1.13.5. Strategy Overview 20.1.13.5.1. Marketing Strategy 20.1.13.5.2. Product Strategy 20.1.13.5.3. Channel Strategy 20.1.14. Synthite Industries Ltd 20.1.14.1. Overview 20.1.14.2. Product Portfolio 20.1.14.3. Profitability by Market Segments 20.1.14.4. Sales Footprint 20.1.14.5. Strategy Overview 20.1.14.5.1. Marketing Strategy 20.1.14.5.2. Product Strategy 20.1.14.5.3. Channel Strategy 20.1.15. International Taste Solutions Ltd 20.1.15.1. Overview 20.1.15.2. Product Portfolio 20.1.15.3. Profitability by Market Segments 20.1.15.4. Sales Footprint 20.1.15.5. Strategy Overview 20.1.15.5.1. Marketing Strategy 20.1.15.5.2. Product Strategy 20.1.15.5.3. Channel Strategy 21. Assumptions & Acronyms Used 22. Research Methodology
Explore Food and Beverage Insights
View Reports