Hermansky Pudlak Syndrome Therapeutics Market
Market Insights on Hermansky Pudlak Syndrome Therapeutics covering sales outlook, demand forecast & up-to-date key trends
Helicobacter Pylori Infections Treatment Market by Treatment, Application & Region | Forecast 2023 to 2033
Hermansky Pudlak Syndrome Therapeutics Market Snapshot (2023 to 2033)
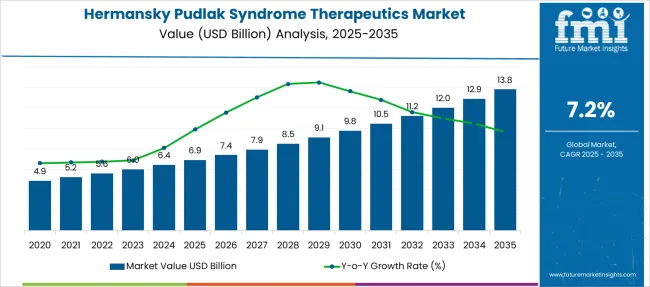
The global hermansky pudlak syndrome Therapeutics market garnered a market value of US$ 6 Billion in 2023 and is expected to accumulate a market value of US$ 12 Billion by registering a CAGR of 7.2% in the forecast period 2023 to 2033. High expenditures in R&D efforts relating to the generation of recombinant factors, as well as improvements in the technology used to treat hermansky pudlak syndrome among patients, are important drivers for the rise of the worldwide hermansky pudlak syndrome Therapeutics market.
The vast consumer base increased awareness of bleeding problems and accessible remedies, and advantageous compensation policies drive the industry. The patent expiration of current brands will also create possibilities for generic medication makers to enter the lucrative hermansky pudlak syndrome Therapeutics industry.
Due to the high cost of branded medications, the market for hermansky pudlak syndrome Therapeutics is mostly concentrated in Western nations such as North America and Europe. Low-cost medications would aid market penetration in undeveloped and underdeveloped nations where patients cannot afford expensive medical Therapeutics. As a result, the availability of low-cost generic pharmaceuticals would drive market growth in the Middle East and Africa, Asia-Pacific (APAC), and Latin America.
Data Points |
Key Statistics |
Expected Market Value (2023) |
US$ 6 Billion |
Anticipated Forecast Value (2033) |
US$ 12 Billion |
Projected Growth Rate (2023 to 2033) |
7.2% CAGR |
Don't pay for what you don't need
Customize your report by selecting specific countries or regions and save 30%!
Hermansky Pudlak Syndrome Therapeutics Demand Analysis (2018 to 2022) Vs Market Outlook (2023 to 2033)
The global demand for hermansky pudlak syndrome Therapeutics is projected to increase at a CAGR of 7.2% during the forecast period between 2023 and 2033, reaching a total of US$ 12 Billion in 2033, according to a report from Future Market Insights (FMI). From 2018 to 2022, sales witnessed significant growth, registering a CAGR of 6%.
The increased frequency of hermansky pudlak syndrome among the general population, as well as the growing elderly population, which is more vulnerable to certain medical diseases, is among the primary drivers driving the global market. Additionally, the increasing acceptance of health insurance policies that give financial support for hermansky pudlak syndrome Therapeutics and lower healthcare costs is favorably affecting the market.
Furthermore, various countries' governments are raising awareness regarding blood and plasma donation. They are also promoting blood donation camps through various programs. Aside from that, rising knowledge regarding the availability of viable Therapeutics options is boosting the market's prospects. Hence, the Research and Development initiatives and significant advances in healthcare infrastructure and diagnostic technologies are projected to create a positive outlook for the industry.
Which are Some Prominent Drivers of Hermansky Pudlak Syndrome Therapeutics Market?
Increasing Prevalence of Blood Coagulation Disorders to Improve Maintenance and Performance
Hermansky-Pudlak syndrome is a rare hereditary disorder that produces unusually pale skin, hair, and eye pigmentation (oculocutaneous albinism). People with the syndrome are more likely to develop blood issues, and lung, and digestive problems, and are more vulnerable to UV damage.
The majority of bleeding problems are inherited, although some are acquired as a result of liver illness, pharmaceutical side effects, low red blood cell count, vitamin K insufficiency, and other factors. Due to an increase in the number of individuals suffering from liver illnesses, anemia, and other blood coagulation disorders, the bleeding disorders Therapeutics market is predicted to rise rapidly over the forecast period.
Positive Government Initiatives in Developed Countries to Fuel Market Growth
The hermansky-pudlak syndrome therapeutics market is expanding due to an increase in the number of patients diagnosed with bleeding disorders, increased research and development activities and investments by key players, increased awareness about bleeding disorders, and positive government initiatives in developed countries aimed at establishing a large network of diagnosis and Therapeutics centers, which are complementing market growth.
Find your sweet spots for generating winning opportunities in this market.
Talk to AnalystWhich are the Trough Areas faced by the Hermansky Pudlak Syndrome Therapeutics Market?
A Dearth of Qualified Professionals is expected to be a Major Impediment to Market Growth
The scarcity of skilled specialists and talented professionals would be a key impediment to the market's growth for bleeding disorders testing. Medication pricing will also limit the market growth.
Inadequate reimbursement rules will also restrict the breadth. Unprofessional therapy can have major health effects on patients. This challenge is stifling market growth.
Low Regulatory Compliance will stifle Market Growth
The failure of national organizations and other institutions in poor countries to raise awareness about certain ailments resulted in low testing penetration. This issue stifles market growth by hindering early diagnosis and appropriate patient care.
Region-Wise Insights
How will Hermansky Pudlak Syndrome Therapeutics Market Demand progress in the Asia Pacific?
Government Initiative to Improve Healthcare Infrastructure Expands Profit Margins
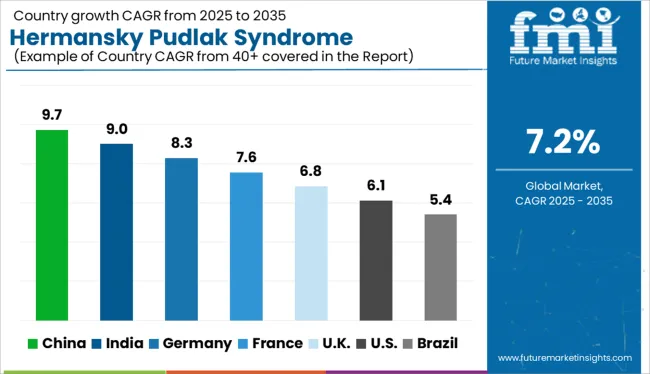
The Asia Pacific area is expected to increase rapidly over the projected period of 2023 to 2033. As a result of increased awareness of bleeding disorders and Therapeutics options, Asia-Pacific is expected to grow at a rapid pace in the coming years, increasing the global hermansky-pudlak syndrome Therapeutics market.
Furthermore, the market share in the Asia-Pacific region is expected to expand in the near future as a result of improved access to Therapeutics facilities and the rising need for increased government efforts, sophisticated technology, higher adoption rates, and rising healthcare spending. As per Future Market Insights, the Asia Pacific is expected to grow at a CAGR of 6.9% in the assessment period 2023 to 2033.
How attractive are Growth Prospects for Hermansky Pudlak Syndrome Therapeutics Market in North America?
Better Healthcare Facilities to Accelerate Market Growth
Due to its cost-effectiveness and access to healthcare facilities, North America is likely to lead the global hermansky-pudlak syndrome Therapeutics market. Patient awareness of bleeding disorders, as well as private-sector and government Therapeutics initiatives, is assisting in market development.
Because of the preliminary stage acceptance of proven medical technology, the market in the area is the rapid ongoing expansion of firms operating in the drug sector. Because of the growing incidence of various blood illnesses and increased patient awareness in this field, North America is expected to have a considerable market position in the market. North America is expected to grow at a CAGR of 7.1% in the assessment period 2023 to 2033.
What are the Major Factors Favouring Growth of the Hermansky Pudlak Syndrome Therapeutics Market in Europe?
Technological Advancement fuelling the Market Growth
Europe is predicted to have the second-greatest market share. Factors such as an increase in research costs, technological advancement, deteriorating human health, and the need for novel and effective medicines drive the expansion of the market in this area. Thus, owing to the aforementioned reasons, Europe is expected to grow at a CAGR of 7% in the assessment period 2023 to 2033.
Get the data you need at a Fraction of the cost
Personalize your report by choosing insights you need
and save 40%!
Category-Wise Insights
Which End User Segment is the Most Prominent in Hermansky Pudlak Syndrome Therapeutics Market?
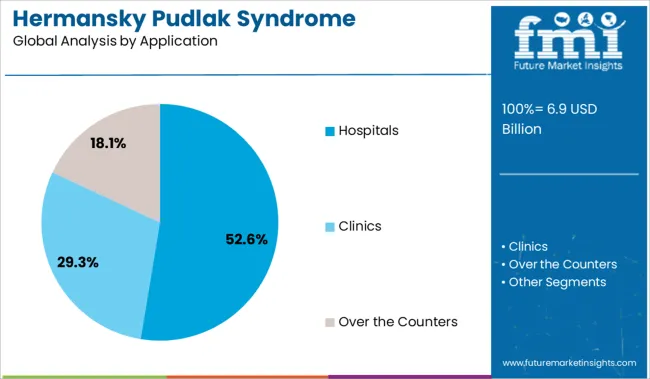
The Hospital Segment to enhance Sales Prospects
During the evaluation period, the hospital segment is predicted to be the quickest category. This is due to the high hospitalization rate of SMA. Because of the significant risk and scoliosis, the majority of clients are treated in hospitals. According to the Orphanet Journal of Rare Diseases (2020), children patients aged 0 to 4 years had the greatest inpatient ratio.
Start-Ups for Hermansky Pudlak Syndrome Therapeutics Market
Key start-up players in the automotive axles are offering new and innovative product lines to consolidate their market presence, these aforementioned start-ups have left no stone unturned. Some specific instances of key Hermansky Pudlak Syndrome Therapeutics start-ups are as follows:
- Scenic Biotech, an Israeli firm, finds genetic modifiers. Cell-Seq, the company's proprietary genomics platform, seeks disease suppressors or genes that counterbalance the action of a disease-causing gene. Cell-Seq employs unique human cells that have just one copy of each gene (haploid), rather than the typical two (diploid). The company detects and chooses genes that prevent illness inheritance among descendants. Scenic Biotech builds a library of mutated cells and uses bioinformatics analysis to designate the modifiers against the illnesses they prevent. The firm empowers pharmacists and scientists to create therapeutics for life-threatening disorders such as hereditary rare diseases and cancer.
- E-Zyvec, a French firm, provides personalized DNA vectors. The company focuses on genetic engineering for biopharmaceutical manufacturing. It offers gene editing and modification to introduce genes of interest or to eliminate one or more genetic functions for gene therapy and cell therapy applications. Researchers may use the startup to interpret and study disease-causing genes and modifiers, as well as their influence on illnesses.
- Genome Medical, situated in the United States, allows virtual genetic care and educated healthcare decisions. It makes AI-powered suggestions for illness testing and patient evaluation. The platform combines and analyses diagnostic test findings in the context of demographic and family history data from patients. It forecasts the risk of cancer, heart disease, and other inherited illnesses. This enables physicians and patients to create care pathways and customize therapy. Furthermore, the startup provides clinical assistance for tailored care and Therapeutics through resources, education, and peer consultation.
Market Competition
Leading hermansky pudlak syndrome Therapeutics companies are concentrating on strategic initiatives such as partnership development, acquisitions, mergers, and others. These steps are being taken to improve the market position.
Recent Developments:
- In October 2022, Ferring Pharmaceuticals and Blackstone Life Sciences announced a restructured cooperation in nadofaragene firadonavec, an experimental new gene therapy in late-stage research for patients with high-grade, Bacillus Calmette-Guerin refractory, non-muscle invasive bladder cancer.
- In August 2022, American Regent, Inc., a California-based maker of medicines for human and veterinary use with production facilities in New York and Ohio, announced the acquisition of HBT Labs, Inc. HBT Labs offers a pipeline of generic and 505(b)(2) pharmaceutical medicines that target a variety of therapeutic indications, including cancer and CNS diseases.
Report Scope
Report Attribute |
Details |
Market Value in 2023 |
US$ 6 Billion |
Market Value in 2033 |
US$ 12 Billion |
Growth Rate |
CAGR of 7.2% from 2022 to 2032 |
Base Year for Estimation |
2022 |
Historical Data |
2018 to 2022 |
Forecast Period |
2023 to 2033 |
Quantitative Units |
Revenue in US Billion and CAGR from 2023 to 2033 |
Report Coverage |
Revenue Forecast, Company Ranking, Competitive Landscape, Growth Factors, Trends, and Pricing Analysis |
Segments Covered |
|
Regions Covered |
|
Key Countries Profiled |
|
Key Companies Profiled |
|
Customization |
Available Upon Request |
Key Segments Profiled in the Hermansky Pudlak Syndrome Therapeutics Industry Survey
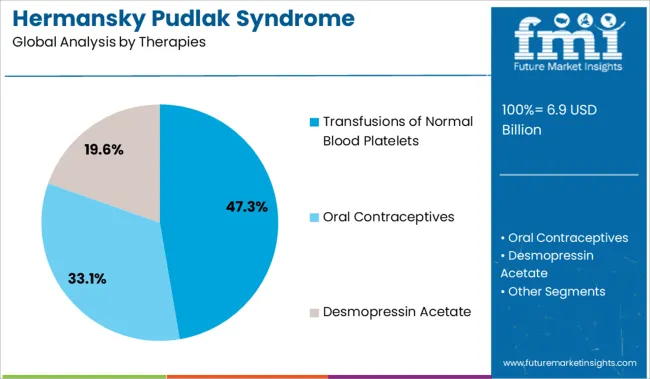
By Therapies:
- Transfusions of Normal Blood Platelets
- Oral Contraceptives
- Desmopressin Acetate
By Application:
- Hospitals
- Clinics
- Over the Counters
By Region:
- North America
- Latin America
- Europe
- Asia Pacific
- Middle East & Africa (MEA)
Frequently Asked Questions
What is the anticipated growth of the hermansky pudlak syndrome Therapeutics market until 2033?
FMI projects the global hermansky pudlak syndrome Therapeutics market to expand at a 7.2% value CAGR by 2033
What is the estimated market value of hermansky pudlak syndrome Therapeutics expected in 2023?
The global hermansky pudlak syndrome Therapeutics market is estimated at a market value of US$ 6 Billion
What is the estimated market value of hermansky pudlak syndrome Therapeutics market expected in 2033?
The global hermansky pudlak syndrome Therapeutics market is expected to garner a market value of US$ 12 Billion
Which region is forecast to be the most lucrative for hermansky pudlak syndrome Therapeutics market growth?
Asia Pacific to be the most lucrative for hermansky pudlak syndrome Therapeutics market growth.
Which are some prominent hermansky pudlak syndrome Therapeutics market players?
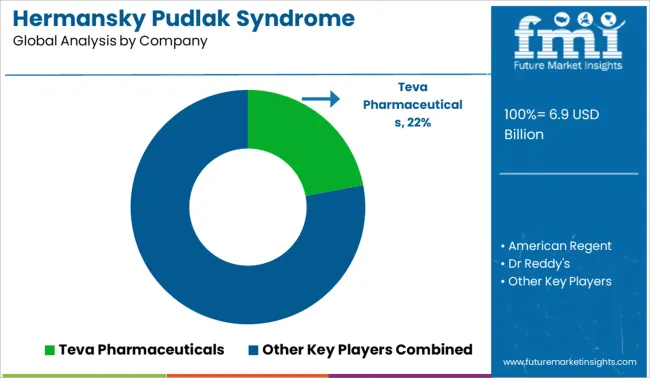
American Regent, Dr Reddy's, Gland Pharma Limited, Sagent Pharma, Sun Pharma, Teva Pharmaceuticals, Ferring Pharmaceuticals, UbiPharm, Allergan PLC and Glenmark Pharmaceuticals are some prominent hermansky pudlak syndrome Therapeutics market players.
What is the expected market share of North America in the hermansky pudlak syndrome Therapeutics market?
North America is expected to grow at a CAGR of 7.1% in the assessment period 2023-2033.
What is the expected market share of Europe for hermansky pudlak syndrome Therapeutics?
Europe is expected to grow at a CAGR of 7% in the assessment period 2023-2033.
Which application is expected to hold the largest market share for hermansky pudlak syndrome Therapeutics in the forecast period 2023-2033?
The hospital segment is expected to hold the largest market share for hermansky pudlak syndrome Therapeutics in the forecast period 2023-2033
Table of Content
1. Executive Summary | Hermansky Pudlak Syndrome Therapeutics Market 1.1. Global Market Outlook 1.2. Demand-side Trends 1.3. Supply-side Trends 1.4. Technology Roadmap Analysis 1.5. Analysis and Recommendations 2. Market Overview 2.1. Market Coverage / Taxonomy 2.2. Market Definition / Scope / Limitations 3. Market Background 3.1. Market Dynamics 3.1.1. Drivers 3.1.2. Restraints 3.1.3. Opportunity 3.1.4. Trends 3.2. Scenario Forecast 3.2.1. Demand in Optimistic Scenario 3.2.2. Demand in Likely Scenario 3.2.3. Demand in Conservative Scenario 3.3. Opportunity Map Analysis 3.4. Investment Feasibility Matrix 3.5. PESTLE and Porter’s Analysis 3.6. Regulatory Landscape 3.6.1. By Key Regions 3.6.2. By Key Countries 3.7. Regional Parent Market Outlook 4. Global Market Analysis 2018 to 2022 and Forecast, 2023 to 2033 4.1. Historical Market Size Value (US$ Million) Analysis, 2018 to 2022 4.2. Current and Future Market Size Value (US$ Million) Projections, 2023 to 2033 4.2.1. Y-o-Y Growth Trend Analysis 4.2.2. Absolute $ Opportunity Analysis 5. Global Market Analysis 2018 to 2022 and Forecast 2023 to 2033, By Therapies 5.1. Introduction / Key Findings 5.2. Historical Market Size Value (US$ Million) Analysis By Therapies, 2018 to 2022 5.3. Current and Future Market Size Value (US$ Million) Analysis and Forecast By Therapies, 2023 to 2033 5.3.1. Transfusions of Normal Blood Platelets 5.3.2. Oral Contraceptives 5.3.3. Desmopressin Acetate 5.4. Y-o-Y Growth Trend Analysis By Therapies, 2018 to 2022 5.5. Absolute $ Opportunity Analysis By Therapies, 2023 to 2033 6. Global Market Analysis 2018 to 2022 and Forecast 2023 to 2033, By Application 6.1. Introduction / Key Findings 6.2. Historical Market Size Value (US$ Million) Analysis By Application, 2018 to 2022 6.3. Current and Future Market Size Value (US$ Million) Analysis and Forecast By Application, 2023 to 2033 6.3.1. Hospitals 6.3.2. Clinics 6.3.3. Over the Counters 6.4. Y-o-Y Growth Trend Analysis By Application, 2018 to 2022 6.5. Absolute $ Opportunity Analysis By Application, 2023 to 2033 7. Global Market Analysis 2018 to 2022 and Forecast 2023 to 2033, By Region 7.1. Introduction 7.2. Historical Market Size Value (US$ Million) Analysis By Region, 2018 to 2022 7.3. Current Market Size Value (US$ Million) Analysis and Forecast By Region, 2023 to 2033 7.3.1. North America 7.3.2. Latin America 7.3.3. Europe 7.3.4. Asia Pacific 7.3.5. Middle East & Africa (MEA) 7.4. Market Attractiveness Analysis By Region 8. North America Market Analysis 2018 to 2022 and Forecast 2023 to 2033, By Country 8.1. Historical Market Size Value (US$ Million) Trend Analysis By Market Taxonomy, 2018 to 2022 8.2. Market Size Value (US$ Million) Forecast By Market Taxonomy, 2023 to 2033 8.2.1. By Country 8.2.1.1. The US 8.2.1.2. Canada 8.2.2. By Therapies 8.2.3. By Application 8.3. Market Attractiveness Analysis 8.3.1. By Country 8.3.2. By Therapies 8.3.3. By Application 8.4. Key Takeaways 9. Latin America Market Analysis 2018 to 2022 and Forecast 2023 to 2033, By Country 9.1. Historical Market Size Value (US$ Million) Trend Analysis By Market Taxonomy, 2018 to 2022 9.2. Market Size Value (US$ Million) Forecast By Market Taxonomy, 2023 to 2033 9.2.1. By Country 9.2.1.1. Brazil 9.2.1.2. Mexico 9.2.1.3. Rest of Latin America 9.2.2. By Therapies 9.2.3. By Application 9.3. Market Attractiveness Analysis 9.3.1. By Country 9.3.2. By Therapies 9.3.3. By Application 9.4. Key Takeaways 10. Europe Market Analysis 2018 to 2022 and Forecast 2023 to 2033, By Country 10.1. Historical Market Size Value (US$ Million) Trend Analysis By Market Taxonomy, 2018 to 2022 10.2. Market Size Value (US$ Million) Forecast By Market Taxonomy, 2023 to 2033 10.2.1. By Country 10.2.1.1. Germany 10.2.1.2. The UK 10.2.1.3. France 10.2.1.4. Spain 10.2.1.5. Italy 10.2.1.6. Rest of Europe 10.2.2. By Therapies 10.2.3. By Application 10.3. Market Attractiveness Analysis 10.3.1. By Country 10.3.2. By Therapies 10.3.3. By Application 10.4. Key Takeaways 11. Asia Pacific Market Analysis 2018 to 2022 and Forecast 2023 to 2033, By Country 11.1. Historical Market Size Value (US$ Million) Trend Analysis By Market Taxonomy, 2018 to 2022 11.2. Market Size Value (US$ Million) Forecast By Market Taxonomy, 2023 to 2033 11.2.1. By Country 11.2.1.1. China 11.2.1.2. Japan 11.2.1.3. South Korea 11.2.1.4. Singapore 11.2.1.5. Thailand 11.2.1.6. Indonesia 11.2.1.7. Australia 11.2.1.8. New Zealand 11.2.1.9. Rest of Asia Pacific 11.2.2. By Therapies 11.2.3. By Application 11.3. Market Attractiveness Analysis 11.3.1. By Country 11.3.2. By Therapies 11.3.3. By Application 11.4. Key Takeaways 12. MEA Market Analysis 2018 to 2022 and Forecast 2023 to 2033, By Country 12.1. Historical Market Size Value (US$ Million) Trend Analysis By Market Taxonomy, 2018 to 2022 12.2. Market Size Value (US$ Million) Forecast By Market Taxonomy, 2023 to 2033 12.2.1. By Country 12.2.1.1. GCC Countries 12.2.1.2. South Africa 12.2.1.3. Israel 12.2.1.4. Rest of MEA 12.2.2. By Therapies 12.2.3. By Application 12.3. Market Attractiveness Analysis 12.3.1. By Country 12.3.2. By Therapies 12.3.3. By Application 12.4. Key Takeaways 13. Key Countries Market Analysis 13.1. The US 13.1.1. Pricing Analysis 13.1.2. Market Share Analysis, 2022 13.1.2.1. By Therapies 13.1.2.2. By Application 13.2. Canada 13.2.1. Pricing Analysis 13.2.2. Market Share Analysis, 2022 13.2.2.1. By Therapies 13.2.2.2. By Application 13.3. Brazil 13.3.1. Pricing Analysis 13.3.2. Market Share Analysis, 2022 13.3.2.1. By Therapies 13.3.2.2. By Application 13.4. Mexico 13.4.1. Pricing Analysis 13.4.2. Market Share Analysis, 2022 13.4.2.1. By Therapies 13.4.2.2. By Application 13.5. Germany 13.5.1. Pricing Analysis 13.5.2. Market Share Analysis, 2022 13.5.2.1. By Therapies 13.5.2.2. By Application 13.6. The UK 13.6.1. Pricing Analysis 13.6.2. Market Share Analysis, 2022 13.6.2.1. By Therapies 13.6.2.2. By Application 13.7. France 13.7.1. Pricing Analysis 13.7.2. Market Share Analysis, 2022 13.7.2.1. By Therapies 13.7.2.2. By Application 13.8. Spain 13.8.1. Pricing Analysis 13.8.2. Market Share Analysis, 2022 13.8.2.1. By Therapies 13.8.2.2. By Application 13.9. Italy 13.9.1. Pricing Analysis 13.9.2. Market Share Analysis, 2022 13.9.2.1. By Therapies 13.9.2.2. By Application 13.10. China 13.10.1. Pricing Analysis 13.10.2. Market Share Analysis, 2022 13.10.2.1. By Therapies 13.10.2.2. By Application 13.11. Japan 13.11.1. Pricing Analysis 13.11.2. Market Share Analysis, 2022 13.11.2.1. By Therapies 13.11.2.2. By Application 13.12. South Korea 13.12.1. Pricing Analysis 13.12.2. Market Share Analysis, 2022 13.12.2.1. By Therapies 13.12.2.2. By Application 13.13. Singapore 13.13.1. Pricing Analysis 13.13.2. Market Share Analysis, 2022 13.13.2.1. By Therapies 13.13.2.2. By Application 13.14. Thailand 13.14.1. Pricing Analysis 13.14.2. Market Share Analysis, 2022 13.14.2.1. By Therapies 13.14.2.2. By Application 13.15. Indonesia 13.15.1. Pricing Analysis 13.15.2. Market Share Analysis, 2022 13.15.2.1. By Therapies 13.15.2.2. By Application 13.16. Australia 13.16.1. Pricing Analysis 13.16.2. Market Share Analysis, 2022 13.16.2.1. By Therapies 13.16.2.2. By Application 13.17. New Zealand 13.17.1. Pricing Analysis 13.17.2. Market Share Analysis, 2022 13.17.2.1. By Therapies 13.17.2.2. By Application 13.18. GCC Countries 13.18.1. Pricing Analysis 13.18.2. Market Share Analysis, 2022 13.18.2.1. By Therapies 13.18.2.2. By Application 13.19. South Africa 13.19.1. Pricing Analysis 13.19.2. Market Share Analysis, 2022 13.19.2.1. By Therapies 13.19.2.2. By Application 13.20. Israel 13.20.1. Pricing Analysis 13.20.2. Market Share Analysis, 2022 13.20.2.1. By Therapies 13.20.2.2. By Application 14. Market Structure Analysis 14.1. Competition Dashboard 14.2. Competition Benchmarking 14.3. Market Share Analysis of Top Players 14.3.1. By Regional 14.3.2. By Therapies 14.3.3. By Application 15. Competition Analysis 15.1. Competition Deep Dive 15.1.1. American Regent 15.1.1.1. Overview 15.1.1.2. Product Portfolio 15.1.1.3. Profitability by Market Segments 15.1.1.4. Sales Footprint 15.1.1.5. Strategy Overview 15.1.1.5.1. Marketing Strategy 15.1.2. Dr Reddy's 15.1.2.1. Overview 15.1.2.2. Product Portfolio 15.1.2.3. Profitability by Market Segments 15.1.2.4. Sales Footprint 15.1.2.5. Strategy Overview 15.1.2.5.1. Marketing Strategy 15.1.3. Gland Pharma Limited 15.1.3.1. Overview 15.1.3.2. Product Portfolio 15.1.3.3. Profitability by Market Segments 15.1.3.4. Sales Footprint 15.1.3.5. Strategy Overview 15.1.3.5.1. Marketing Strategy 15.1.4. Sagent Pharma 15.1.4.1. Overview 15.1.4.2. Product Portfolio 15.1.4.3. Profitability by Market Segments 15.1.4.4. Sales Footprint 15.1.4.5. Strategy Overview 15.1.4.5.1. Marketing Strategy 15.1.5. Sun Pharma 15.1.5.1. Overview 15.1.5.2. Product Portfolio 15.1.5.3. Profitability by Market Segments 15.1.5.4. Sales Footprint 15.1.5.5. Strategy Overview 15.1.5.5.1. Marketing Strategy 15.1.6. Teva Pharmaceuticals 15.1.6.1. Overview 15.1.6.2. Product Portfolio 15.1.6.3. Profitability by Market Segments 15.1.6.4. Sales Footprint 15.1.6.5. Strategy Overview 15.1.6.5.1. Marketing Strategy 15.1.7. Ferring Pharmaceuticals 15.1.7.1. Overview 15.1.7.2. Product Portfolio 15.1.7.3. Profitability by Market Segments 15.1.7.4. Sales Footprint 15.1.7.5. Strategy Overview 15.1.7.5.1. Marketing Strategy 15.1.8. UbiPharm 15.1.8.1. Overview 15.1.8.2. Product Portfolio 15.1.8.3. Profitability by Market Segments 15.1.8.4. Sales Footprint 15.1.8.5. Strategy Overview 15.1.8.5.1. Marketing Strategy 15.1.9. Allergan PLC 15.1.9.1. Overview 15.1.9.2. Product Portfolio 15.1.9.3. Profitability by Market Segments 15.1.9.4. Sales Footprint 15.1.9.5. Strategy Overview 15.1.9.5.1. Marketing Strategy 15.1.10. Glenmark Pharmaceuticals 15.1.10.1. Overview 15.1.10.2. Product Portfolio 15.1.10.3. Profitability by Market Segments 15.1.10.4. Sales Footprint 15.1.10.5. Strategy Overview 15.1.10.5.1. Marketing Strategy 16. Assumptions & Acronyms Used 17. Research Methodology
Don't pay for what you don't need
Customize your report by selecting specific countries or regions and save 30%!
List of Tables
Table 1: Global Market Value (US$ Million) Forecast by Region, 2018 to 2033 Table 2: Global Market Value (US$ Million) Forecast by Therapies, 2018 to 2033 Table 3: Global Market Value (US$ Million) Forecast by Application, 2018 to 2033 Table 4: North America Market Value (US$ Million) Forecast by Country, 2018 to 2033 Table 5: North America Market Value (US$ Million) Forecast by Therapies, 2018 to 2033 Table 6: North America Market Value (US$ Million) Forecast by Application, 2018 to 2033 Table 7: Latin America Market Value (US$ Million) Forecast by Country, 2018 to 2033 Table 8: Latin America Market Value (US$ Million) Forecast by Therapies, 2018 to 2033 Table 9: Latin America Market Value (US$ Million) Forecast by Application, 2018 to 2033 Table 10: Europe Market Value (US$ Million) Forecast by Country, 2018 to 2033 Table 11: Europe Market Value (US$ Million) Forecast by Therapies, 2018 to 2033 Table 12: Europe Market Value (US$ Million) Forecast by Application, 2018 to 2033 Table 13: Asia Pacific Market Value (US$ Million) Forecast by Country, 2018 to 2033 Table 14: Asia Pacific Market Value (US$ Million) Forecast by Therapies, 2018 to 2033 Table 15: Asia Pacific Market Value (US$ Million) Forecast by Application, 2018 to 2033 Table 16: MEA Market Value (US$ Million) Forecast by Country, 2018 to 2033 Table 17: MEA Market Value (US$ Million) Forecast by Therapies, 2018 to 2033 Table 18: MEA Market Value (US$ Million) Forecast by Application, 2018 to 2033
Find your sweet spots for generating winning opportunities in this market.
Talk to AnalystList of Charts
Figure 1: Global Market Value (US$ Million) by Therapies, 2023 to 2033 Figure 2: Global Market Value (US$ Million) by Application, 2023 to 2033 Figure 3: Global Market Value (US$ Million) by Region, 2023 to 2033 Figure 4: Global Market Value (US$ Million) Analysis by Region, 2018 to 2033 Figure 5: Global Market Value Share (%) and BPS Analysis by Region, 2023 to 2033 Figure 6: Global Market Y-o-Y Growth (%) Projections by Region, 2023 to 2033 Figure 7: Global Market Value (US$ Million) Analysis by Therapies, 2018 to 2033 Figure 8: Global Market Value Share (%) and BPS Analysis by Therapies, 2023 to 2033 Figure 9: Global Market Y-o-Y Growth (%) Projections by Therapies, 2023 to 2033 Figure 10: Global Market Value (US$ Million) Analysis by Application, 2018 to 2033 Figure 11: Global Market Value Share (%) and BPS Analysis by Application, 2023 to 2033 Figure 12: Global Market Y-o-Y Growth (%) Projections by Application, 2023 to 2033 Figure 13: Global Market Attractiveness by Therapies, 2023 to 2033 Figure 14: Global Market Attractiveness by Application, 2023 to 2033 Figure 15: Global Market Attractiveness by Region, 2023 to 2033 Figure 16: North America Market Value (US$ Million) by Therapies, 2023 to 2033 Figure 17: North America Market Value (US$ Million) by Application, 2023 to 2033 Figure 18: North America Market Value (US$ Million) by Country, 2023 to 2033 Figure 19: North America Market Value (US$ Million) Analysis by Country, 2018 to 2033 Figure 20: North America Market Value Share (%) and BPS Analysis by Country, 2023 to 2033 Figure 21: North America Market Y-o-Y Growth (%) Projections by Country, 2023 to 2033 Figure 22: North America Market Value (US$ Million) Analysis by Therapies, 2018 to 2033 Figure 23: North America Market Value Share (%) and BPS Analysis by Therapies, 2023 to 2033 Figure 24: North America Market Y-o-Y Growth (%) Projections by Therapies, 2023 to 2033 Figure 25: North America Market Value (US$ Million) Analysis by Application, 2018 to 2033 Figure 26: North America Market Value Share (%) and BPS Analysis by Application, 2023 to 2033 Figure 27: North America Market Y-o-Y Growth (%) Projections by Application, 2023 to 2033 Figure 28: North America Market Attractiveness by Therapies, 2023 to 2033 Figure 29: North America Market Attractiveness by Application, 2023 to 2033 Figure 30: North America Market Attractiveness by Country, 2023 to 2033 Figure 31: Latin America Market Value (US$ Million) by Therapies, 2023 to 2033 Figure 32: Latin America Market Value (US$ Million) by Application, 2023 to 2033 Figure 33: Latin America Market Value (US$ Million) by Country, 2023 to 2033 Figure 34: Latin America Market Value (US$ Million) Analysis by Country, 2018 to 2033 Figure 35: Latin America Market Value Share (%) and BPS Analysis by Country, 2023 to 2033 Figure 36: Latin America Market Y-o-Y Growth (%) Projections by Country, 2023 to 2033 Figure 37: Latin America Market Value (US$ Million) Analysis by Therapies, 2018 to 2033 Figure 38: Latin America Market Value Share (%) and BPS Analysis by Therapies, 2023 to 2033 Figure 39: Latin America Market Y-o-Y Growth (%) Projections by Therapies, 2023 to 2033 Figure 40: Latin America Market Value (US$ Million) Analysis by Application, 2018 to 2033 Figure 41: Latin America Market Value Share (%) and BPS Analysis by Application, 2023 to 2033 Figure 42: Latin America Market Y-o-Y Growth (%) Projections by Application, 2023 to 2033 Figure 43: Latin America Market Attractiveness by Therapies, 2023 to 2033 Figure 44: Latin America Market Attractiveness by Application, 2023 to 2033 Figure 45: Latin America Market Attractiveness by Country, 2023 to 2033 Figure 46: Europe Market Value (US$ Million) by Therapies, 2023 to 2033 Figure 47: Europe Market Value (US$ Million) by Application, 2023 to 2033 Figure 48: Europe Market Value (US$ Million) by Country, 2023 to 2033 Figure 49: Europe Market Value (US$ Million) Analysis by Country, 2018 to 2033 Figure 50: Europe Market Value Share (%) and BPS Analysis by Country, 2023 to 2033 Figure 51: Europe Market Y-o-Y Growth (%) Projections by Country, 2023 to 2033 Figure 52: Europe Market Value (US$ Million) Analysis by Therapies, 2018 to 2033 Figure 53: Europe Market Value Share (%) and BPS Analysis by Therapies, 2023 to 2033 Figure 54: Europe Market Y-o-Y Growth (%) Projections by Therapies, 2023 to 2033 Figure 55: Europe Market Value (US$ Million) Analysis by Application, 2018 to 2033 Figure 56: Europe Market Value Share (%) and BPS Analysis by Application, 2023 to 2033 Figure 57: Europe Market Y-o-Y Growth (%) Projections by Application, 2023 to 2033 Figure 58: Europe Market Attractiveness by Therapies, 2023 to 2033 Figure 59: Europe Market Attractiveness by Application, 2023 to 2033 Figure 60: Europe Market Attractiveness by Country, 2023 to 2033 Figure 61: Asia Pacific Market Value (US$ Million) by Therapies, 2023 to 2033 Figure 62: Asia Pacific Market Value (US$ Million) by Application, 2023 to 2033 Figure 63: Asia Pacific Market Value (US$ Million) by Country, 2023 to 2033 Figure 64: Asia Pacific Market Value (US$ Million) Analysis by Country, 2018 to 2033 Figure 65: Asia Pacific Market Value Share (%) and BPS Analysis by Country, 2023 to 2033 Figure 66: Asia Pacific Market Y-o-Y Growth (%) Projections by Country, 2023 to 2033 Figure 67: Asia Pacific Market Value (US$ Million) Analysis by Therapies, 2018 to 2033 Figure 68: Asia Pacific Market Value Share (%) and BPS Analysis by Therapies, 2023 to 2033 Figure 69: Asia Pacific Market Y-o-Y Growth (%) Projections by Therapies, 2023 to 2033 Figure 70: Asia Pacific Market Value (US$ Million) Analysis by Application, 2018 to 2033 Figure 71: Asia Pacific Market Value Share (%) and BPS Analysis by Application, 2023 to 2033 Figure 72: Asia Pacific Market Y-o-Y Growth (%) Projections by Application, 2023 to 2033 Figure 73: Asia Pacific Market Attractiveness by Therapies, 2023 to 2033 Figure 74: Asia Pacific Market Attractiveness by Application, 2023 to 2033 Figure 75: Asia Pacific Market Attractiveness by Country, 2023 to 2033 Figure 76: MEA Market Value (US$ Million) by Therapies, 2023 to 2033 Figure 77: MEA Market Value (US$ Million) by Application, 2023 to 2033 Figure 78: MEA Market Value (US$ Million) by Country, 2023 to 2033 Figure 79: MEA Market Value (US$ Million) Analysis by Country, 2018 to 2033 Figure 80: MEA Market Value Share (%) and BPS Analysis by Country, 2023 to 2033 Figure 81: MEA Market Y-o-Y Growth (%) Projections by Country, 2023 to 2033 Figure 82: MEA Market Value (US$ Million) Analysis by Therapies, 2018 to 2033 Figure 83: MEA Market Value Share (%) and BPS Analysis by Therapies, 2023 to 2033 Figure 84: MEA Market Y-o-Y Growth (%) Projections by Therapies, 2023 to 2033 Figure 85: MEA Market Value (US$ Million) Analysis by Application, 2018 to 2033 Figure 86: MEA Market Value Share (%) and BPS Analysis by Application, 2023 to 2033 Figure 87: MEA Market Y-o-Y Growth (%) Projections by Application, 2023 to 2033 Figure 88: MEA Market Attractiveness by Therapies, 2023 to 2033 Figure 89: MEA Market Attractiveness by Application, 2023 to 2033 Figure 90: MEA Market Attractiveness by Country, 2023 to 2033
Recommendations
Explore Healthcare Insights
View Reports