High Barrier Lidding Film Market Forecast and Outlook 2025 to 2035

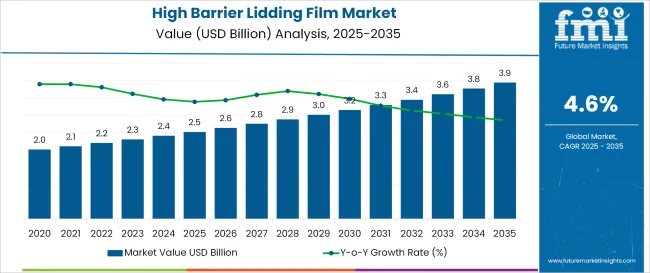
The global high barrier lidding film market is valued at USD 2.5 billion in 2025 and is expected to reach USD 3.9 billion by 2035, registering a CAGR of 4.6%. Market expansion is driven by rising consumer demand for extended shelf-life products, increasing adoption of sustainable packaging solutions, and growth in convenience food consumption.
Quick Stats for High Barrier Lidding Film Market

  • Value of Market (2025): USD 2.5 billion
  • Projected Value of Market (2035): USD 3.9 billion
  • Forecast CAGR of Market (2025 to 2035): 4.6%
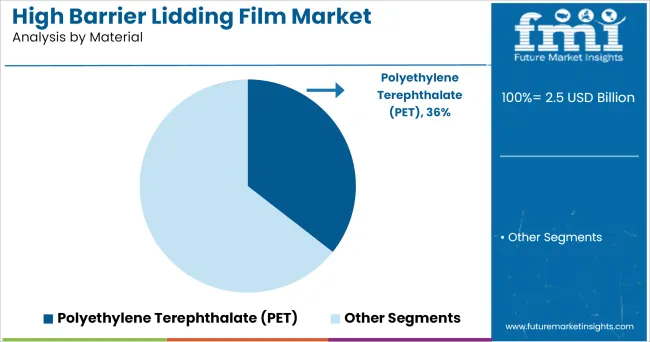
  • Leading Segment by Material Used of Market (2025): PET (36% Market Share)
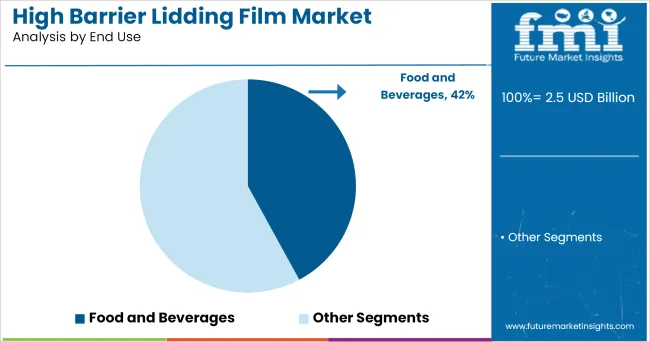
  • Leading Segment by Application in Market (2025): Food & beverages (42% Market Share)
  • Fastest Growing Country in Market (2025): China is the fastest-growing market with 13.9% CAGR)
  • Top Key Players in Market: Winpak Ltd., Bischof & Klein SE & Co., DuPont Teijin Films USA Limited Partnership, Golden Eagle Extrusions Inc., Toray Plastics (America) Inc.

High Barrier Lidding Film Market Market Value Analysis

Metric Value
Estimated Size (2025E) USD 2.5 billion
Projected Value (2035F) USD 3.9 billion
CAGR (2025 to 2035) 4.6%

Technological innovations in multi-layer film structures and enhanced barrier capabilities against oxygen and moisture are also major contributing factors. The high barrier lidding film market accounts for approximately 4.5% of the overall flexible packaging industry, supported by growth in ready-to-eat meals and single-serve product formats.

In dairy packaging, it contributes around 7.1%, reflecting its widespread usage in yogurt cups, cheese trays, and cream tubs. Within the pharmaceutical packaging sector, it comprises about 3.2%, spurred by its increasing use in medical device packaging and sterile barrier applications.

In fresh produce packaging, high barrier lidding films command nearly 6% of the market, reflecting their essential role in extending shelf life and maintaining product freshness. In frozen food packaging and convenience meal markets, barrier films constitute around 5.5% to 6.2%, highlighting their function as protective barriers against moisture and oxygen in temperature-sensitive applications.

Government regulations impacting the market focus on regulatory efforts to minimize plastic waste and encourage recyclable barrier films, which have influenced product development trends. Recent innovations include biodegradable barrier coatings, laser perforation for breathability, and peelable seal films with enhanced recyclability.

Government-supported initiatives across Europe and North America promoting circular economy packaging strategies are also expected to spur market growth. Continuous advancements in packaging technology and sustainable materials will further unlock value across the high barrier lidding film supply chain. Additionally, strategic collaborations between film manufacturers and end-use industries are likely to accelerate customized product development and market penetration.

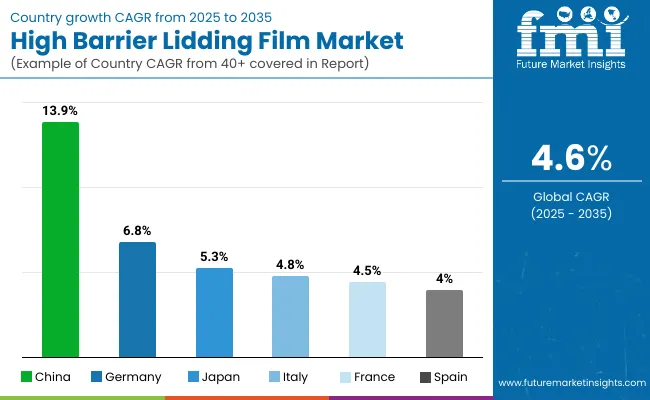
China is projected to be the fastest-growing market, expanding at a CAGR of 13.9% from 2025 to 2035. PET will lead the material segment with a 36% share, while Food packaging will dominate the application segment with a 42% market share in 2025. Germany and Japan will also see steady growth at CAGRs of 5.3% and 4.9%, respectively.

High Barrier Lidding Film Market Analysis by Top Investment Segments

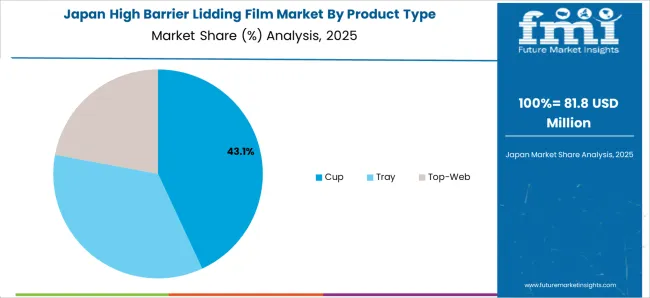
The high barrier lidding film market is segmented by material, application, and region. By material used, the market includes PET, polyethylene (PE), polypropylene (PP), and PVC. By product type, the market includes cup, tray, and top-web.

Based on application, the market is categorized into food & beverages, pharmaceuticals, cosmetics, and consumer goods. Regionally, the market is classified into North America, Latin America, Western Europe, Balkans & Baltic, Russia & Belarus, Central Asia, East Asia, South Asia & Pacific, Middle East & Africa.
Food & Beverages to Lead the End-Use Segment with 42% Market Share

High Barrier Lidding Film Market Analysis By End Use

Food & beverages are projected to dominate the end-use segment, accounting for 42% of the global high barrier lidding film market share. Their critical role in extending shelf life, maintaining product freshness, and providing superior barrier protection against oxygen, moisture, and contaminants establishes them as the primary driver for manufacturers.

The versatility of high barrier lidding films supports their widespread use in ready-to-eat meals, dairy products, processed meats, snacks, and beverage packaging, making them the preferred solution for maintaining food quality and safety.
  • High barrier lidding films are extensively used in food packaging due to their excellent oxygen and moisture barrier properties
  • As consumer demand for convenience foods grows, these films provide essential protection for extended shelf life
  • The shift toward sustainable packaging is driving innovation in barrier film technology without compromising performance
  • These films offer cost-effective solutions for brand protection and product integrity across diverse food categories

Polyethylene Terephthalate (PET) to Lead the Material Segment with 36% Market Share

High Barrier Lidding Film Market Analysis By Material

Polyethylene Terephthalate (PET) is projected to dominate the material segment, accounting for 36% of the global market share. Its superior clarity, excellent barrier properties, and chemical resistance make it the preferred material across food, pharmaceutical, and consumer goods applications. Manufacturers value PET's ability to maintain product visibility while providing robust protection against environmental factors without compromising package integrity.

  • PET allows manufacturers to achieve optimal barrier performance while maintaining package transparency
  • Its ability to withstand various processing conditions ensures consistency in high-speed packaging operations
  • PET's recyclability and sustainability profile make it well-suited for environmentally conscious packaging solutions
  • It is a preferred component in multi-layer film structures, offering versatility and functional reliability for manufacturers

Top High Barrier Lidding Film Market Dynamics

The global high barrier lidding film market has been experiencing steady growth, driven by increasing demand for extended shelf life, food safety, and sustainable packaging solutions. As consumers prioritize convenience and freshness, these films are becoming essential in ready-to-eat meals, dairy products, and pharmaceutical packaging.

Their superior moisture, oxygen, and contamination barrier properties align with evolving industry needs for hygiene, product integrity, and regulatory compliance. Additionally, the push toward recyclable and mono-material barrier films is driving innovation, as manufacturers respond to environmental concerns and circular economy goals.
Recent Trends in the Market

  • Manufacturers are shifting toward eco-friendly materials to reduce plastic waste and align with global sustainability goals.
  • Consumer preference for convenience is driving the integration of laser-scored technology and resealable features.
  • The healthcare sector is increasingly adopting high barrier High Barrier Lidding Films for sterile packaging of sensitive medical instruments. .
  • Advancements in digital printing enable brands to produce high-quality, customized packaging with low minimum order quantities.

Key Challenges in the Market

  • Regulatory restrictions on multilayer plastics pose challenges for recyclability and compliance in flexible packaging.
  • Elevated costs of aluminum films impact overall production expenses, especially for high-barrier applications.
  • Ensuring effective seal integrity across diverse tray materials and shapes adds to manufacturing complexity.
  • Low public understanding of recyclable lidding film options hinders proper disposal and circular use.

Top Countries Producing, Using and Supplying High Barrier Lidding Film

High Barrier Lidding Film Market Country Wise Analysis

China leads the high barrier lidding film market due to rising demand for packaged foods, frozen meals, and pharmaceutical packaging solutions. Innovation in peel-and-reseal films and investments in sustainable materials are key growth drivers. Germany and Japan are also major contributors, benefiting from strong food processing and healthcare industries.

France and China are emerging as manufacturing hubs, supported by technological upgrades in film extrusion, lamination, and eco-friendly coatings. The Asia Pacific region is seeing rapid adoption across urban centers due to the rise of organized retail and growing middle-class demand for convenience food products.

The report covers an in-depth analysis of 40+ countries; with the five top-performing OECD nations highlighted below. 

In-Depth Analysis of High Barrier Lidding in China with 13.9% CAGR

The China high barrier lidding film market is projected to grow at a CAGR of 13.9% from 2025 to 2035. Growth is driven by rapid industrialization, expanding food processing capabilities, and increasing consumer demand for packaged goods. China's massive manufacturing base and growing middle class are creating unprecedented demand for high-quality packaging solutions across multiple industries.

  • Rapid expansion of food processing and e-commerce sectors driving packaging demand
  • Strong government support for advanced manufacturing and packaging technologies
  • Increasing adoption of international food safety and packaging standards

Growth Outlook of High Barrier Lidding Films in Italy

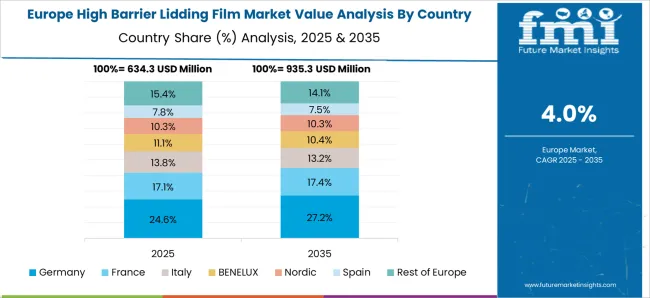
The Italy high barrier lidding film market is growing at a CAGR of 5.3% from 2025 to 2035. Growth is driven by the country's strong food and beverage industry, particularly in premium and artisanal products. Italy's established pharmaceutical and cosmetics sectors also significantly contribute to demand, with barrier films used in luxury packaging and medical applications.
  • Growing preference for premium food packaging in Italian culinary products
  • Strong demand from pharmaceutical and cosmetic packaging sectors
  • Increasing usage of barrier films in wine and specialty food export markets

Demand Trajectory for High Barrier Lidding Films in Germany

The demand for high barrier lidding films in Germany is projected to grow at a CAGR of 6.8% from 2025 to 2035. Growth is driven by increasing use of barrier films in German food processing, automotive, and pharmaceutical packaging applications. As one of the leading markets in Europe, Germany benefits from a mature packaging industry and stringent quality standards. The country's pharmaceutical and medical device industries also leverage barrier films in specialized packaging requirements.

  • Wide application in food processing and pharmaceutical packaging
  • Strong industrial base in automotive and electronics packaging
  • Stable supply chain relationships with European film manufacturers

Analysis of High Barrier Lidding Films in France

The France high barrier lidding film market is projected to grow at a CAGR of 4.8% from 2025 to 2035. Growth is driven by thriving food and beverage sectors, where barrier films are extensively used for gourmet and artisanal products. France has also embraced barrier films in cosmetics packaging, luxury goods, and organic food products. Regulatory alignment with sustainable packaging and recyclability trends has boosted barrier film adoption.
  • High usage of barrier films in premium food and cosmetic packaging
  • Increasing adoption of sustainable barrier solutions in luxury goods
  • Expanding applications in organic and natural product packaging

High Barrier Lidding Film Market in Japan

The Japan high barrier lidding film market is expected to grow at a CAGR of 4.5% from 2025 to 2035. Growth in the Japan market is supported by strong technological innovation, traditional precision in packaging, and continued applications in electronics and semiconductor industries.

The country has a long-standing tradition of advanced packaging technology, with barrier films used in food, electronics, and industrial applications. Japan's advanced manufacturing sector continues to utilize barrier films in precision packaging and contamination-sensitive applications.

  • Historic expertise and technological leadership in barrier film manufacturing
  • Domestic production of high-performance films for premium applications
  • Increasing demand in the electronics, automotive, and precision manufacturing sectors

High Barrier Lidding Film Trends in Spain

The Spain high barrier lidding film market is expected to grow at a CAGR of 4.0% from 2025 to 2035. Growth in the Spanish market is supported by expanding food processing industries, tourism-driven hospitality sector, and growing export markets for Spanish agricultural products. The country's olive oil, wine, and processed food industries rely heavily on barrier films for product protection and shelf life extension.
  • Strong application in olive oil and wine packaging for export markets
  • Growing demand from tourism and hospitality food service sectors
  • Increasing usage in processed meat and dairy product packaging

High Barrier Lidding Films Suppliers

High Barrier Lidding Film Market Analysis By Company

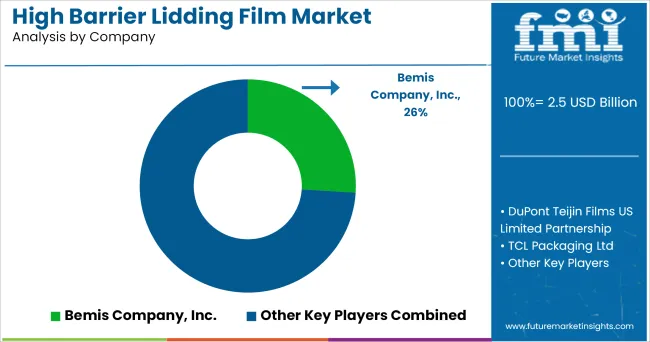
The high barrier lidding film market is moderately consolidated with major players focusing on sustainable material innovations and strategic expansions. Companies like Winpak Ltd., Bischof & Klein SE & Co., DuPont Teijin Films USA Limited Partnership, Golden Eagle Extrusions Inc., Toray Plastics (America) Inc., Multi-Pastics Inc., Clifton Packaging Group Ltd., Bemis Company Inc., and TCL Packaging Ltd., dominate the industry through R&D, supply chain integration, and partnership with food and pharma brands.

Top companies in the high barrier High Barrier Lidding Films market are actively focusing on material innovation, regional expansion, and sustainability-driven product development to meet rising demand across food, pharmaceutical, and cosmetic applications. Key players such as Amcor, Bemis (now part of Amcor), Sealed Air, and Mondi are enhancing their portfolios with recyclable, mono-material, and resealable solutions.

Strategic collaborations with food manufacturers and pharmaceutical packaging firms are also being prioritized to develop tailored barrier film solutions. Regulatory compliance, extended shelf life performance, and compatibility with a wide range of sealing technologies continue to be critical areas of competitive advantage within the industry.

Recent High Barrier Lidding Film Market News

  • In November 2024, Amcor announced its acquisition of Berry Global in an USD 8.4 billion deal to create a global plastics and healthcare packaging giant. This acquisition strengthens Amcor's position in the flexible packaging business, which includes high barrier lidding films for food and pharmaceutical applications, key sectors driving demand for advanced packaging solutions.

High Barrier Lidding Film Market Report Scope

Report Attributes Details
Current Total Market Size (2025) USD 2.5 billion
Projected Market Size (2035) USD 3.9 billion
CAGR (2025 to 2035) 4.6%
Base Year for Estimation 2024
Historical Period 2020 to 2024
Projections Period 2025 to 2035
Market Analysis Parameters Revenue in USD billions / Volume in kilo tons
By Product Type Cup, Tray, Top-Web
By Material Used PET, PE, PP, and PVC
By Application Food & Beverages, Pharmaceuticals, Cosmetics, and Consumer Goods
Regions Covered North America, Latin America, Western Europe, Balkans & Baltic, Russia & Belarus, Central Asia, East Asia, South Asia & Pacific, Middle East & Africa
Countries Covered United States, Canada, United Kingdom, Germany, France, China, Japan, South Korea, Brazil, Australia and 40+ countries
Key Players Winpak Ltd., Bischof & Klein SE & Co., DuPont Teijin Films USA Limited Partnership, Golden Eagle Extrusions Inc., Toray Plastics (America) Inc., Multi-Pastics Inc., Clifton Packaging Group Ltd., Bemis Company Inc., and TCL Packaging Ltd.
Additional Attributes Dollar sales by product type, share by functionality, regional demand growth, regulatory influence, clean-label trends, competitive benchmarking 

Key Segments

By Product Type:

  • Cup
  • Tray
  • Top-Web

By Material:

  • Polyethylene (PE)
  • Polypropylene (PP)
  • Polyethylene Terephthalate (PET)
  • Polyvinyl Chloride (PVC)

By End Use:

  • Food and Beverages
  • Pharmaceuticals
  • Cosmetics
  • Consumer Goods

By Region:

  • North America
  • Latin America
  • Europe
  • Asia Pacific
  • The Middle East and Africa

Table of Content

  1. Executive Summary
    • Global Market Outlook
    • Demand-side Trends
    • Supply-side Trends
    • Technology Roadmap Analysis
    • Analysis and Recommendations
  2. Market Overview
    • Market Coverage / Taxonomy
    • Market Definition / Scope / Limitations
  3. Market Background
    • Market Dynamics
      • Drivers
      • Restraints
      • Opportunity
      • Trends
    • Scenario Forecast
      • Demand in Optimistic Scenario
      • Demand in Likely Scenario
      • Demand in Conservative Scenario
    • Opportunity Map Analysis
    • Product Life Cycle Analysis
    • Supply Chain Analysis
      • Supply Side Participants and their Roles
        • Producers
        • Mid-Level Participants (Traders/ Agents/ Brokers)
        • Wholesalers and Distributors
      • Value Added and Value Created at Node in the Supply Chain
      • List of Raw Material Suppliers
      • List of Existing and Potential Buyer’s
    • Investment Feasibility Matrix
    • Value Chain Analysis
      • Profit Margin Analysis
      • Wholesalers and Distributors
      • Retailers
    • PESTLE and Porter’s Analysis
    • Regulatory Landscape
      • By Key Regions
      • By Key Countries
    • Regional Parent Market Outlook
    • Production and Consumption Statistics
    • Import and Export Statistics
  4. Global Market Analysis 2020 to 2024 and Forecast, 2025 to 2035
    • Historical Market Size Value (USD Billion) & Volume (Tons) Analysis, 2020 to 2024
    • Current and Future Market Size Value (USD Billion) & Volume (Tons) Projections, 2025 to 2035
      • Y-o-Y Growth Trend Analysis
      • Absolute $ Opportunity Analysis
  5. Global Market Pricing Analysis 2020 to 2024 and Forecast 2025 to 2035
  6. Global Market Analysis 2020 to 2024 and Forecast 2025 to 2035, By Product Type
    • Introduction / Key Findings
    • Historical Market Size Value (USD Billion) & Volume (Tons) Analysis By Product Type, 2020 to 2024
    • Current and Future Market Size Value (USD Billion) & Volume (Tons) Analysis and Forecast By Product Type, 2025 to 2035
      • Cup
      • Tray
      • Top-Web
    • Y-o-Y Growth Trend Analysis By Product Type, 2020 to 2024
    • Absolute $ Opportunity Analysis By Product Type, 2025 to 2035
  7. Global Market Analysis 2020 to 2024 and Forecast 2025 to 2035, By Material Used
    • Introduction / Key Findings
    • Historical Market Size Value (USD Billion) & Volume (Tons) Analysis By Material Used, 2020 to 2024
    • Current and Future Market Size Value (USD Billion) & Volume (Tons) Analysis and Forecast By Material Used, 2025 to 2035
      • Polyethylene (PE)
      • Polypropylene (PP)
      • Polyethylene Terephthalate (PET)
      • Polyvinyl Chloride (PVC)
    • Y-o-Y Growth Trend Analysis By Material Used, 2020 to 2024
    • Absolute $ Opportunity Analysis By Material Used, 2025 to 2035
  8. Global Market Analysis 2020 to 2024 and Forecast 2025 to 2035, By Application
    • Introduction / Key Findings
    • Historical Market Size Value (USD Billion) & Volume (Tons) Analysis By Application, 2020 to 2024
    • Current and Future Market Size Value (USD Billion) & Volume (Tons) Analysis and Forecast By Application, 2025 to 2035
      • Food and Beverages
      • Pharmaceuticals
      • Cosmetics
      • Consumer Goods
    • Y-o-Y Growth Trend Analysis By Application, 2020 to 2024
    • Absolute $ Opportunity Analysis By Application, 2025 to 2035
  9. Global Market Analysis 2020 to 2024 and Forecast 2025 to 2035, By Region
    • Introduction
    • Historical Market Size Value (USD Billion) & Volume (Tons) Analysis By Region, 2020 to 2024
    • Current Market Size Value (USD Billion) & Volume (Tons) Analysis and Forecast By Region, 2025 to 2035
      • North America
      • Latin America
      • Western Europe
      • Eastern Europe
      • East Asia
      • South Asia & Pacific
      • Middle East and Africa
    • Market Attractiveness Analysis By Region
  10. North America Market Analysis 2020 to 2024 and Forecast 2025 to 2035, By Country
    • Historical Market Size Value (USD Billion) & Volume (Tons) Trend Analysis By Market Taxonomy, 2020 to 2024
    • Market Size Value (USD Billion) & Volume (Tons) Forecast By Market Taxonomy, 2025 to 2035
      • By Country
        • USA
        • Canada
        • Mexico
      • By Product Type
      • By Material Used
      • By Application
    • Market Attractiveness Analysis
      • By Country
      • By Product Type
      • By Material Used
      • By Application
    • Key Takeaways
  11. Latin America Market Analysis 2020 to 2024 and Forecast 2025 to 2035, By Country
    • Historical Market Size Value (USD Billion) & Volume (Tons) Trend Analysis By Market Taxonomy, 2020 to 2024
    • Market Size Value (USD Billion) & Volume (Tons) Forecast By Market Taxonomy, 2025 to 2035
      • By Country
        • Brazil
        • Argentina
        • Rest of LATAM
      • By Product Type
      • By Material Used
      • By Application
    • Market Attractiveness Analysis
      • By Country
      • By Product Type
      • By Material Used
      • By Application
    • Key Takeaways
  12. Western Europe Market Analysis 2020 to 2024 and Forecast 2025 to 2035, By Country
    • Historical Market Size Value (USD Billion) & Volume (Tons) Trend Analysis By Market Taxonomy, 2020 to 2024
    • Market Size Value (USD Billion) & Volume (Tons) Forecast By Market Taxonomy, 2025 to 2035
      • By Country
        • Germany
        • Italy
        • France
        • UK
        • Spain
        • BENELUX
        • Nordic
        • Rest of W.Europe
      • By Product Type
      • By Material Used
      • By Application
    • Market Attractiveness Analysis
      • By Country
      • By Product Type
      • By Material Used
      • By Application
    • Key Takeaways
  13. Eastern Europe Market Analysis 2020 to 2024 and Forecast 2025 to 2035, By Country
    • Historical Market Size Value (USD Billion) & Volume (Tons) Trend Analysis By Market Taxonomy, 2020 to 2024
    • Market Size Value (USD Billion) & Volume (Tons) Forecast By Market Taxonomy, 2025 to 2035
      • By Country
        • Russia
        • Hungary
        • Poland
        • Balkan & Baltics
        • Rest of E. Europe
      • By Product Type
      • By Material Used
      • By Application
    • Market Attractiveness Analysis
      • By Country
      • By Product Type
      • By Material Used
      • By Application
    • Key Takeaways
  14. East Asia Market Analysis 2020 to 2024 and Forecast 2025 to 2035, By Country
    • Historical Market Size Value (USD Billion) & Volume (Tons) Trend Analysis By Market Taxonomy, 2020 to 2024
    • Market Size Value (USD Billion) & Volume (Tons) Forecast By Market Taxonomy, 2025 to 2035
      • By Country
        • China
        • Japan
        • South Korea
      • By Product Type
      • By Material Used
      • By Application
    • Market Attractiveness Analysis
      • By Country
      • By Product Type
      • By Material Used
      • By Application
    • Key Takeaways
  15. South Asia & Pacific Market Analysis 2020 to 2024 and Forecast 2025 to 2035, By Country
    • Historical Market Size Value (USD Billion) & Volume (Tons) Trend Analysis By Market Taxonomy, 2020 to 2024
    • Market Size Value (USD Billion) & Volume (Tons) Forecast By Market Taxonomy, 2025 to 2035
      • By Country
        • India
        • Australia & New Zealand
        • ASEAN
        • Rest of SAP
      • By Product Type
      • By Material Used
      • By Application
    • Market Attractiveness Analysis
      • By Country
      • By Product Type
      • By Material Used
      • By Application
    • Key Takeaways
  16. Middle East and Africa Market Analysis 2020 to 2024 and Forecast 2025 to 2035, By Country
    • Historical Market Size Value (USD Billion) & Volume (Tons) Trend Analysis By Market Taxonomy, 2020 to 2024
    • Market Size Value (USD Billion) & Volume (Tons) Forecast By Market Taxonomy, 2025 to 2035
      • By Country
        • GCC Countries
        • Northern Africa
        • South Africa
        • Turkiye
        • Rest of MEA
      • By Product Type
      • By Material Used
      • By Application
    • Market Attractiveness Analysis
      • By Country
      • By Product Type
      • By Material Used
      • By Application
    • Key Takeaways
  17. Key Countries Market Analysis
    • USA
      • Pricing Analysis
      • Market Share Analysis, 2024
        • By Product Type
        • By Material Used
        • By Application
    • Canada
      • Pricing Analysis
      • Market Share Analysis, 2024
        • By Product Type
        • By Material Used
        • By Application
    • Brazil
      • Pricing Analysis
      • Market Share Analysis, 2024
        • By Product Type
        • By Material Used
        • By Application
    • Mexico
      • Pricing Analysis
      • Market Share Analysis, 2024
        • By Product Type
        • By Material Used
        • By Application
    • Argentina
      • Pricing Analysis
      • Market Share Analysis, 2024
        • By Product Type
        • By Material Used
        • By Application
  18. Market Structure Analysis
    • Competition Dashboard
    • Competition Benchmarking
    • Market Share Analysis of Top Players
      • By Regional
      • By Product Type
      • By Material Used
      • By Application
  19. Competition Analysis
    • Competition Deep Dive
      • Bemis Company, Inc.
        • Overview
        • Product Portfolio
        • Profitability by Market Segments (Product/Age /Sales Channel/Region)
        • Sales Footprint
        • Strategy Overview
          • Marketing Strategy
          • Product Strategy
          • Channel Strategy
      • DuPont Teijin Films USA Limited Partnership
        • Overview
        • Product Portfolio
        • Profitability by Market Segments (Product/Age /Sales Channel/Region)
        • Sales Footprint
        • Strategy Overview
          • Marketing Strategy
          • Product Strategy
          • Channel Strategy
      • TCL Packaging Ltd
        • Overview
        • Product Portfolio
        • Profitability by Market Segments (Product/Age /Sales Channel/Region)
        • Sales Footprint
        • Strategy Overview
          • Marketing Strategy
          • Product Strategy
          • Channel Strategy
      • Golden Eagle Extrusions, Inc.
        • Overview
        • Product Portfolio
        • Profitability by Market Segments (Product/Age /Sales Channel/Region)
        • Sales Footprint
        • Strategy Overview
          • Marketing Strategy
          • Product Strategy
          • Channel Strategy
      • Sealed Air Corporation
        • Overview
        • Product Portfolio
        • Profitability by Market Segments (Product/Age /Sales Channel/Region)
        • Sales Footprint
        • Strategy Overview
          • Marketing Strategy
          • Product Strategy
          • Channel Strategy
      • Toray Plastics (America), Inc.
        • Overview
        • Product Portfolio
        • Profitability by Market Segments (Product/Age /Sales Channel/Region)
        • Sales Footprint
        • Strategy Overview
          • Marketing Strategy
          • Product Strategy
          • Channel Strategy
      • Schur Flexibles Holding GesmbH
        • Overview
        • Product Portfolio
        • Profitability by Market Segments (Product/Age /Sales Channel/Region)
        • Sales Footprint
        • Strategy Overview
          • Marketing Strategy
          • Product Strategy
          • Channel Strategy
      • Multi-Pastics, Inc.
        • Overview
        • Product Portfolio
        • Profitability by Market Segments (Product/Age /Sales Channel/Region)
        • Sales Footprint
        • Strategy Overview
          • Marketing Strategy
          • Product Strategy
          • Channel Strategy
      • Mondi Group
        • Overview
        • Product Portfolio
        • Profitability by Market Segments (Product/Age /Sales Channel/Region)
        • Sales Footprint
        • Strategy Overview
          • Marketing Strategy
          • Product Strategy
          • Channel Strategy
      • Clifton Packaging Group Ltd
        • Overview
        • Product Portfolio
        • Profitability by Market Segments (Product/Age /Sales Channel/Region)
        • Sales Footprint
        • Strategy Overview
          • Marketing Strategy
          • Product Strategy
          • Channel Strategy
  20. Assumptions & Acronyms Used
  21. Research Methodology

List of Tables

  • Table 1: Global Market Value (USD Billion) Forecast by Region, 2020-2035
  • Table 2: Global Market Volume (Tons) Forecast by Region, 2020-2035
  • Table 3: Global Market Value (USD Billion) Forecast by Product Type, 2020-2035
  • Table 4: Global Market Volume (Tons) Forecast by Product Type, 2020-2035
  • Table 5: Global Market Value (USD Billion) Forecast by Material Used, 2020-2035
  • Table 6: Global Market Volume (Tons) Forecast by Material Used, 2020-2035
  • Table 7: Global Market Value (USD Billion) Forecast by Application, 2020-2035
  • Table 8: Global Market Volume (Tons) Forecast by Application, 2020-2035
  • Table 9: North America Market Value (USD Billion) Forecast by Country, 2020-2035
  • Table 10: North America Market Volume (Tons) Forecast by Country, 2020-2035
  • Table 11: North America Market Value (USD Billion) Forecast by Product Type, 2020-2035
  • Table 12: North America Market Volume (Tons) Forecast by Product Type, 2020-2035
  • Table 13: North America Market Value (USD Billion) Forecast by Material Used, 2020-2035
  • Table 14: North America Market Volume (Tons) Forecast by Material Used, 2020-2035
  • Table 15: North America Market Value (USD Billion) Forecast by Application, 2020-2035
  • Table 16: North America Market Volume (Tons) Forecast by Application, 2020-2035
  • Table 17: Latin America Market Value (USD Billion) Forecast by Country, 2020-2035
  • Table 18: Latin America Market Volume (Tons) Forecast by Country, 2020-2035
  • Table 19: Latin America Market Value (USD Billion) Forecast by Product Type, 2020-2035
  • Table 20: Latin America Market Volume (Tons) Forecast by Product Type, 2020-2035
  • Table 21: Latin America Market Value (USD Billion) Forecast by Material Used, 2020-2035
  • Table 22: Latin America Market Volume (Tons) Forecast by Material Used, 2020-2035
  • Table 23: Latin America Market Value (USD Billion) Forecast by Application, 2020-2035
  • Table 24: Latin America Market Volume (Tons) Forecast by Application, 2020-2035
  • Table 25: Western Europe Market Value (USD Billion) Forecast by Country, 2020-2035
  • Table 26: Western Europe Market Volume (Tons) Forecast by Country, 2020-2035
  • Table 27: Western Europe Market Value (USD Billion) Forecast by Product Type, 2020-2035
  • Table 28: Western Europe Market Volume (Tons) Forecast by Product Type, 2020-2035
  • Table 29: Western Europe Market Value (USD Billion) Forecast by Material Used, 2020-2035
  • Table 30: Western Europe Market Volume (Tons) Forecast by Material Used, 2020-2035
  • Table 31: Western Europe Market Value (USD Billion) Forecast by Application, 2020-2035
  • Table 32: Western Europe Market Volume (Tons) Forecast by Application, 2020-2035
  • Table 33: Eastern Europe Market Value (USD Billion) Forecast by Country, 2020-2035
  • Table 34: Eastern Europe Market Volume (Tons) Forecast by Country, 2020-2035
  • Table 35: Eastern Europe Market Value (USD Billion) Forecast by Product Type, 2020-2035
  • Table 36: Eastern Europe Market Volume (Tons) Forecast by Product Type, 2020-2035
  • Table 37: Eastern Europe Market Value (USD Billion) Forecast by Material Used, 2020-2035
  • Table 38: Eastern Europe Market Volume (Tons) Forecast by Material Used, 2020-2035
  • Table 39: Eastern Europe Market Value (USD Billion) Forecast by Application, 2020-2035
  • Table 40: Eastern Europe Market Volume (Tons) Forecast by Application, 2020-2035
  • Table 41: East Asia Market Value (USD Billion) Forecast by Country, 2020-2035
  • Table 42: East Asia Market Volume (Tons) Forecast by Country, 2020-2035
  • Table 43: East Asia Market Value (USD Billion) Forecast by Product Type, 2020-2035
  • Table 44: East Asia Market Volume (Tons) Forecast by Product Type, 2020-2035
  • Table 45: East Asia Market Value (USD Billion) Forecast by Material Used, 2020-2035
  • Table 46: East Asia Market Volume (Tons) Forecast by Material Used, 2020-2035
  • Table 47: East Asia Market Value (USD Billion) Forecast by Application, 2020-2035
  • Table 48: East Asia Market Volume (Tons) Forecast by Application, 2020-2035
  • Table 49: South Asia & Pacific Market Value (USD Billion) Forecast by Country, 2020-2035
  • Table 50: South Asia & Pacific Market Volume (Tons) Forecast by Country, 2020-2035
  • Table 51: South Asia & Pacific Market Value (USD Billion) Forecast by Product Type, 2020-2035
  • Table 52: South Asia & Pacific Market Volume (Tons) Forecast by Product Type, 2020-2035
  • Table 53: South Asia & Pacific Market Value (USD Billion) Forecast by Material Used, 2020-2035
  • Table 54: South Asia & Pacific Market Volume (Tons) Forecast by Material Used, 2020-2035
  • Table 55: South Asia & Pacific Market Value (USD Billion) Forecast by Application, 2020-2035
  • Table 56: South Asia & Pacific Market Volume (Tons) Forecast by Application, 2020-2035
  • Table 57: Middle East and Africa Market Value (USD Billion) Forecast by Country, 2020-2035
  • Table 58: Middle East and Africa Market Volume (Tons) Forecast by Country, 2020-2035
  • Table 59: Middle East and Africa Market Value (USD Billion) Forecast by Product Type, 2020-2035
  • Table 60: Middle East and Africa Market Volume (Tons) Forecast by Product Type, 2020-2035
  • Table 61: Middle East and Africa Market Value (USD Billion) Forecast by Material Used, 2020-2035
  • Table 62: Middle East and Africa Market Volume (Tons) Forecast by Material Used, 2020-2035
  • Table 63: Middle East and Africa Market Value (USD Billion) Forecast by Application, 2020-2035
  • Table 64: Middle East and Africa Market Volume (Tons) Forecast by Application, 2020-2035

List of Figures

  • Figure 1: Global Market Volume (Tons) Forecast 2020-2035
  • Figure 2: Global Market Pricing Analysis
  • Figure 3: Global Market Value (USD Billion) Forecast 2020-2035
  • Figure 4: Global Market Value Share and BPS Analysis by Product Type, 2025 and 2035
  • Figure 5: Global Market Y-o-Y Growth Comparison by Product Type, 2025-2035
  • Figure 6: Global Market Attractiveness Analysis by Product Type
  • Figure 7: Global Market Value Share and BPS Analysis by Material Used, 2025 and 2035
  • Figure 8: Global Market Y-o-Y Growth Comparison by Material Used, 2025-2035
  • Figure 9: Global Market Attractiveness Analysis by Material Used
  • Figure 10: Global Market Value Share and BPS Analysis by Application, 2025 and 2035
  • Figure 11: Global Market Y-o-Y Growth Comparison by Application, 2025-2035
  • Figure 12: Global Market Attractiveness Analysis by Application
  • Figure 13: Global Market Value (USD Billion) Share and BPS Analysis by Region, 2025 and 2035
  • Figure 14: Global Market Y-o-Y Growth Comparison by Region, 2025-2035
  • Figure 15: Global Market Attractiveness Analysis by Region
  • Figure 16: North America Market Incremental $ Opportunity, 2025-2035
  • Figure 17: Latin America Market Incremental $ Opportunity, 2025-2035
  • Figure 18: Western Europe Market Incremental $ Opportunity, 2025-2035
  • Figure 19: Eastern Europe Market Incremental $ Opportunity, 2025-2035
  • Figure 20: East Asia Market Incremental $ Opportunity, 2025-2035
  • Figure 21: South Asia & Pacific Market Incremental $ Opportunity, 2025-2035
  • Figure 22: Middle East and Africa Market Incremental $ Opportunity, 2025-2035
  • Figure 23: North America Market Value Share and BPS Analysis by Country, 2025 and 2035
  • Figure 24: North America Market Value Share and BPS Analysis by Product Type, 2025 and 2035
  • Figure 25: North America Market Y-o-Y Growth Comparison by Product Type, 2025-2035
  • Figure 26: North America Market Attractiveness Analysis by Product Type
  • Figure 27: North America Market Value Share and BPS Analysis by Material Used, 2025 and 2035
  • Figure 28: North America Market Y-o-Y Growth Comparison by Material Used, 2025-2035
  • Figure 29: North America Market Attractiveness Analysis by Material Used
  • Figure 30: North America Market Value Share and BPS Analysis by Application, 2025 and 2035
  • Figure 31: North America Market Y-o-Y Growth Comparison by Application, 2025-2035
  • Figure 32: North America Market Attractiveness Analysis by Application
  • Figure 33: Latin America Market Value Share and BPS Analysis by Country, 2025 and 2035
  • Figure 34: Latin America Market Value Share and BPS Analysis by Product Type, 2025 and 2035
  • Figure 35: Latin America Market Y-o-Y Growth Comparison by Product Type, 2025-2035
  • Figure 36: Latin America Market Attractiveness Analysis by Product Type
  • Figure 37: Latin America Market Value Share and BPS Analysis by Material Used, 2025 and 2035
  • Figure 38: Latin America Market Y-o-Y Growth Comparison by Material Used, 2025-2035
  • Figure 39: Latin America Market Attractiveness Analysis by Material Used
  • Figure 40: Latin America Market Value Share and BPS Analysis by Application, 2025 and 2035
  • Figure 41: Latin America Market Y-o-Y Growth Comparison by Application, 2025-2035
  • Figure 42: Latin America Market Attractiveness Analysis by Application
  • Figure 43: Western Europe Market Value Share and BPS Analysis by Country, 2025 and 2035
  • Figure 44: Western Europe Market Value Share and BPS Analysis by Product Type, 2025 and 2035
  • Figure 45: Western Europe Market Y-o-Y Growth Comparison by Product Type, 2025-2035
  • Figure 46: Western Europe Market Attractiveness Analysis by Product Type
  • Figure 47: Western Europe Market Value Share and BPS Analysis by Material Used, 2025 and 2035
  • Figure 48: Western Europe Market Y-o-Y Growth Comparison by Material Used, 2025-2035
  • Figure 49: Western Europe Market Attractiveness Analysis by Material Used
  • Figure 50: Western Europe Market Value Share and BPS Analysis by Application, 2025 and 2035
  • Figure 51: Western Europe Market Y-o-Y Growth Comparison by Application, 2025-2035
  • Figure 52: Western Europe Market Attractiveness Analysis by Application
  • Figure 53: Eastern Europe Market Value Share and BPS Analysis by Country, 2025 and 2035
  • Figure 54: Eastern Europe Market Value Share and BPS Analysis by Product Type, 2025 and 2035
  • Figure 55: Eastern Europe Market Y-o-Y Growth Comparison by Product Type, 2025-2035
  • Figure 56: Eastern Europe Market Attractiveness Analysis by Product Type
  • Figure 57: Eastern Europe Market Value Share and BPS Analysis by Material Used, 2025 and 2035
  • Figure 58: Eastern Europe Market Y-o-Y Growth Comparison by Material Used, 2025-2035
  • Figure 59: Eastern Europe Market Attractiveness Analysis by Material Used
  • Figure 60: Eastern Europe Market Value Share and BPS Analysis by Application, 2025 and 2035
  • Figure 61: Eastern Europe Market Y-o-Y Growth Comparison by Application, 2025-2035
  • Figure 62: Eastern Europe Market Attractiveness Analysis by Application
  • Figure 63: East Asia Market Value Share and BPS Analysis by Country, 2025 and 2035
  • Figure 64: East Asia Market Value Share and BPS Analysis by Product Type, 2025 and 2035
  • Figure 65: East Asia Market Y-o-Y Growth Comparison by Product Type, 2025-2035
  • Figure 66: East Asia Market Attractiveness Analysis by Product Type
  • Figure 67: East Asia Market Value Share and BPS Analysis by Material Used, 2025 and 2035
  • Figure 68: East Asia Market Y-o-Y Growth Comparison by Material Used, 2025-2035
  • Figure 69: East Asia Market Attractiveness Analysis by Material Used
  • Figure 70: East Asia Market Value Share and BPS Analysis by Application, 2025 and 2035
  • Figure 71: East Asia Market Y-o-Y Growth Comparison by Application, 2025-2035
  • Figure 72: East Asia Market Attractiveness Analysis by Application
  • Figure 73: South Asia & Pacific Market Value Share and BPS Analysis by Country, 2025 and 2035
  • Figure 74: South Asia & Pacific Market Value Share and BPS Analysis by Product Type, 2025 and 2035
  • Figure 75: South Asia & Pacific Market Y-o-Y Growth Comparison by Product Type, 2025-2035
  • Figure 76: South Asia & Pacific Market Attractiveness Analysis by Product Type
  • Figure 77: South Asia & Pacific Market Value Share and BPS Analysis by Material Used, 2025 and 2035
  • Figure 78: South Asia & Pacific Market Y-o-Y Growth Comparison by Material Used, 2025-2035
  • Figure 79: South Asia & Pacific Market Attractiveness Analysis by Material Used
  • Figure 80: South Asia & Pacific Market Value Share and BPS Analysis by Application, 2025 and 2035
  • Figure 81: South Asia & Pacific Market Y-o-Y Growth Comparison by Application, 2025-2035
  • Figure 82: South Asia & Pacific Market Attractiveness Analysis by Application
  • Figure 83: Middle East and Africa Market Value Share and BPS Analysis by Country, 2025 and 2035
  • Figure 84: Middle East and Africa Market Value Share and BPS Analysis by Product Type, 2025 and 2035
  • Figure 85: Middle East and Africa Market Y-o-Y Growth Comparison by Product Type, 2025-2035
  • Figure 86: Middle East and Africa Market Attractiveness Analysis by Product Type
  • Figure 87: Middle East and Africa Market Value Share and BPS Analysis by Material Used, 2025 and 2035
  • Figure 88: Middle East and Africa Market Y-o-Y Growth Comparison by Material Used, 2025-2035
  • Figure 89: Middle East and Africa Market Attractiveness Analysis by Material Used
  • Figure 90: Middle East and Africa Market Value Share and BPS Analysis by Application, 2025 and 2035
  • Figure 91: Middle East and Africa Market Y-o-Y Growth Comparison by Application, 2025-2035
  • Figure 92: Middle East and Africa Market Attractiveness Analysis by Application
  • Figure 93: Global Market - Tier Structure Analysis
  • Figure 94: Global Market - Company Share Analysis

Frequently Asked Questions

What is the projected size of the high barrier lidding film market in 2025?

The market size is valued at USD 2.5 billion in 2025.

What is the outlook on high barrier lidding demand by 2035?

The market is forecasted to reach USD 3.9 billion by 2035, reflecting a CAGR of 4.6%.

Which segment leads the high barrier lidding film market by material in 2025?

PET will lead the material segment, accounting for 36% of the global market share in 2025.

What is the top application segment for the high barrier lidding film market by 2025?

Food & beverages will dominate the application segment with a 42% share in 2025.

Which country is projected to have the fastest-growing high barrier lidding film market?

China is projected to be the fastest growing market with 13.9% CAGR

Explore Similar Insights

Future Market Insights

High Barrier Lidding Film Market