Global Hydrating Spray Market Size and Share Forecast Outlook 2025 to 2035

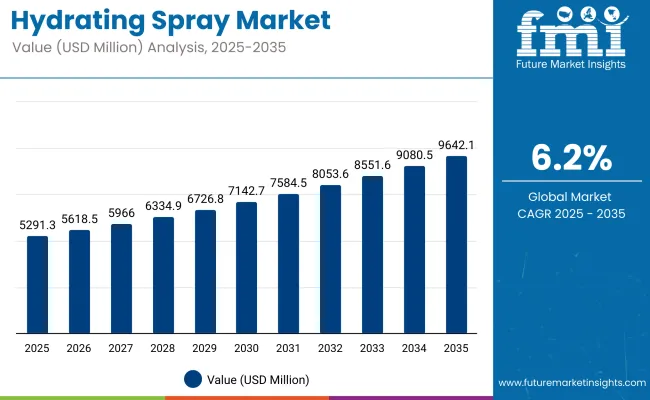
The Global Hydrating Spray Market is expected to record a valuation of USD 5,291.3 million in 2025 and USD 9,642.1 million in 2035, with an increase of USD 4,350.8 million, which equals a growth of 82.3% over the decade. The overall expansion represents a CAGR of 6.2% and a 1.8X increase in market size.
Quick Stats for Global Hydrating Spray Market

  • Global Hydrating Spray Market Value (2025): USD 5,291.3 million
  • Global Hydrating Spray Market Forecast Value (2035): USD 9,642.1 million
  • Global Hydrating Spray Market Forecast CAGR (2025 to 2035): 6.2%
  • Leading Segment in 2025: Facial Hydrating Sprays (64.1%)
  • Leading Ingredient Base in 2025: Water-Based (39.4%)
  • Key Growth Regions: North America (USA), Asia-Pacific (China, India), Europe (Germany, UK)
  • Top Key Players: L’Oréal S.A., Estée Lauder Companies, Shiseido, Unilever, Johnson & Johnson Services, Inc., Procter & Gamble, Kao Corporation, Revlon, La Roche‑Posay

Hydrating Spray Market

Global Hydrating Spray Market Key Takeaways

Metric Value
Market Estimated Value in (2025E) USD 5,291.3 million
Market Forecast Value in (2035F) USD 9,642.1 million
Forecast CAGR (2025 to 2035) 6.2%

During the first five-year period from 2025 to 2030, the market increases from USD 5,291.3 million to USD 7,142.8 million, adding USD 1,851.5 million, which accounts for 42.5% of the total decade growth. This phase records steady adoption of facial mists, makeup setting sprays, and soothing skincare products, driven by layering routines and demand for lightweight, multifunctional hydration. Facial Hydrating Sprays dominate this period as they cater to over 60% of skincare needs across both personal and professional use.

The second half from 2030 to 2035 contributes USD 2,499.3 million, equal to 57.5% of total growth, as the market jumps from USD 7,142.8 million to USD 9,642.1 million. This acceleration is powered by widespread deployment of SPF-infused hydrating mists, dermatologist-approved calming sprays, and the rise of digital-first D2C skincare platforms. Online distribution channels, including e-commerce and subscription-based models, capture a larger share above 50% by the end of the decade. Functional formulations enriched with vitamins, antioxidants, and mineral actives grow in share, expanding beyond basic water-based options to targeted, skin-type-specific solutions.

From 2020 to 2024, the Global Hydrating Spray Market grew from approximately USD 3,900 million to USD 5,291.3 million, driven by the rise of skincare layering trends, the clean beauty movement, and increased demand for on-the-go hydration. During this period, the competitive landscape was led by global cosmetics giants controlling nearly 90% of the premium segment revenues. Companies such as L’Oréal S.A. (11.7%), Estée Lauder, and Shiseido focused heavily on facial mists and mineral-rich water sprays integrated with dermatologist-recommended routines.

Competitive differentiation centered on ingredient purity, skin sensitivity claims, and multi-use positioning (hydration + makeup setting + UV protection). Subscription models and refillable packaging had limited adoption during this period, contributing less than 10% to the global market.

Demand for hydrating sprays is projected to reach USD 5,291.3 million in 2025, with the revenue mix shifting rapidly toward personalized solutions. Water-based forms remain essential, but humectant-enriched, vitamin-infused, and SPF-integrated sprays gain stronger traction. Traditional global leaders face growing competition from digitally native brands offering AI-powered skincare diagnostics, ingredient transparency, and cloud-based skincare coaching.

L’Oréal and Estée Lauder are pivoting to hybrid models with sensorial forms, remote skincare trials, and ingredient-specific refills. Emerging players specializing in botanical formulations, eco-certified packaging, and mobile-integrated skincare routines are gaining share. The future of competitive advantage is shifting from brand name and distribution power to ecosystem depth, personalization, and sustainable innovation.

Why the Hydrating Spray Market is Growing?

Advancements in cosmetic formulation science have significantly enhanced the performance and multifunctionality of hydrating sprays. These products now offer more than just surface moisturethey deliver anti-pollution benefits, UV protection, and soothing effects, making them essential to modern skincare routines. Facial Hydrating Sprays, in particular, are witnessing high adoption due to their compatibility with makeup, skin layering regimens, and portability. The growing consumer preference for clean-label, water-based, and lightweight skincare has accelerated demand.

Water-based formulations are dominating due to their non-greasy texture and high tolerance across skin types, while ingredient-conscious buyers are increasingly drawn to mists enriched with hyaluronic acid, botanical extracts, and vitamins. Online platformsespecially D2C and subscription-based skincare servicesare expanding the consumer base. Their focus on personalization, transparency, and recurring delivery models is reshaping how consumers engage with facial and body care categories. Refillable spray packaging and mini forms are also contributing to higher frequency of purchase and sustainable consumption.

Segmental Analysis

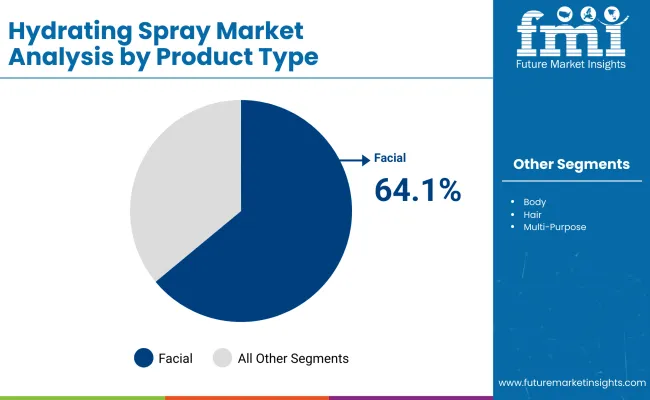
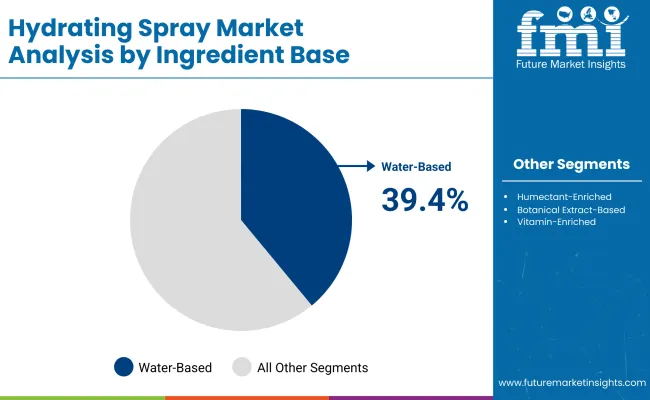
The market is segmented by product type, ingredient base, packaging size, distribution channel, and region. By Product Type, Facial Hydrating Sprays lead the market with a 64.1% share in 2025. Other categories such as Body, Hair, and Multi-Purpose Hydrating Sprays serve specific routines but account for a smaller portion of sales. By Ingredient Base, Water-Based formulations dominate with a 39.4% share in 2025, driven by demand for thermal water, spring water, and mineral-rich bases. Other active-led categories include humectant-enriched (e.g., hyaluronic acid), botanical extract-based, and vitamin-infused mists.

By Packaging Size, 100-200 ml forms account for the largest share at 48.3%, balancing portability and value-for-money. Travel-size minis and salon-sized refills are growing in niche applications. By Distribution Channel, online platformsespecially e-commerce marketplaces and brand-owned D2C websitesare expanding rapidly. While offline stores such as pharmacies and beauty retailers remain important in emerging markets, subscription-based skincare delivery is unlocking higher LTV (lifetime value) in developed economies.

By Region, North America remains the largest market, led by the USA, which held a 28.1% share in 2025. Asia-Pacific is the fastest-growing region, with China and India contributing strongly due to urbanization, skincare awareness, and digital retail expansion. Europe continues to lead in clean beauty innovation and refillable packaging adoption.
Insights into the Product Type Segment with Facial Hydrating Sprays Leading in Market Share

Hydrating Spray Market By Product

Product Type Segment Market Value Share, 2025
Facial Hydrating Sprays 64.1%
Others 35.9%

The Facial Hydrating Sprays segment is projected to contribute 64.1% of the global Hydrating Spray Market revenue in 2025, maintaining its lead as the dominant product type. This leadership is attributed to the category’s multifunctionality, lightweight application, and compatibility with daily skincare routines including toning, setting, and SPF layering. The surge in demand is further bolstered by increased awareness of hydration layering, especially in urban and working populations.

The segment also benefits from its broad appeal across gender, age, and skin types, often supported by dermatological recommendations. With online tutorials and beauty influencers promoting facial mists as “everyday essentials,” this segment is expected to retain its dominant position throughout the decade, both in value and volume.
Insights into the Ingredient Base Segment with Water-Based Formulations Leading in Market Share

Hydrating Spray Market By Ingrediant

Product Type Segment Market Value Share, 2025
Water-Based 39.4%
Others 60.6%

Water-Based formulations are projected to account for 39.4% of the global market revenue in 2025, leading the ingredient base segment. The dominance of water-based sprays is driven by high consumer trust in thermal spring water, purified water, and mineral-rich water as gentle yet effective hydration sources.

These formulations are especially popular among consumers with sensitive skin, supporting their reputation as safe, non-irritating, and highly versatile products. The segment continues to evolve with added humectants, antioxidants, and electrolytes, but remains grounded in water as the core delivery medium. As clean-label and fragrance-free demands rise, water-based hydrating sprays are positioned to remain the go-to form for everyday skin refreshment and hydration.

Insights into the Packaging Size Segment with 100-200 ml Leading in Market Share

Product Type Segment Market Value Share, 2025
100-200 ml 48.3%
Others 51.7%

The 100-200 ml packaging segment is projected to contribute 48.3% of the Hydrating Spray Market revenue in 2025, emerging as the most preferred form across both retail and online channels. This size balances portability with cost-effectiveness, making it ideal for regular daily users who value convenience without frequent restocking.

Brands are favoring this form for mainstream and premium facial mist lines, with most dermatologist-approved and travel-friendly sprays launched in this volume range. Additionally, 100-200 ml forms comply with international carry-on regulations, contributing to their high popularity among frequent travelers and beauty consumers who favor mid-sized, high-performance mists.

What are the Drivers, Restraints, and Key Trends of the Global Hydrating Spray Market?

Drivers

Dermocosmetic Positioning of Facial Sprays in Europe and North America

The widespread positioning of hydrating sprays as dermocosmetic productsparticularly in France, Germany, and the USA has elevated their status beyond cosmetic refreshers. Brands like La Roche-Posay, Avène, and Vichy have successfully anchored thermal water sprays as prescription-recommended hydration therapies for post-procedure care, eczema relief, and barrier repair. This medical-skincare crossover creates trust, secures pharmacy channel placement, and enables premium pricingespecially for facial hydrating sprays.

D2C-Driven Ingredient Transparency in APAC Markets

In Asia-Pacific (especially China and South Korea), digitally native brands are leveraging ingredient-level transparency and skin-type-specific messaging to differentiate SKUs. Water-based sprays with single or dual actives (e.g., 95% rosewater + niacinamide) are gaining traction due to platforms like Little Red Book and Tmall Global allowing side-by-side comparisons. The driver here is not only formulation efficacy but also digital-first ingredient education that aligns with growing consumer skincare IQ.

Restraints

Low Repurchase Rate for Non-Facial Forms (Body & Hair Sprays)

While facial sprays see routine-based adoption, body and hair hydrating sprays suffer from low repeat usage. Consumers often perceive body mists as seasonal or luxury add-ons, and hair sprays as occasional de-frizzers or refreshers rather than daily-use staples. This limits volume growth and results in higher shelf turnover rates in retail, discouraging aggressive SKU expansion by brands in these sub-segments.

Regulatory Ambiguity Around Functional Claims (SPF, Anti-Pollution)

In many markets, especially Southeast Asia and the Middle East, hydrating sprays that make claims like SPF protection or anti-pollution defense fall into a regulatory gray zone. Depending on the country, these sprays may require drug or OTC classification instead of cosmetic approval, increasing cost and compliance burdens. Smaller players find it difficult to scale SKUs with hybrid claims, which restrains innovation in multifunctional forms.

Key Trends

Rise of Refillable Hydrating Sprays & Eco-Conscious Atomizers

In markets like France, Japan, and the Nordics, refillable facial sprays using high-quality glass bottles and aluminum pump systems are emerging as a trend among mid-to-premium brands. The demand is driven by Gen Z and Millennial buyers prioritizing low-waste consumption and clean beauty alignment. These refills are often sold in pouch or capsule forms, with some brands offering lifetime bottles as part of loyalty or subscription programs.

Adoption of Skincare Misting in Male Grooming and Gym Kits

A growing microtrend in the USA, UK, and UAE is the inclusion of hydrating facial mists in men’s grooming and fitness routines. Male-focused brands now include anti-fatigue or mattifying mists as part of post-shave or post-workout kits. These products are positioned as sweat-neutralizers, barrier refreshers, or pore refinersa strategic shift that opens up new application occasions and merchandising angles for hydration products beyond traditional female segments.
Analysis of Global Hydrating Spray Market By Key Countries

Hydrating Spray Market By Country

Countries CAGR (2025 to 2035)
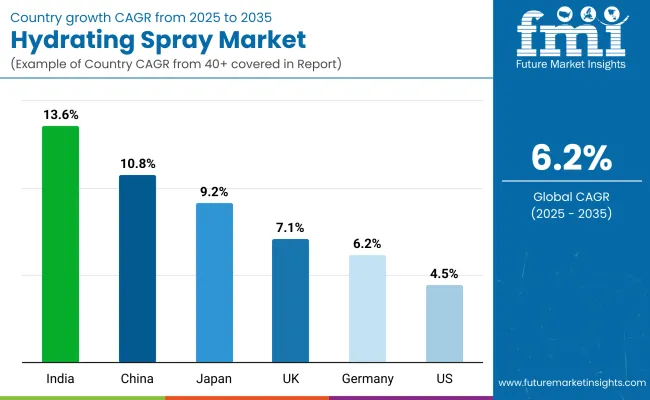
China 10.8%
India 13.6%
Germany 6.2%
USA 4.5%
UK 7.1%
Japan 9.2%

The global Hydrating Spray Market exhibits distinct regional disparities in growth trajectory, shaped by consumer skincare habits, urbanization rates, and the maturity of digital retail ecosystems. Asia-Pacific emerges as the fastest-growing region, anchored by India at 13.6% CAGR and China at 10.8% CAGR. India’s accelerated growth is fueled by rising adoption of facial hydration products in tier-1 and tier-2 cities, driven by younger, digitally engaged consumers and expanding online D2C platforms.

Premium skincare routines once limited to metros are now penetrating mid-income urban households through affordable, refillable mist forms. In China, hydrating sprays are benefiting from ingredient-conscious buyers seeking minimal formulations with hyaluronic acid and floral waters. The region’s momentum is also supported by influencer-driven product education on platforms like Little Red Book and TmallGlobal. Europe maintains a robust growth outlook, led by Germany at 6.2% CAGR and the UK at 7.1% CAGR.

Growth here is anchored in the dermocosmetic positioning of facial sprays as pharmacy-grade hydration solutions, especially in markets like France and Germany. Stringent regulatory requirements around product safety, clean labeling, and sustainability are encouraging innovation in preservative-free, fragrance-free sprays, further expanding category relevance across skin-sensitive consumer groups. North America exhibits moderate but steady expansion, with the USA growing at 4.5% CAGR.

As one of the most established markets globally, the USA shows high product penetration in facial sprays but limited growth in newer forms such as body and hair hydrating sprays. Growth is increasingly driven by refillable packaging forms, clean-ingredient claims, and the inclusion of hydrating mists in men’s grooming and gym-care routines. While product saturation is visible in major metro markets, expansion is occurring in wellness spas, clinical dermatology centers, and subscription-based skincare kits.

Japan, with a 9.2% CAGR, presents a mature yet premium-oriented opportunity. Consumers in Japan favor ultra-light, non-fragranced sprays positioned as part of “skin minimalism” regimens. High trust in water-based and thermal formulations, combined with advanced spray technology and packaging design, maintains Japan’s reputation for high-quality hydration forms with a focus on sensorial experience.

Sales Outlook for Hydrating Spray Market in the United States

Year USA Hydrating Spray Market (USD Million)
2025 1169.38
2026 1236.55
2027 1307.57
2028 1382.68
2029 1462.10
2030 1546.08
2031 1634.88
2032 1728.79
2033 1828.09
2034 1933.09
2035 2044.13

The Hydrating Spray Market in the United States is projected to grow at a CAGR of 4.5% from 2025 to 2035, led by mature consumer demand for high-end skincare and wellness-centric facial sprays. The USA holds a 22.1% global market share in 2025, expected to see a slight decline to 21.2% by 2035, as Asia-Pacific markets accelerate.

The USA Hydrating Spray segment is valued at USD 1,169.38 million in 2025, rising to USD 2,044.13 million by 2035. Facial Hydrating Sprays remain dominant in the USA, reflecting their widespread usage in skincare layering routines, wellness kits, and travel-friendly hydration. Demand is also expanding in niche segments such as men’s grooming, post-workout misting, and on-the-go travel kits.

  • Consumers show a strong preference for dermatologist-backed and refillable spray formats.
  • Dermatologist-recommended facial sprays are central to American skincare regimens.
  • Growth is emerging from gym/fitness-based usage and premium spa kits. Facial mists are bundled with hydration serums in cross-category beauty boxes.

Growth and Expansion Outlook for Hydrating Spray Market in the United Kingdom

The Hydrating Spray Market in the UK is expected to grow at a CAGR of 7.1% through 2035. A strong culture of pharmacy-backed skincare and the increasing popularity of SPF-infused hydrating sprays are driving sales. Eco-conscious shoppers are showing higher affinity for plastic-free, glass-packaged, and sustainably sourced mists.

  • The UK holds an 8.1% global share in 2025, expected to taper slightly to 7.6% by 2035, reflecting the rise of emerging Asian markets.
  • Consumers are adopting facial sprays with built-in SPF protection for daily commutes, while British beauty brands integrate hydrating mists into multi-step skincare kits.
  • Retailers like Boots and Superdrug promote bundle discounts on hydration-centric products.

Growth and Expansion Outlook for Hydrating Spray Market in India

India is forecast to grow at a CAGR of 13.6%, the highest among major countries in the hydrating spray market. Market share is projected to increase from 5.2% in 2025 to 6.1% in 2035. Rising penetration into tier-2 and tier-3 cities, beauty influencer-led skincare education, and price-accessible SKUs are making hydration mists part of daily skin routines.

  • Affordable, refillable sprays are making inroads into mass retail and D2C platforms.
  • Ayurvedic and botanical ingredient bases are gaining traction among new-age buyers.
  • Beauty brands are targeting younger demographics with “first skincare” hydration ranges.

Sales Outlook for Hydrating Spray Market in China

Market Share 2025
China 12.1%
India 5.2%
Germany 14.1%
USA 22.1%
UK 8.1%
Japan 6.9%
Market Share 2035
China 13.4%
India 6.1%
Germany 12.8%
USA 21.2%
UK 7.6%
Japan 8.4%

China is set to grow at a CAGR of 10.8%, with hydrating sprays accounting for 12.1% of the global market in 2025, expected to rise to 13.4% by 2035. Chinese demand is driven by ingredient-conscious buyers seeking minimal, functional formulations like hyaluronic acid, floral waters, and thermal spring extracts. Digital beauty ecosystems like Xiaohongshu and Tmall Global amplify adoption through influencer-led education.

  • Humectant-rich mists (with hyaluronic acid) are in high demand for year-round hydration.
  • Leading domestic brands promote hydrating sprays as essential toner-step replacements.
  • Growth is also strong in mists offering dual benefits such as hydration + calming, sleep-aid, or brightening.

Opportunity Analysis of the USA Hydrating Spray Market

Product Segment Market Value Share, 2025
Facial Hydrating Sprays 61.3%
Others 38.7%

The USA Hydrating Spray Market is valued at USD 1,169.38 million in 2025, with Facial Hydrating Sprays leading at 61.3% (USD 716.83 million), followed by other product types at 38.7% (USD 452.55 million). The dominance of facial sprays is driven by their integration into skincare layering routines, wellness kits, and professional spa treatments. Mature consumer demand for dermatologist-recommended, multipurpose hydration formats such as sprays that combine hydration, soothing, and makeup setting keeps this segment ahead.

Portability, refillable packaging, and compatibility with on-the-go lifestyles enhance adoption, while e-commerce platforms and subscription-based beauty boxes ensure recurring sales. Functional innovations like SPF-infused and vitamin-rich mists are strengthening premium positioning. Other hydrating formats see niche growth in men’s grooming, fitness, and travel-oriented products.

Opportunity Analysis of the China Hydrating Spray Market

Ingredient Base Segment Market Value Share, 2025
Humectant-Enriched 54.7%
Others 45.3%

The China Hydrating Spray Market is valued at USD 640.25 million in 2025, with Humectant-Enriched formulations leading at 54.7% (USD 350.22 million), followed by other ingredient bases at 45.3% (USD 290.03 million). Humectant-rich sprays, often formulated with hyaluronic acid, glycerin, and aloe vera, are highly favored for year-round hydration across varied climates. China’s skincare-savvy youth, influenced by platforms like Xiaohongshu and Tmall Global, actively seek transparent ingredient lists and clinical-grade hydration solutions.

Seasonal formulations designed for humid summers and dry winters further drive category innovation. Premium domestic brands position hydrating sprays as essential toner-step replacements, while international brands target the market with thermal and botanical water mists.
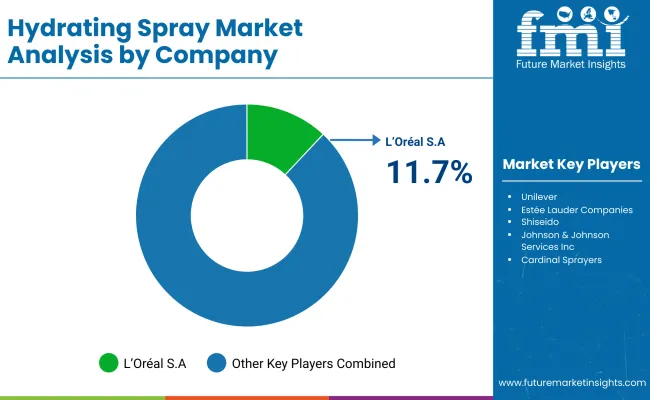
Competitive Landscape of the Global Hydrating Spray Market

Hydrating Spray Market By Company

The Global Hydrating Spray Market remains moderately fragmented, with a mix of multinational skincare giants, regional beauty leaders, and specialist wellness brands actively competing in innovation, reach, and product positioning. L’Oréal S.A., the market leader with an 11.7% share in 2025, continues to dominate due to its broad skincare portfolio, strong global distribution, and early investment in dermatologist-backed hydration ranges.

Its brands such as La Roche-Posay, Vichy, and L’Oréal Paris anchor facial hydrating spray adoption across both mass and dermocosmetic segments. The company is investing in water science, micro-mist spray technology, and on-the-go travel packaging to extend category leadership.

Other prominent players in the fragmented 88.3% share are regional manufacturers and niche clean beauty brands focused on ingredient purity, minimalist formulations, and eco-conscious packaging. These include brands with core offerings in humectant-enriched or SPF-infused sprays, often tailored to local climate conditions and skin types.

Competitive differentiation is increasingly being shaped not just by formula innovation, but by the ecosystem surrounding the productincluding skin diagnostic app integration, reusable/refillable spray solutions, and AR-based skin hydration tracking tools offered by leading and emerging players alike. As consumer preferences shift toward multi-functionality, ingredient clarity, and sustainability, the market is moving beyond basic hydration toward wellness-enhancing, mood-oriented, and dermocosmetic-formulated sprays, challenging traditional giants to stay agile amid rising indie and D2C competition.

Key Developments in Global Hydrating Spray Market

  • On April 25, 2024, L’Oréal’s La Roche‑Posay launched Mela B3 Dark Spot Serum & Mela B3 UV Daily Moisturizer SPF 30, powered by the patented Melasyl™ molecule, offering pigmentation correction and daily hydration protection. This launch signals the brand’s deeper integration of functional skincare into hydrating formsbridging hydration with UV and barrier repair claims.
  • In mid‑2024, Estée Lauder debuted the “Set + Refresh Perfecting Makeup Mist”, a hydrating facial spray infused with electrolytes and caffeine, designed to boost radiance and refresh skin on-the-go across multiple applications. The product is positioned for makeup lovers seeking hydration, glow effect, and setting benefits in a single mist.

Scope of the Report

Item Value
Quantitative Units USD 5,291.3 million
Product Type Facial Hydrating Sprays, Body Hydrating Sprays, Hair Hydrating Sprays, Multi-Purpose Hydrating Sprays
Ingredient Base Water-Based, Humectant-Enriched, Botanical Extract-Based, Vitamin-Enriched / Antioxidant Sprays, SPF or Functional Additive-Based, Natural / Organic Formulations
Packaging Size Below 100 ml, 100-200 ml, 201-300 ml, Above 300 ml
Sales Channel Offline Channels: Supermarkets / Hypermarkets, Beauty & Cosmetics Specialty Stores, Pharmacies / Drugstores, Department Stores, Salons & Spas Online Channels: E-commerce Marketplaces, Brand-Owned D2C Websites, Subscription-Based Online Models
Regions Covered North America, Europe, Asia-Pacific, Latin America, Middle East & Africa
Country Covered United States, Canada, Germany, France, United Kingdom, China, Japan, India, Brazil, South Africa
Key Companies Profiled Unilever, L’Oréal, Estée Lauder Companies, Shiseido, Johnson & Johnson Services, Inc., Cardinal Sprayers, Oriflame Cosmetics AG, Kao Corporation, Procter & Gamble, Revlon, Eau Thermale Avène, Mario Badescu Skin Care Inc., The Nature’s Co., Heritage Store, La Roche Posay
Additional Attributes Dollar sales by product type, ingredient base, packaging size, and channel; gender-specific consumption; natural and clean-label preferences; consumer shift toward SPF-infused and antioxidant-based mists; rise in male grooming product inclusion; portability and on-the-go usage trends; subscription-based D2C growth; strong demand in Asia’s humid/tropical climates; innovation in botanical and vitamin-based formulations

Key Segments

By Product Type:

  • Facials
  • Bodys
  • Hairs
  • Multi-Purposes

By Ingredient Base:

  • Water-Based
  • Humectant-Enriched
  • Botanical Extract-Based
  • Vitamin-Enriched / Antioxidant Sprays
  • SPF or Functional Additive-Based
  • Natural / Organic Formulations

By Packaging Size:

  • Below 100 ml
  • 100-200 ml
  • 201-300 ml
  • Above 300 ml

By Distribution Channel:

  • Offline Channels
    • Supermarkets / Hypermarkets
    • Beauty & Cosmetics Specialty Stores
    • Pharmacies / Drugstores
    • Department Stores
    • Salons & Spas
  • Online Channels
    • E-commerce Marketplaces
    • Brand-Owned D2C Websites
    • Subscription-Based Online Models

By Region:

  • North America
  • Latin America
  • Europe
  • East Asia
  • South Asia & Pacific
  • Middle East and Africa

Table of Content

  1. Executive Summary
    • Global Market Outlook
    • Demand-side Trends
    • Supply-side Trends
    • Technology Roadmap Analysis
    • Analysis and Recommendations
  2. Market Overview
    • Market Coverage / Taxonomy
    • Market Definition / Scope / Limitations
  3. Market Background
    • Market Dynamics
      • Drivers
      • Restraints
      • Opportunity
      • Trends
    • Scenario Forecast
      • Demand in Optimistic Scenario
      • Demand in Likely Scenario
      • Demand in Conservative Scenario
    • Opportunity Map Analysis
    • Product Life Cycle Analysis
    • Supply Chain Analysis
      • Supply Side Participants and their Roles
        • Producers
        • Mid-Level Participants (Traders/ Agents/ Brokers)
        • Wholesalers and Distributors
      • Value Added and Value Created at Node in the Supply Chain
      • List of Raw Material Suppliers
      • List of Existing and Potential Buyer’s
    • Investment Feasibility Matrix
    • Value Chain Analysis
      • Profit Margin Analysis
      • Wholesalers and Distributors
      • Retailers
    • PESTLE and Porter’s Analysis
    • Regulatory Landscape
      • By Key Regions
      • By Key Countries
    • Regional Parent Market Outlook
    • Production and Consumption Statistics
    • Import and Export Statistics
  4. Global Market Analysis 2020 to 2024 and Forecast, 2025 to 2035
    • Historical Market Size Value (USD Million) & Volume (Units) Analysis, 2020 to 2024
    • Current and Future Market Size Value (USD Million) & Volume (Units) Projections, 2025 to 2035
      • Y-o-Y Growth Trend Analysis
      • Absolute $ Opportunity Analysis
  5. Global Market Analysis 2020 to 2024 and Forecast 2025 to 2035, By Product Type
    • Introduction / Key Findings
    • Historical Market Size Value (USD Million) & Volume (Units) Analysis By Product Type, 2020 to 2024
    • Current and Future Market Size Value (USD Million) & Volume (Units) Analysis and Forecast By Product Type, 2025 to 2035
      • Facials
      • Bodys
      • Hairs
      • Multi-Purposes
    • Y-o-Y Growth Trend Analysis By Product Type, 2020 to 2024
    • Absolute $ Opportunity Analysis By Product Type, 2025 to 2035
  6. Global Market Analysis 2020 to 2024 and Forecast 2025 to 2035, By Ingredient Base
    • Introduction / Key Findings
    • Historical Market Size Value (USD Million) & Volume (Units) Analysis By Ingredient Base, 2020 to 2024
    • Current and Future Market Size Value (USD Million) & Volume (Units) Analysis and Forecast By Ingredient Base, 2025 to 2035
      • Water-Based
      • Humectant-Enriched
      • Botanical Extract-Based
      • Vitamin-Enriched / Antioxidant Sprays
      • SPF or Functional Additive-Based
      • Natural / Organic Formulations
    • Y-o-Y Growth Trend Analysis By Ingredient Base, 2020 to 2024
    • Absolute $ Opportunity Analysis By Ingredient Base, 2025 to 2035
  7. Global Market Analysis 2020 to 2024 and Forecast 2025 to 2035, By Packaging Size
    • Introduction / Key Findings
    • Historical Market Size Value (USD Million) & Volume (Units) Analysis By Packaging Size, 2020 to 2024
    • Current and Future Market Size Value (USD Million) & Volume (Units) Analysis and Forecast By Packaging Size, 2025 to 2035
      • Below 100 ml
      • 100-200 ml
      • 201-300 ml
      • Above 300 ml
    • Y-o-Y Growth Trend Analysis By Packaging Size, 2020 to 2024
    • Absolute $ Opportunity Analysis By Packaging Size, 2025 to 2035
  8. Global Market Analysis 2020 to 2024 and Forecast 2025 to 2035, By Distribution Channel
    • Introduction / Key Findings
    • Historical Market Size Value (USD Million) & Volume (Units) Analysis By Distribution Channel, 2020 to 2024
    • Current and Future Market Size Value (USD Million) & Volume (Units) Analysis and Forecast By Distribution Channel, 2025 to 2035
      • Offline Channels
        • Supermarkets / Hypermarkets
        • Beauty & Cosmetics Specialty Stores
        • Pharmacies / Drugstores
        • Department Stores
        • Salons & Spas
      • Online Channels
        • E-commerce Marketplaces
        • Brand-Owned D2C Websites
        • Subscription-Based Online Models
    • Y-o-Y Growth Trend Analysis By Distribution Channel, 2020 to 2024
    • Absolute $ Opportunity Analysis By Distribution Channel, 2025 to 2035
  9. Global Market Analysis 2020 to 2024 and Forecast 2025 to 2035, By Region
    • Introduction
    • Historical Market Size Value (USD Million) & Volume (Units) Analysis By Region, 2020 to 2024
    • Current Market Size Value (USD Million) & Volume (Units) Analysis and Forecast By Region, 2025 to 2035
      • North America
      • Latin America
      • Europe
      • East Asia
      • South Asia & Pacific
      • Middle East and Africa
    • Market Attractiveness Analysis By Region
  10. North America Market Analysis 2020 to 2024 and Forecast 2025 to 2035, By Country
    • Historical Market Size Value (USD Million) & Volume (Units) Trend Analysis By Market Taxonomy, 2020 to 2024
    • Market Size Value (USD Million) & Volume (Units) Forecast By Market Taxonomy, 2025 to 2035
      • By Country
        • USA
        • Canada
      • By Product Type
      • By Ingredient Base
      • By Packaging Size
      • By Distribution Channel
    • Market Attractiveness Analysis
      • By Country
      • By Product Type
      • By Ingredient Base
      • By Packaging Size
      • By Distribution Channel
    • Key Takeaways
  11. Latin America Market Analysis 2020 to 2024 and Forecast 2025 to 2035, By Country
    • Historical Market Size Value (USD Million) & Volume (Units) Trend Analysis By Market Taxonomy, 2020 to 2024
    • Market Size Value (USD Million) & Volume (Units) Forecast By Market Taxonomy, 2025 to 2035
      • By Country
        • Brazil
        • Mexico
        • Colombia
        • Rest of Latin America
      • By Product Type
      • By Ingredient Base
      • By Packaging Size
      • By Distribution Channel
    • Market Attractiveness Analysis
      • By Country
      • By Product Type
      • By Ingredient Base
      • By Packaging Size
      • By Distribution Channel
    • Key Takeaways
  12. Europe Market Analysis 2020 to 2024 and Forecast 2025 to 2035, By Country
    • Historical Market Size Value (USD Million) & Volume (Units) Trend Analysis By Market Taxonomy, 2020 to 2024
    • Market Size Value (USD Million) & Volume (Units) Forecast By Market Taxonomy, 2025 to 2035
      • By Country
        • Germany
        • UK
        • France
        • Italy
        • Spain
        • Belgium
        • Netherlands
        • Nordic
        • Switzerland
        • Russia
        • Poland
        • Rest of Europe
      • By Product Type
      • By Ingredient Base
      • By Packaging Size
      • By Distribution Channel
    • Market Attractiveness Analysis
      • By Country
      • By Product Type
      • By Ingredient Base
      • By Packaging Size
      • By Distribution Channel
    • Key Takeaways
  13. East Asia Market Analysis 2020 to 2024 and Forecast 2025 to 2035, By Country
    • Historical Market Size Value (USD Million) & Volume (Units) Trend Analysis By Market Taxonomy, 2020 to 2024
    • Market Size Value (USD Million) & Volume (Units) Forecast By Market Taxonomy, 2025 to 2035
      • By Country
        • China
        • Japan
        • South Korea
      • By Product Type
      • By Ingredient Base
      • By Packaging Size
      • By Distribution Channel
    • Market Attractiveness Analysis
      • By Country
      • By Product Type
      • By Ingredient Base
      • By Packaging Size
      • By Distribution Channel
    • Key Takeaways
  14. South Asia & Pacific Market Analysis 2020 to 2024 and Forecast 2025 to 2035, By Country
    • Historical Market Size Value (USD Million) & Volume (Units) Trend Analysis By Market Taxonomy, 2020 to 2024
    • Market Size Value (USD Million) & Volume (Units) Forecast By Market Taxonomy, 2025 to 2035
      • By Country
        • India
        • Thailand
        • Malaysia
        • Indonesia
        • Singapore
        • Vietnam
        • Australia
        • New Zealand
        • Rest of South Asia
      • By Product Type
      • By Ingredient Base
      • By Packaging Size
      • By Distribution Channel
    • Market Attractiveness Analysis
      • By Country
      • By Product Type
      • By Ingredient Base
      • By Packaging Size
      • By Distribution Channel
    • Key Takeaways
  15. Middle East and Africa Market Analysis 2020 to 2024 and Forecast 2025 to 2035, By Country
    • Historical Market Size Value (USD Million) & Volume (Units) Trend Analysis By Market Taxonomy, 2020 to 2024
    • Market Size Value (USD Million) & Volume (Units) Forecast By Market Taxonomy, 2025 to 2035
      • By Country
        • Turkey
        • UAE
        • Saudi Arabia
        • Israel
        • Other GCC Countries
        • North Africa
        • South Africa
      • By Product Type
      • By Ingredient Base
      • By Packaging Size
      • By Distribution Channel
    • Market Attractiveness Analysis
      • By Country
      • By Product Type
      • By Ingredient Base
      • By Packaging Size
      • By Distribution Channel
    • Key Takeaways
  16. Key Countries Market Analysis
    • USA
      • Pricing Analysis
      • Market Share Analysis, 2024
        • By Product Type
        • By Ingredient Base
        • By Packaging Size
        • By Distribution Channel
    • Canada
      • Pricing Analysis
      • Market Share Analysis, 2024
        • By Product Type
        • By Ingredient Base
        • By Packaging Size
        • By Distribution Channel
    • Brazil
      • Pricing Analysis
      • Market Share Analysis, 2024
        • By Product Type
        • By Ingredient Base
        • By Packaging Size
        • By Distribution Channel
    • Mexico
      • Pricing Analysis
      • Market Share Analysis, 2024
        • By Product Type
        • By Ingredient Base
        • By Packaging Size
        • By Distribution Channel
    • Colombia
      • Pricing Analysis
      • Market Share Analysis, 2024
        • By Product Type
        • By Ingredient Base
        • By Packaging Size
        • By Distribution Channel
    • Rest of Latin America
      • Pricing Analysis
      • Market Share Analysis, 2024
        • By Product Type
        • By Ingredient Base
        • By Packaging Size
        • By Distribution Channel
    • Germany
      • Pricing Analysis
      • Market Share Analysis, 2024
        • By Product Type
        • By Ingredient Base
        • By Packaging Size
        • By Distribution Channel
    • UK
      • Pricing Analysis
      • Market Share Analysis, 2024
        • By Product Type
        • By Ingredient Base
        • By Packaging Size
        • By Distribution Channel
    • France
      • Pricing Analysis
      • Market Share Analysis, 2024
        • By Product Type
        • By Ingredient Base
        • By Packaging Size
        • By Distribution Channel
    • Italy
      • Pricing Analysis
      • Market Share Analysis, 2024
        • By Product Type
        • By Ingredient Base
        • By Packaging Size
        • By Distribution Channel
    • Spain
      • Pricing Analysis
      • Market Share Analysis, 2024
        • By Product Type
        • By Ingredient Base
        • By Packaging Size
        • By Distribution Channel
    • Belgium
      • Pricing Analysis
      • Market Share Analysis, 2024
        • By Product Type
        • By Ingredient Base
        • By Packaging Size
        • By Distribution Channel
    • Netherlands
      • Pricing Analysis
      • Market Share Analysis, 2024
        • By Product Type
        • By Ingredient Base
        • By Packaging Size
        • By Distribution Channel
    • Nordic
      • Pricing Analysis
      • Market Share Analysis, 2024
        • By Product Type
        • By Ingredient Base
        • By Packaging Size
        • By Distribution Channel
    • Switzerland
      • Pricing Analysis
      • Market Share Analysis, 2024
        • By Product Type
        • By Ingredient Base
        • By Packaging Size
        • By Distribution Channel
    • Russia
      • Pricing Analysis
      • Market Share Analysis, 2024
        • By Product Type
        • By Ingredient Base
        • By Packaging Size
        • By Distribution Channel
    • Poland
      • Pricing Analysis
      • Market Share Analysis, 2024
        • By Product Type
        • By Ingredient Base
        • By Packaging Size
        • By Distribution Channel
    • Rest of Europe
      • Pricing Analysis
      • Market Share Analysis, 2024
        • By Product Type
        • By Ingredient Base
        • By Packaging Size
        • By Distribution Channel
    • China
      • Pricing Analysis
      • Market Share Analysis, 2024
        • By Product Type
        • By Ingredient Base
        • By Packaging Size
        • By Distribution Channel
    • Japan
      • Pricing Analysis
      • Market Share Analysis, 2024
        • By Product Type
        • By Ingredient Base
        • By Packaging Size
        • By Distribution Channel
    • South Korea
      • Pricing Analysis
      • Market Share Analysis, 2024
        • By Product Type
        • By Ingredient Base
        • By Packaging Size
        • By Distribution Channel
    • India
      • Pricing Analysis
      • Market Share Analysis, 2024
        • By Product Type
        • By Ingredient Base
        • By Packaging Size
        • By Distribution Channel
    • Thailand
      • Pricing Analysis
      • Market Share Analysis, 2024
        • By Product Type
        • By Ingredient Base
        • By Packaging Size
        • By Distribution Channel
    • Malaysia
      • Pricing Analysis
      • Market Share Analysis, 2024
        • By Product Type
        • By Ingredient Base
        • By Packaging Size
        • By Distribution Channel
    • Indonesia
      • Pricing Analysis
      • Market Share Analysis, 2024
        • By Product Type
        • By Ingredient Base
        • By Packaging Size
        • By Distribution Channel
    • Singapore
      • Pricing Analysis
      • Market Share Analysis, 2024
        • By Product Type
        • By Ingredient Base
        • By Packaging Size
        • By Distribution Channel
    • Vietnam
      • Pricing Analysis
      • Market Share Analysis, 2024
        • By Product Type
        • By Ingredient Base
        • By Packaging Size
        • By Distribution Channel
    • Australia
      • Pricing Analysis
      • Market Share Analysis, 2024
        • By Product Type
        • By Ingredient Base
        • By Packaging Size
        • By Distribution Channel
    • New Zealand
      • Pricing Analysis
      • Market Share Analysis, 2024
        • By Product Type
        • By Ingredient Base
        • By Packaging Size
        • By Distribution Channel
    • Rest of South Asia
      • Pricing Analysis
      • Market Share Analysis, 2024
        • By Product Type
        • By Ingredient Base
        • By Packaging Size
        • By Distribution Channel
  17. Market Structure Analysis
    • Competition Dashboard
    • Competition Benchmarking
    • Market Share Analysis of Top Players
      • By Regional
      • By Product Type
      • By Ingredient Base
      • By Packaging Size
      • By Distribution Channel
  18. Competition Analysis
    • Competition Deep Dive
      • Unilever
        • Overview
        • Product Portfolio
        • Profitability by Market Segments (Product/Age /Sales Channel/Region)
        • Sales Footprint
        • Strategy Overview
          • Marketing Strategy
          • Product Strategy
          • Channel Strategy
      • L’Oréal
        • Overview
        • Product Portfolio
        • Profitability by Market Segments (Product/Age /Sales Channel/Region)
        • Sales Footprint
        • Strategy Overview
          • Marketing Strategy
          • Product Strategy
          • Channel Strategy
      • Estée Lauder Companies
        • Overview
        • Product Portfolio
        • Profitability by Market Segments (Product/Age /Sales Channel/Region)
        • Sales Footprint
        • Strategy Overview
          • Marketing Strategy
          • Product Strategy
          • Channel Strategy
      • Shiseido
        • Overview
        • Product Portfolio
        • Profitability by Market Segments (Product/Age /Sales Channel/Region)
        • Sales Footprint
        • Strategy Overview
          • Marketing Strategy
          • Product Strategy
          • Channel Strategy
      • Johnson & Johnson Services, Inc.
        • Overview
        • Product Portfolio
        • Profitability by Market Segments (Product/Age /Sales Channel/Region)
        • Sales Footprint
        • Strategy Overview
          • Marketing Strategy
          • Product Strategy
          • Channel Strategy
      • Cardinal Sprayers
        • Overview
        • Product Portfolio
        • Profitability by Market Segments (Product/Age /Sales Channel/Region)
        • Sales Footprint
        • Strategy Overview
          • Marketing Strategy
          • Product Strategy
          • Channel Strategy
      • Oriflame Cosmetics AG
        • Overview
        • Product Portfolio
        • Profitability by Market Segments (Product/Age /Sales Channel/Region)
        • Sales Footprint
        • Strategy Overview
          • Marketing Strategy
          • Product Strategy
          • Channel Strategy
      • Kao Corporation
        • Overview
        • Product Portfolio
        • Profitability by Market Segments (Product/Age /Sales Channel/Region)
        • Sales Footprint
        • Strategy Overview
          • Marketing Strategy
          • Product Strategy
          • Channel Strategy
      • Procter & Gamble
        • Overview
        • Product Portfolio
        • Profitability by Market Segments (Product/Age /Sales Channel/Region)
        • Sales Footprint
        • Strategy Overview
          • Marketing Strategy
          • Product Strategy
          • Channel Strategy
      • Revlon
        • Overview
        • Product Portfolio
        • Profitability by Market Segments (Product/Age /Sales Channel/Region)
        • Sales Footprint
        • Strategy Overview
          • Marketing Strategy
          • Product Strategy
          • Channel Strategy
      • Eau Thermale Avène
        • Overview
        • Product Portfolio
        • Profitability by Market Segments (Product/Age /Sales Channel/Region)
        • Sales Footprint
        • Strategy Overview
          • Marketing Strategy
          • Product Strategy
          • Channel Strategy
      • Mario Badescu Skin Care Inc.
        • Overview
        • Product Portfolio
        • Profitability by Market Segments (Product/Age /Sales Channel/Region)
        • Sales Footprint
        • Strategy Overview
          • Marketing Strategy
          • Product Strategy
          • Channel Strategy
      • The Nature’s Co.
        • Overview
        • Product Portfolio
        • Profitability by Market Segments (Product/Age /Sales Channel/Region)
        • Sales Footprint
        • Strategy Overview
          • Marketing Strategy
          • Product Strategy
          • Channel Strategy
      • Heritage Store
        • Overview
        • Product Portfolio
        • Profitability by Market Segments (Product/Age /Sales Channel/Region)
        • Sales Footprint
        • Strategy Overview
          • Marketing Strategy
          • Product Strategy
          • Channel Strategy
      • La Roche Posay
        • Overview
        • Product Portfolio
        • Profitability by Market Segments (Product/Age /Sales Channel/Region)
        • Sales Footprint
        • Strategy Overview
          • Marketing Strategy
          • Product Strategy
          • Channel Strategy
  19. Assumptions & Acronyms Used
  20. Research Methodology

List of Tables

  • Table 1: Global Market Value (USD Million) Forecast by Region, 2020-2035
  • Table 2: Global Market Volume (Units) Forecast by Region, 2020-2035
  • Table 3: Global Market Value (USD Million) Forecast by Product Type, 2020-2035
  • Table 4: Global Market Volume (Units) Forecast by Product Type, 2020-2035
  • Table 5: Global Market Value (USD Million) Forecast by Ingredient Base, 2020-2035
  • Table 6: Global Market Volume (Units) Forecast by Ingredient Base, 2020-2035
  • Table 7: Global Market Value (USD Million) Forecast by Packaging Size, 2020-2035
  • Table 8: Global Market Volume (Units) Forecast by Packaging Size, 2020-2035
  • Table 9: Global Market Value (USD Million) Forecast by Distribution Channel, 2020-2035
  • Table 10: Global Market Volume (Units) Forecast by Distribution Channel, 2020-2035
  • Table 11: North America Market Value (USD Million) Forecast by Country, 2020-2035
  • Table 12: North America Market Volume (Units) Forecast by Country, 2020-2035
  • Table 13: North America Market Value (USD Million) Forecast by Product Type, 2020-2035
  • Table 14: North America Market Volume (Units) Forecast by Product Type, 2020-2035
  • Table 15: North America Market Value (USD Million) Forecast by Ingredient Base, 2020-2035
  • Table 16: North America Market Volume (Units) Forecast by Ingredient Base, 2020-2035
  • Table 17: North America Market Value (USD Million) Forecast by Packaging Size, 2020-2035
  • Table 18: North America Market Volume (Units) Forecast by Packaging Size, 2020-2035
  • Table 19: North America Market Value (USD Million) Forecast by Distribution Channel, 2020-2035
  • Table 20: North America Market Volume (Units) Forecast by Distribution Channel, 2020-2035
  • Table 21: Latin America Market Value (USD Million) Forecast by Country, 2020-2035
  • Table 22: Latin America Market Volume (Units) Forecast by Country, 2020-2035
  • Table 23: Latin America Market Value (USD Million) Forecast by Product Type, 2020-2035
  • Table 24: Latin America Market Volume (Units) Forecast by Product Type, 2020-2035
  • Table 25: Latin America Market Value (USD Million) Forecast by Ingredient Base, 2020-2035
  • Table 26: Latin America Market Volume (Units) Forecast by Ingredient Base, 2020-2035
  • Table 27: Latin America Market Value (USD Million) Forecast by Packaging Size, 2020-2035
  • Table 28: Latin America Market Volume (Units) Forecast by Packaging Size, 2020-2035
  • Table 29: Latin America Market Value (USD Million) Forecast by Distribution Channel, 2020-2035
  • Table 30: Latin America Market Volume (Units) Forecast by Distribution Channel, 2020-2035
  • Table 31: Europe Market Value (USD Million) Forecast by Country, 2020-2035
  • Table 32: Europe Market Volume (Units) Forecast by Country, 2020-2035
  • Table 33: Europe Market Value (USD Million) Forecast by Product Type, 2020-2035
  • Table 34: Europe Market Volume (Units) Forecast by Product Type, 2020-2035
  • Table 35: Europe Market Value (USD Million) Forecast by Ingredient Base, 2020-2035
  • Table 36: Europe Market Volume (Units) Forecast by Ingredient Base, 2020-2035
  • Table 37: Europe Market Value (USD Million) Forecast by Packaging Size, 2020-2035
  • Table 38: Europe Market Volume (Units) Forecast by Packaging Size, 2020-2035
  • Table 39: Europe Market Value (USD Million) Forecast by Distribution Channel, 2020-2035
  • Table 40: Europe Market Volume (Units) Forecast by Distribution Channel, 2020-2035
  • Table 41: East Asia Market Value (USD Million) Forecast by Country, 2020-2035
  • Table 42: East Asia Market Volume (Units) Forecast by Country, 2020-2035
  • Table 43: East Asia Market Value (USD Million) Forecast by Product Type, 2020-2035
  • Table 44: East Asia Market Volume (Units) Forecast by Product Type, 2020-2035
  • Table 45: East Asia Market Value (USD Million) Forecast by Ingredient Base, 2020-2035
  • Table 46: East Asia Market Volume (Units) Forecast by Ingredient Base, 2020-2035
  • Table 47: East Asia Market Value (USD Million) Forecast by Packaging Size, 2020-2035
  • Table 48: East Asia Market Volume (Units) Forecast by Packaging Size, 2020-2035
  • Table 49: East Asia Market Value (USD Million) Forecast by Distribution Channel, 2020-2035
  • Table 50: East Asia Market Volume (Units) Forecast by Distribution Channel, 2020-2035
  • Table 51: South Asia & Pacific Market Value (USD Million) Forecast by Country, 2020-2035
  • Table 52: South Asia & Pacific Market Volume (Units) Forecast by Country, 2020-2035
  • Table 53: South Asia & Pacific Market Value (USD Million) Forecast by Product Type, 2020-2035
  • Table 54: South Asia & Pacific Market Volume (Units) Forecast by Product Type, 2020-2035
  • Table 55: South Asia & Pacific Market Value (USD Million) Forecast by Ingredient Base, 2020-2035
  • Table 56: South Asia & Pacific Market Volume (Units) Forecast by Ingredient Base, 2020-2035
  • Table 57: South Asia & Pacific Market Value (USD Million) Forecast by Packaging Size, 2020-2035
  • Table 58: South Asia & Pacific Market Volume (Units) Forecast by Packaging Size, 2020-2035
  • Table 59: South Asia & Pacific Market Value (USD Million) Forecast by Distribution Channel, 2020-2035
  • Table 60: South Asia & Pacific Market Volume (Units) Forecast by Distribution Channel, 2020-2035
  • Table 61: Middle East and Africa Market Value (USD Million) Forecast by Country, 2020-2035
  • Table 62: Middle East and Africa Market Volume (Units) Forecast by Country, 2020-2035
  • Table 63: Middle East and Africa Market Value (USD Million) Forecast by Product Type, 2020-2035
  • Table 64: Middle East and Africa Market Volume (Units) Forecast by Product Type, 2020-2035
  • Table 65: Middle East and Africa Market Value (USD Million) Forecast by Ingredient Base, 2020-2035
  • Table 66: Middle East and Africa Market Volume (Units) Forecast by Ingredient Base, 2020-2035
  • Table 67: Middle East and Africa Market Value (USD Million) Forecast by Packaging Size, 2020-2035
  • Table 68: Middle East and Africa Market Volume (Units) Forecast by Packaging Size, 2020-2035
  • Table 69: Middle East and Africa Market Value (USD Million) Forecast by Distribution Channel, 2020-2035
  • Table 70: Middle East and Africa Market Volume (Units) Forecast by Distribution Channel, 2020-2035

List of Figures

  • Figure 1: Global Market Value (USD Million) by Product Type, 2025-2035
  • Figure 2: Global Market Value (USD Million) by Ingredient Base, 2025-2035
  • Figure 3: Global Market Value (USD Million) by Packaging Size, 2025-2035
  • Figure 4: Global Market Value (USD Million) by Distribution Channel, 2025-2035
  • Figure 5: Global Market Value (USD Million) by Region, 2025-2035
  • Figure 6: Global Market Value (USD Million) Analysis by Region, 2020-2035
  • Figure 7: Global Market Volume (Units) Analysis by Region, 2020-2035
  • Figure 8: Global Market Value Share (%) and BPS Analysis by Region, 2025-2035
  • Figure 9: Global Market Y-o-Y Growth (%) Projections by Region, 2025-2035
  • Figure 10: Global Market Value (USD Million) Analysis by Product Type, 2020-2035
  • Figure 11: Global Market Volume (Units) Analysis by Product Type, 2020-2035
  • Figure 12: Global Market Value Share (%) and BPS Analysis by Product Type, 2025-2035
  • Figure 13: Global Market Y-o-Y Growth (%) Projections by Product Type, 2025-2035
  • Figure 14: Global Market Value (USD Million) Analysis by Ingredient Base, 2020-2035
  • Figure 15: Global Market Volume (Units) Analysis by Ingredient Base, 2020-2035
  • Figure 16: Global Market Value Share (%) and BPS Analysis by Ingredient Base, 2025-2035
  • Figure 17: Global Market Y-o-Y Growth (%) Projections by Ingredient Base, 2025-2035
  • Figure 18: Global Market Value (USD Million) Analysis by Packaging Size, 2020-2035
  • Figure 19: Global Market Volume (Units) Analysis by Packaging Size, 2020-2035
  • Figure 20: Global Market Value Share (%) and BPS Analysis by Packaging Size, 2025-2035
  • Figure 21: Global Market Y-o-Y Growth (%) Projections by Packaging Size, 2025-2035
  • Figure 22: Global Market Value (USD Million) Analysis by Distribution Channel, 2020-2035
  • Figure 23: Global Market Volume (Units) Analysis by Distribution Channel, 2020-2035
  • Figure 24: Global Market Value Share (%) and BPS Analysis by Distribution Channel, 2025-2035
  • Figure 25: Global Market Y-o-Y Growth (%) Projections by Distribution Channel, 2025-2035
  • Figure 26: Global Market Attractiveness by Product Type, 2025-2035
  • Figure 27: Global Market Attractiveness by Ingredient Base, 2025-2035
  • Figure 28: Global Market Attractiveness by Packaging Size, 2025-2035
  • Figure 29: Global Market Attractiveness by Distribution Channel, 2025-2035
  • Figure 30: Global Market Attractiveness by Region, 2025-2035
  • Figure 31: North America Market Value (USD Million) by Product Type, 2025-2035
  • Figure 32: North America Market Value (USD Million) by Ingredient Base, 2025-2035
  • Figure 33: North America Market Value (USD Million) by Packaging Size, 2025-2035
  • Figure 34: North America Market Value (USD Million) by Distribution Channel, 2025-2035
  • Figure 35: North America Market Value (USD Million) by Country, 2025-2035
  • Figure 36: North America Market Value (USD Million) Analysis by Country, 2020-2035
  • Figure 37: North America Market Volume (Units) Analysis by Country, 2020-2035
  • Figure 38: North America Market Value Share (%) and BPS Analysis by Country, 2025-2035
  • Figure 39: North America Market Y-o-Y Growth (%) Projections by Country, 2025-2035
  • Figure 40: North America Market Value (USD Million) Analysis by Product Type, 2020-2035
  • Figure 41: North America Market Volume (Units) Analysis by Product Type, 2020-2035
  • Figure 42: North America Market Value Share (%) and BPS Analysis by Product Type, 2025-2035
  • Figure 43: North America Market Y-o-Y Growth (%) Projections by Product Type, 2025-2035
  • Figure 44: North America Market Value (USD Million) Analysis by Ingredient Base, 2020-2035
  • Figure 45: North America Market Volume (Units) Analysis by Ingredient Base, 2020-2035
  • Figure 46: North America Market Value Share (%) and BPS Analysis by Ingredient Base, 2025-2035
  • Figure 47: North America Market Y-o-Y Growth (%) Projections by Ingredient Base, 2025-2035
  • Figure 48: North America Market Value (USD Million) Analysis by Packaging Size, 2020-2035
  • Figure 49: North America Market Volume (Units) Analysis by Packaging Size, 2020-2035
  • Figure 50: North America Market Value Share (%) and BPS Analysis by Packaging Size, 2025-2035
  • Figure 51: North America Market Y-o-Y Growth (%) Projections by Packaging Size, 2025-2035
  • Figure 52: North America Market Value (USD Million) Analysis by Distribution Channel, 2020-2035
  • Figure 53: North America Market Volume (Units) Analysis by Distribution Channel, 2020-2035
  • Figure 54: North America Market Value Share (%) and BPS Analysis by Distribution Channel, 2025-2035
  • Figure 55: North America Market Y-o-Y Growth (%) Projections by Distribution Channel, 2025-2035
  • Figure 56: North America Market Attractiveness by Product Type, 2025-2035
  • Figure 57: North America Market Attractiveness by Ingredient Base, 2025-2035
  • Figure 58: North America Market Attractiveness by Packaging Size, 2025-2035
  • Figure 59: North America Market Attractiveness by Distribution Channel, 2025-2035
  • Figure 60: North America Market Attractiveness by Country, 2025-2035
  • Figure 61: Latin America Market Value (USD Million) by Product Type, 2025-2035
  • Figure 62: Latin America Market Value (USD Million) by Ingredient Base, 2025-2035
  • Figure 63: Latin America Market Value (USD Million) by Packaging Size, 2025-2035
  • Figure 64: Latin America Market Value (USD Million) by Distribution Channel, 2025-2035
  • Figure 65: Latin America Market Value (USD Million) by Country, 2025-2035
  • Figure 66: Latin America Market Value (USD Million) Analysis by Country, 2020-2035
  • Figure 67: Latin America Market Volume (Units) Analysis by Country, 2020-2035
  • Figure 68: Latin America Market Value Share (%) and BPS Analysis by Country, 2025-2035
  • Figure 69: Latin America Market Y-o-Y Growth (%) Projections by Country, 2025-2035
  • Figure 70: Latin America Market Value (USD Million) Analysis by Product Type, 2020-2035
  • Figure 71: Latin America Market Volume (Units) Analysis by Product Type, 2020-2035
  • Figure 72: Latin America Market Value Share (%) and BPS Analysis by Product Type, 2025-2035
  • Figure 73: Latin America Market Y-o-Y Growth (%) Projections by Product Type, 2025-2035
  • Figure 74: Latin America Market Value (USD Million) Analysis by Ingredient Base, 2020-2035
  • Figure 75: Latin America Market Volume (Units) Analysis by Ingredient Base, 2020-2035
  • Figure 76: Latin America Market Value Share (%) and BPS Analysis by Ingredient Base, 2025-2035
  • Figure 77: Latin America Market Y-o-Y Growth (%) Projections by Ingredient Base, 2025-2035
  • Figure 78: Latin America Market Value (USD Million) Analysis by Packaging Size, 2020-2035
  • Figure 79: Latin America Market Volume (Units) Analysis by Packaging Size, 2020-2035
  • Figure 80: Latin America Market Value Share (%) and BPS Analysis by Packaging Size, 2025-2035
  • Figure 81: Latin America Market Y-o-Y Growth (%) Projections by Packaging Size, 2025-2035
  • Figure 82: Latin America Market Value (USD Million) Analysis by Distribution Channel, 2020-2035
  • Figure 83: Latin America Market Volume (Units) Analysis by Distribution Channel, 2020-2035
  • Figure 84: Latin America Market Value Share (%) and BPS Analysis by Distribution Channel, 2025-2035
  • Figure 85: Latin America Market Y-o-Y Growth (%) Projections by Distribution Channel, 2025-2035
  • Figure 86: Latin America Market Attractiveness by Product Type, 2025-2035
  • Figure 87: Latin America Market Attractiveness by Ingredient Base, 2025-2035
  • Figure 88: Latin America Market Attractiveness by Packaging Size, 2025-2035
  • Figure 89: Latin America Market Attractiveness by Distribution Channel, 2025-2035
  • Figure 90: Latin America Market Attractiveness by Country, 2025-2035
  • Figure 91: Europe Market Value (USD Million) by Product Type, 2025-2035
  • Figure 92: Europe Market Value (USD Million) by Ingredient Base, 2025-2035
  • Figure 93: Europe Market Value (USD Million) by Packaging Size, 2025-2035
  • Figure 94: Europe Market Value (USD Million) by Distribution Channel, 2025-2035
  • Figure 95: Europe Market Value (USD Million) by Country, 2025-2035
  • Figure 96: Europe Market Value (USD Million) Analysis by Country, 2020-2035
  • Figure 97: Europe Market Volume (Units) Analysis by Country, 2020-2035
  • Figure 98: Europe Market Value Share (%) and BPS Analysis by Country, 2025-2035
  • Figure 99: Europe Market Y-o-Y Growth (%) Projections by Country, 2025-2035
  • Figure 100: Europe Market Value (USD Million) Analysis by Product Type, 2020-2035
  • Figure 101: Europe Market Volume (Units) Analysis by Product Type, 2020-2035
  • Figure 102: Europe Market Value Share (%) and BPS Analysis by Product Type, 2025-2035
  • Figure 103: Europe Market Y-o-Y Growth (%) Projections by Product Type, 2025-2035
  • Figure 104: Europe Market Value (USD Million) Analysis by Ingredient Base, 2020-2035
  • Figure 105: Europe Market Volume (Units) Analysis by Ingredient Base, 2020-2035
  • Figure 106: Europe Market Value Share (%) and BPS Analysis by Ingredient Base, 2025-2035
  • Figure 107: Europe Market Y-o-Y Growth (%) Projections by Ingredient Base, 2025-2035
  • Figure 108: Europe Market Value (USD Million) Analysis by Packaging Size, 2020-2035
  • Figure 109: Europe Market Volume (Units) Analysis by Packaging Size, 2020-2035
  • Figure 110: Europe Market Value Share (%) and BPS Analysis by Packaging Size, 2025-2035
  • Figure 111: Europe Market Y-o-Y Growth (%) Projections by Packaging Size, 2025-2035
  • Figure 112: Europe Market Value (USD Million) Analysis by Distribution Channel, 2020-2035
  • Figure 113: Europe Market Volume (Units) Analysis by Distribution Channel, 2020-2035
  • Figure 114: Europe Market Value Share (%) and BPS Analysis by Distribution Channel, 2025-2035
  • Figure 115: Europe Market Y-o-Y Growth (%) Projections by Distribution Channel, 2025-2035
  • Figure 116: Europe Market Attractiveness by Product Type, 2025-2035
  • Figure 117: Europe Market Attractiveness by Ingredient Base, 2025-2035
  • Figure 118: Europe Market Attractiveness by Packaging Size, 2025-2035
  • Figure 119: Europe Market Attractiveness by Distribution Channel, 2025-2035
  • Figure 120: Europe Market Attractiveness by Country, 2025-2035
  • Figure 121: East Asia Market Value (USD Million) by Product Type, 2025-2035
  • Figure 122: East Asia Market Value (USD Million) by Ingredient Base, 2025-2035
  • Figure 123: East Asia Market Value (USD Million) by Packaging Size, 2025-2035
  • Figure 124: East Asia Market Value (USD Million) by Distribution Channel, 2025-2035
  • Figure 125: East Asia Market Value (USD Million) by Country, 2025-2035
  • Figure 126: East Asia Market Value (USD Million) Analysis by Country, 2020-2035
  • Figure 127: East Asia Market Volume (Units) Analysis by Country, 2020-2035
  • Figure 128: East Asia Market Value Share (%) and BPS Analysis by Country, 2025-2035
  • Figure 129: East Asia Market Y-o-Y Growth (%) Projections by Country, 2025-2035
  • Figure 130: East Asia Market Value (USD Million) Analysis by Product Type, 2020-2035
  • Figure 131: East Asia Market Volume (Units) Analysis by Product Type, 2020-2035
  • Figure 132: East Asia Market Value Share (%) and BPS Analysis by Product Type, 2025-2035
  • Figure 133: East Asia Market Y-o-Y Growth (%) Projections by Product Type, 2025-2035
  • Figure 134: East Asia Market Value (USD Million) Analysis by Ingredient Base, 2020-2035
  • Figure 135: East Asia Market Volume (Units) Analysis by Ingredient Base, 2020-2035
  • Figure 136: East Asia Market Value Share (%) and BPS Analysis by Ingredient Base, 2025-2035
  • Figure 137: East Asia Market Y-o-Y Growth (%) Projections by Ingredient Base, 2025-2035
  • Figure 138: East Asia Market Value (USD Million) Analysis by Packaging Size, 2020-2035
  • Figure 139: East Asia Market Volume (Units) Analysis by Packaging Size, 2020-2035
  • Figure 140: East Asia Market Value Share (%) and BPS Analysis by Packaging Size, 2025-2035
  • Figure 141: East Asia Market Y-o-Y Growth (%) Projections by Packaging Size, 2025-2035
  • Figure 142: East Asia Market Value (USD Million) Analysis by Distribution Channel, 2020-2035
  • Figure 143: East Asia Market Volume (Units) Analysis by Distribution Channel, 2020-2035
  • Figure 144: East Asia Market Value Share (%) and BPS Analysis by Distribution Channel, 2025-2035
  • Figure 145: East Asia Market Y-o-Y Growth (%) Projections by Distribution Channel, 2025-2035
  • Figure 146: East Asia Market Attractiveness by Product Type, 2025-2035
  • Figure 147: East Asia Market Attractiveness by Ingredient Base, 2025-2035
  • Figure 148: East Asia Market Attractiveness by Packaging Size, 2025-2035
  • Figure 149: East Asia Market Attractiveness by Distribution Channel, 2025-2035
  • Figure 150: East Asia Market Attractiveness by Country, 2025-2035
  • Figure 151: South Asia & Pacific Market Value (USD Million) by Product Type, 2025-2035
  • Figure 152: South Asia & Pacific Market Value (USD Million) by Ingredient Base, 2025-2035
  • Figure 153: South Asia & Pacific Market Value (USD Million) by Packaging Size, 2025-2035
  • Figure 154: South Asia & Pacific Market Value (USD Million) by Distribution Channel, 2025-2035
  • Figure 155: South Asia & Pacific Market Value (USD Million) by Country, 2025-2035
  • Figure 156: South Asia & Pacific Market Value (USD Million) Analysis by Country, 2020-2035
  • Figure 157: South Asia & Pacific Market Volume (Units) Analysis by Country, 2020-2035
  • Figure 158: South Asia & Pacific Market Value Share (%) and BPS Analysis by Country, 2025-2035
  • Figure 159: South Asia & Pacific Market Y-o-Y Growth (%) Projections by Country, 2025-2035
  • Figure 160: South Asia & Pacific Market Value (USD Million) Analysis by Product Type, 2020-2035
  • Figure 161: South Asia & Pacific Market Volume (Units) Analysis by Product Type, 2020-2035
  • Figure 162: South Asia & Pacific Market Value Share (%) and BPS Analysis by Product Type, 2025-2035
  • Figure 163: South Asia & Pacific Market Y-o-Y Growth (%) Projections by Product Type, 2025-2035
  • Figure 164: South Asia & Pacific Market Value (USD Million) Analysis by Ingredient Base, 2020-2035
  • Figure 165: South Asia & Pacific Market Volume (Units) Analysis by Ingredient Base, 2020-2035
  • Figure 166: South Asia & Pacific Market Value Share (%) and BPS Analysis by Ingredient Base, 2025-2035
  • Figure 167: South Asia & Pacific Market Y-o-Y Growth (%) Projections by Ingredient Base, 2025-2035
  • Figure 168: South Asia & Pacific Market Value (USD Million) Analysis by Packaging Size, 2020-2035
  • Figure 169: South Asia & Pacific Market Volume (Units) Analysis by Packaging Size, 2020-2035
  • Figure 170: South Asia & Pacific Market Value Share (%) and BPS Analysis by Packaging Size, 2025-2035
  • Figure 171: South Asia & Pacific Market Y-o-Y Growth (%) Projections by Packaging Size, 2025-2035
  • Figure 172: South Asia & Pacific Market Value (USD Million) Analysis by Distribution Channel, 2020-2035
  • Figure 173: South Asia & Pacific Market Volume (Units) Analysis by Distribution Channel, 2020-2035
  • Figure 174: South Asia & Pacific Market Value Share (%) and BPS Analysis by Distribution Channel, 2025-2035
  • Figure 175: South Asia & Pacific Market Y-o-Y Growth (%) Projections by Distribution Channel, 2025-2035
  • Figure 176: South Asia & Pacific Market Attractiveness by Product Type, 2025-2035
  • Figure 177: South Asia & Pacific Market Attractiveness by Ingredient Base, 2025-2035
  • Figure 178: South Asia & Pacific Market Attractiveness by Packaging Size, 2025-2035
  • Figure 179: South Asia & Pacific Market Attractiveness by Distribution Channel, 2025-2035
  • Figure 180: South Asia & Pacific Market Attractiveness by Country, 2025-2035
  • Figure 181: Middle East and Africa Market Value (USD Million) by Product Type, 2025-2035
  • Figure 182: Middle East and Africa Market Value (USD Million) by Ingredient Base, 2025-2035
  • Figure 183: Middle East and Africa Market Value (USD Million) by Packaging Size, 2025-2035
  • Figure 184: Middle East and Africa Market Value (USD Million) by Distribution Channel, 2025-2035
  • Figure 185: Middle East and Africa Market Value (USD Million) by Country, 2025-2035
  • Figure 186: Middle East and Africa Market Value (USD Million) Analysis by Country, 2020-2035
  • Figure 187: Middle East and Africa Market Volume (Units) Analysis by Country, 2020-2035
  • Figure 188: Middle East and Africa Market Value Share (%) and BPS Analysis by Country, 2025-2035
  • Figure 189: Middle East and Africa Market Y-o-Y Growth (%) Projections by Country, 2025-2035
  • Figure 190: Middle East and Africa Market Value (USD Million) Analysis by Product Type, 2020-2035
  • Figure 191: Middle East and Africa Market Volume (Units) Analysis by Product Type, 2020-2035
  • Figure 192: Middle East and Africa Market Value Share (%) and BPS Analysis by Product Type, 2025-2035
  • Figure 193: Middle East and Africa Market Y-o-Y Growth (%) Projections by Product Type, 2025-2035
  • Figure 194: Middle East and Africa Market Value (USD Million) Analysis by Ingredient Base, 2020-2035
  • Figure 195: Middle East and Africa Market Volume (Units) Analysis by Ingredient Base, 2020-2035
  • Figure 196: Middle East and Africa Market Value Share (%) and BPS Analysis by Ingredient Base, 2025-2035
  • Figure 197: Middle East and Africa Market Y-o-Y Growth (%) Projections by Ingredient Base, 2025-2035
  • Figure 198: Middle East and Africa Market Value (USD Million) Analysis by Packaging Size, 2020-2035
  • Figure 199: Middle East and Africa Market Volume (Units) Analysis by Packaging Size, 2020-2035
  • Figure 200: Middle East and Africa Market Value Share (%) and BPS Analysis by Packaging Size, 2025-2035
  • Figure 201: Middle East and Africa Market Y-o-Y Growth (%) Projections by Packaging Size, 2025-2035
  • Figure 202: Middle East and Africa Market Value (USD Million) Analysis by Distribution Channel, 2020-2035
  • Figure 203: Middle East and Africa Market Volume (Units) Analysis by Distribution Channel, 2020-2035
  • Figure 204: Middle East and Africa Market Value Share (%) and BPS Analysis by Distribution Channel, 2025-2035
  • Figure 205: Middle East and Africa Market Y-o-Y Growth (%) Projections by Distribution Channel, 2025-2035
  • Figure 206: Middle East and Africa Market Attractiveness by Product Type, 2025-2035
  • Figure 207: Middle East and Africa Market Attractiveness by Ingredient Base, 2025-2035
  • Figure 208: Middle East and Africa Market Attractiveness by Packaging Size, 2025-2035
  • Figure 209: Middle East and Africa Market Attractiveness by Distribution Channel, 2025-2035
  • Figure 210: Middle East and Africa Market Attractiveness by Country, 2025-2035

Frequently Asked Questions

How big is the Hydrating Spray Market in 2025?

The global Hydrating Spray Market is estimated to be valued at USD 5,291.3 million in 2025.

What will be the size of the Hydrating Spray Market in 2035?

The market size for the global Hydrating Spray Market is projected to reach USD 9,642.1 million by 2035.

How much will the Hydrating Spray Market grow between 2025 and 2035?

The global Hydrating Spray Market is expected to grow at a CAGR of 6.2% between 2025 and 2035.

What are the key product types in the Hydrating Spray Market?

The key product types in the Hydrating Spray Market are Facial Hydrating Sprays, Body Hydrating Sprays, Hair Hydrating Sprays, and Multi-Purpose Hydrating Sprays.

Which product type will contribute the most in 2025?

In terms of product type, Facial Hydrating Sprays will command the largest share in 2025, contributing 64.1% of global sales.

Which ingredient base is leading in 2025?

In 2025, Others (including botanical extract-based, vitamin-enriched, SPF-based) collectively account for 60.6% of the market, while Water-Based formulations hold a 39.4% share.

What packaging size holds the highest share in 2025?

100-200 ml bottles dominate the market in 2025, with a 48.3% share of global sales.

Which distribution channels are prominent in the Hydrating Spray Market?

Both offline channels (such as supermarkets, salons, and pharmacies) and online platforms (including e-commerce marketplaces and brand-owned websites) are key contributors, with rising traction for subscription-based D2C models.

Explore Similar Insights

Future Market Insights

Hydrating Spray Market