The Indigenous Tourism Market is estimated to be valued at USD 46.7 billion in 2025 and is projected to reach USD 68.4 billion by 2035, registering a compound annual growth rate (CAGR) of 3.9% over the forecast period.
The Indigenous Tourism market is experiencing substantial growth driven by the increasing interest in culturally immersive travel experiences and authentic local interactions. The future outlook of this market is shaped by the rising preference for sustainable and experience-oriented tourism that highlights indigenous heritage, traditions, and culinary practices.
Travelers are increasingly seeking personalized and unique journeys that allow them to connect with local communities while supporting their economic and cultural sustainability. The growth is further supported by the development of infrastructure in remote and heritage-rich regions, combined with digital platforms that simplify access to indigenous tourism experiences.
Additionally, government initiatives and private sector investments promoting cultural preservation and eco-friendly tourism practices are encouraging the expansion of this market As the global population continues to seek meaningful travel experiences beyond conventional destinations, the Indigenous Tourism market is expected to witness steady adoption and increased revenue opportunities, particularly in regions where cultural heritage and community-led experiences are actively promoted.
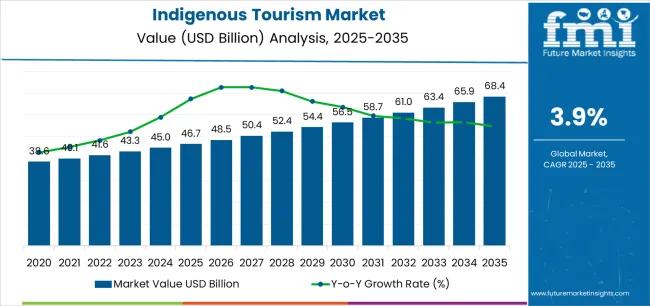
| Metric | Value |
|---|---|
| Indigenous Tourism Market Estimated Value in (2025 E) | USD 46.7 billion |
| Indigenous Tourism Market Forecast Value in (2035 F) | USD 68.4 billion |
| Forecast CAGR (2025 to 2035) | 3.9% |
The market is segmented by Traveller, Activity Type, and Tourism Theme and region. By Traveller, the market is divided into Solo and Group. In terms of Activity Type, the market is classified into Festivals and Rituals. Based on Tourism Theme, the market is segmented into Ethnic Food Items, Herbal Medicines, and Handicrafts. Regionally, the market is classified into North America, Latin America, Western Europe, Eastern Europe, Balkan & Baltic Countries, Russia & Belarus, Central Asia, East Asia, South Asia & Pacific, and the Middle East & Africa.
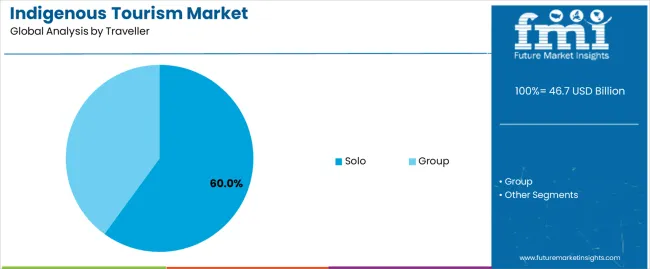
The solo traveler segment is projected to hold 60.00% of the Indigenous Tourism market revenue share in 2025, making it the leading traveler type. This growth is driven by the rising desire for independent, flexible, and self-curated travel experiences.
Solo travelers are increasingly motivated by the opportunity to explore authentic cultural experiences at their own pace while engaging directly with local communities. The availability of guided activities, safety measures, and digital booking platforms has further encouraged the adoption of solo travel in indigenous tourism.
Additionally, this segment benefits from social media and travel communities that share experiences, tips, and itineraries, enhancing the appeal of solo journeys The freedom to personalize travel plans and immerse in culturally rich environments has reinforced the dominance of the solo traveler segment.
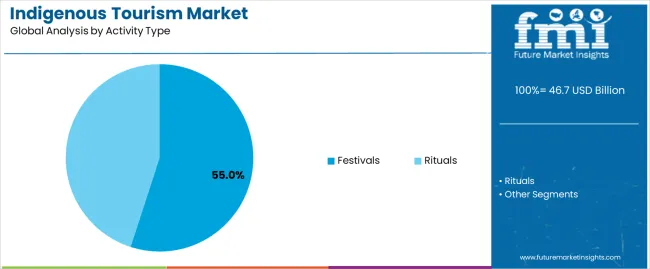
The festivals activity segment is expected to capture 55.00% of the Indigenous Tourism market revenue share in 2025, positioning it as the leading activity type. The growth of this segment is influenced by the increasing interest in experiencing indigenous ceremonies, rituals, and seasonal celebrations.
Festivals offer visitors immersive opportunities to engage with traditional performances, music, dance, and local crafts, providing unique cultural insights. The prominence of this segment is further supported by organized cultural tourism programs, accessibility improvements, and the promotion of festival tourism as a key attraction for travelers seeking authentic experiences.
The interactive and participatory nature of festival-based tourism continues to drive its adoption, reinforcing its leading position in the market.
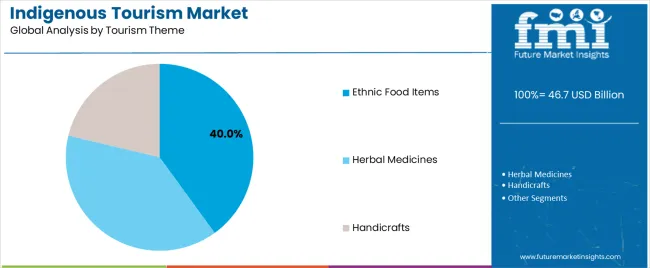
The ethnic food items tourism theme segment is anticipated to account for 40.00% of the Indigenous Tourism market revenue in 2025, making it the leading theme. The growth of this segment is fueled by the rising demand for culinary tourism, where travelers actively seek authentic indigenous cuisine and traditional cooking experiences.
The popularity of ethnic food experiences is enhanced by the integration of food-related activities such as cooking classes, tastings, and market visits that allow immersive cultural learning. Additionally, the growing awareness of sustainable food practices, local sourcing, and traditional preparation methods has increased interest in indigenous food tourism.
As visitors increasingly prioritize experiential travel and seek connections with local culture through cuisine, this theme continues to drive significant market revenue.
Indigenous-led Tours and Experiences Tours Guarantee of the Authentic Cultural Encounters
Indigenous persons will be the focal point in the tourism business by offering an unforgettable experience that exposes their historical culture. With indigenous-run initiatives for the journey, travelers acquire real awareness regarding the traditional practices, storytelling, and ceremonies, which create an exchange of cultures and generate indigenous advancement and economic growth.
Indigenous Community-led Tourism Partnerships are the Main Driver of Market Growth
The cooperation between indigenous peoples and tourist operators drives the scope of the indigenous tourism market in terms of growth. Local knowledge, resources, and talent is harnessed in these collaborations to create one-of-a-kind tourism products and experiences that entrench different audiences thus attracting healthy market growth and cross-cultural understanding and appreciation.
Indigenous Tourism is Centred on Education and Cultural Exchange resulting in Community Empowerment
Indigenous tourism projects are aimed at education and cultural exchange, through which the communities are given a chance to present their heritage and traditions that shape this world. Through providing educational and cultural workshops and programs like cultural immersion, indigenous tourism promotes intercultural dialogue, mutual respect, and social empowerment, thus contributing to the social impact and market growth of indigenous communities.
Cultural realness and Ethical Tourism Principles give shape to Indigenous Tourism Experiences
In indigenous tourism, authenticity and ethics are of primary importance and it is here that the indigenous tourism experiences differ greatly from the conventional tourism offerings. Ethical tourism initiatives emphasis respect for indigenous cultures, traditions, and land rights with responsible travel behavior, environmental conservation, and community well-being, leading to the shaping of market trends and traveler preferences.
Indigenous Tourism Extends Beyond the Conventional Travel Spots, Presenting Unique Cultural Identities
The indigenous tourism enterprises have encouraged the diversification of the destinations beyond the usual areas, and they have also showcased the diversity of indigenous cultures and identities worldwide.
Through the promotion of the indigenous communities that are not known by many and the heritage sites the market makes it possible for travelers to widen their perspective beyond the usual indigenous traditions, languages, and customs leading to cultural appreciation and sustainable tourism development.
| Segment | Estimated Market Share in 2025 |
|---|---|
| Group | 72.60% |
| Festivals | 67.10% |
Indigenous tourism has a distinctive strategy in the field of group travel, accounting for an impressive market share of 72.60% in the perspective of 2025. This emphasis is thought to be the result of several elements. Indigenous guided tours undoubtedly make an excellent option for travelers who want to share the culture of the place and learn its history.
On the other hand, group travel can also give a feeling of community and common experience to the participants, which may lead to a closer bond with indigenous people and their cultures.
In addition, providing a place for different groups ensures that the indigenous communities can manage the number of visitors better, creating a more sustainable and responsible tourism experience. With the indigenous tourist market becoming increasingly popular, the ability to serve groups continues to be an important factor in the success of the business.
Indigenous carnivals, with colorful cultural parades and traditional games that attract tourists, take the lion's share of the market, equal to a striking 67.10% in 2025. Such festivals provide visitors a chance to experience indigenous cultures in a very real way through music, dances, narratives, and presentations about the traditional handiwork. On the other hand, festival tourism can also be a powerful economic force for the indigenous communities.
Traditional fees, craft sales, and overall tourism activity can all concur to create a significant revenue stream for these communities. Cultural preservation is an unchanging core of indigenous tourism, therefore festivals seem to be going to remain a paramount attraction attracting visitors and building intercultural understanding in the indigenous tourism niche.
| Country | United States |
|---|---|
| CAGR till 2035 | 2.00% |
The USA domestic indigenous tourism market with its diverse culture of the natives is set to observe a 2.00% CAGR till 2035. There is already a strong awareness as well as existing attractions for indigenous groups that cater to the needs of a particular segment of society.
On the same note, other tourism experiences with a more saturated market also pose a challenge. Indigenous tourism in the USA will do well if it gives the spotlight to innovation and native offerings. The consumption of responsible travel and cultural immersion is gaining momentum and is a good thing.
Indian communities could engage with visitors in an authentic way that promotes cultural exchange and education, and this could be done without traditional tourist attractions. Such an approach to tourism guarantees that indigenous cultures and traditions remain vibrant and alive as well as assists in the economic growth of such communities.
| Country | Australia |
|---|---|
| CAGR till 2035 | 3.60% |
The indigenous tourism market in Australia is booming, and it is anticipated that it will grow by 3.6% CAGR through 2035. This interest is growing day by day among Aboriginal culture admirers, especially young people. Public policies and subsidies that give indigenous tourism a boost and better connectivity to the isolated locales are among the factors that boost this growth.
However, challenges remain. Tourism activities may result in increased visitor traffic and the delicate ecosystems may be affected adversely thus requiring careful consideration. Also, the sharing of the benefits of tourism activities directly with the local indigenous communities must be considered.
Struggling to strike a balance between ‘cultural conservation’ and ‘economic development’ will be the key to the long-term success of indigenous tourism in Australia. Such partnerships, for instance, can be established among the native communities, tourism operators, and governmental agencies that will guarantee green practices and equitable distribution of the benefits.
| Country | Germany |
|---|---|
| CAGR till 2035 | 2.40% |
Indigenous tourism in Germany, growing at a CAGR of 2.40% until 2035, is steered towards cultural appreciation. This careful pace may indicate the heritage evoked by museums, educational programs, and niche travel experiences is already in place.
On the other hand, Germany does not have an advanced culture with a more significant indigenous background like some of the other developed economies do, so its indigenous tourism landscape may be less known. This clearly shows the possibility for specific tour operators that mainly focus on cultural immersion that could be used to show how diverse the nation of Germany is.
| Country | China |
|---|---|
| CAGR till 2035 | 7.90% |
China’s indigenous tourism market is very likely to display a CAGR of 7.90 % until 2035. This spike in traffic is driven by several factors that come together. China is a country with a multitude of indigenous cultures as well as an increasingly large middle class, which has an increasing disposable income.
Bearing in mind this is the time when adventurous travelers, especially the young ones, become interested in experiencing new things, this creates a good basis for indigenous tourism. Preserving the originality of events and cultivating appreciation of distinct cultural traditions will be very important for the program's success in the future.
Collaboration by government agencies, indigenous communities, and tourism operators according to responsible development ideas is a guarantee of the preservation of the indigenous heritage of China which is so unique.
| Country | India |
|---|---|
| CAGR till 2035 | 8.60% |
India's indigenous tourism market, estimated to show a CAGR of 8.60% until 2035, is the most dynamic market among the analyzed countries. This could be explained by the fact that India is a multicultural country, has a great diversity of natural landscapes, and is experiencing a growth of domestic tourism.
Also, government policies promoting sustainable tourism and increased awareness of ethical tourism are providing an ideal stage for indigenous tourism to thrive. Nonetheless, the infrastructural development in the remote areas and cultural sensitivity within the tourism sector should be taken into account as well.
Through community-based tourism approaches and by encouraging responsible travel, India can exploit the great potential of its indigenous tourism market and promote economic development for indigenous communities while safeguarding their most valuable cultural assets.
Indigenous tourism is currently experiencing a wave of vivacious startups that are actively pursuing the mission to provide visitors with the idea of the indigenous community. Such youth firms started to go beyond standard tour packages and provide an immersive experience that can sustain cultural interchange and responsible tourism operational processes.
One of the most effective methods for startups is building community-minded tourism models as a focal point. They are developing new online platforms linking tourists directly with indigenous communities, which allows them to book traditional homestays, take part in ceremonies, and learn native skills with their help.
Apart from that, startups are producing educational apps and virtual reality experiences presenting the indigenous culture and heritage which leads a thoughtful observation and respect among possible visitors. Consequently, responsible travel and community empowerment that are the key factors make sure that indigenous tourism will be sustainable in the long term, and the indigenous communities will be able to take ownership of their cultural narrative.
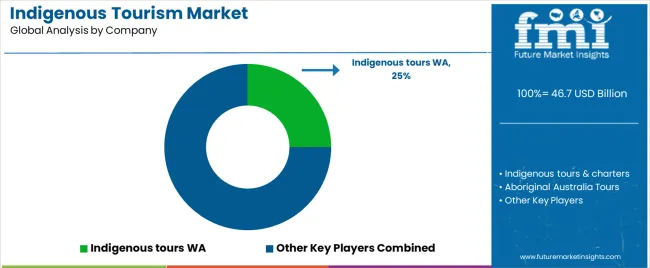
The Indigenous tourism market has some significant players like Voyages Indigenous Tourism Australia, Indigenous Walks, and Indigenous Tourism British Columbia who are the ones to determine the modern landscape with their unique propositions and sustainable practices.
Whether it is the cultural immersion that Voyages Indigenous Tourism Australia offers with the newly launched Wintjiri Wiru storytelling experience at Uluru or the captivating outback journeys, it is a must-visit destination for any traveler.
On the other side, Walks in British Columbia's Indigenous focus is geared towards the joint development of inventive tourism structuring that enables Indigenous communities to build self-reliance and offer authentic cultural experiences. Moreover, Indigenous Tourism British Columbia is a strategic organization driving Indigenous-owned business development and networking to provide wider exposure to Indigenous tourism experiences in the territory.
These key players are not only the leading force in the development of the Indigenous tourism market but also the main concern for cultural preservation and environmental care. The tour operators accomplish this objective when they go about their tourism responsibly and work together with Indigenous communities to make sure that the economic benefits of tourism go to local communities and that Indigenous cultures are preserved.
Next, these players take advantage of technology and digital platforms to spread their message to a greater number of people and to make the tourism experience more available and inviting for everyone. Going forward, the critical role of the above-mentioned stakeholders is expected as they will shape the future direction of the indigenous tourism market and drive sustainable development within the industry.
Recent Developments in the Industry
The global indigenous tourism market is estimated to be valued at USD 46.7 billion in 2025.
The market size for the indigenous tourism market is projected to reach USD 68.4 billion by 2035.
The indigenous tourism market is expected to grow at a 3.9% CAGR between 2025 and 2035.
The key product types in indigenous tourism market are solo and group.
In terms of activity type, festivals segment to command 55.0% share in the indigenous tourism market in 2025.


Full Research Suite comprises of:
Market outlook & trends analysis
Interviews & case studies
Strategic recommendations
Vendor profiles & capabilities analysis
5-year forecasts
8 regions and 60+ country-level data splits
Market segment data splits
12 months of continuous data updates
DELIVERED AS:
PDF EXCEL ONLINE
Tourism Independent Contractor Model Market Size and Share Forecast Outlook 2025 to 2035
Tourism Industry Analysis in Japan - Size, Share, & Forecast Outlook 2025 to 2035
Tourism Market Trends – Growth & Forecast 2025 to 2035
Tourism Industry Big Data Analytics Market Analysis by Application, by End, by Region – Forecast for 2025 to 2035
Assessing Tourism Industry Loyalty Program Market Share & Industry Trends
Tourism Industry Loyalty Programs Sector Analysis by Program Type by Traveler Profile by Region - Forecast for 2025 to 2035
Market Share Insights of Tourism Security Service Providers
Tourism Security Market Analysis by Service Type, by End User, and by Region – Forecast for 2025 to 2035
Competitive Overview of Geotourism Market Share
Geotourism Market Insights - Growth & Trends 2025 to 2035
Global Ecotourism Market Insights – Growth & Demand 2025–2035
Art Tourism Market Analysis by, by Service Category, by End, by Booking Channel by Region Forecast: 2025 to 2035
Analyzing War Tourism Market Share & Industry Leaders
War Tourism Market Insights - Size, Trends & Forecast 2025 to 2035
Agritourism Market Growth – Forecast 2024-2034
Food Tourism Sector Market Size and Share Forecast Outlook 2025 to 2035
Wine Tourism Market Analysis - Size, Share, and Forecast Outlook 2025 to 2035
Film Tourism Industry Analysis by Type, by End User, by Tourist Type, by Booking Channel, and by Region - Forecast for 2025 to 2035
Market Share Breakdown of Wine Tourism Manufacturers
Golf Tourism Market Analysis - Size, Share, and Forecast 2025 to 2035

Thank you!
You will receive an email from our Business Development Manager. Please be sure to check your SPAM/JUNK folder too.
Chat With
MaRIA