

- Market Size (2026)
- USD 1362.8 Mn
- Forecast (2036)
- USD 3975.3 Mn
- CAGR (2026 to 2036)
- 11.3%
How big is kidney transplant rejection biomarker market size?
USD 1,362.8 million in 2026 and USD 3,975.3 million by 2036 at an 11.3% CAGR.
Sales for kidney transplant rejection biomarkers sector is projected to expand at 11.3% CAGR between 2026 and 2036, increasing valuation from USD 1,362.8 million in 2026 to USD 3,975.3 million by 2036. Physicians increasingly rely on regular blood and urine tests to detect graft injury early. Such frequent liquid biopsy tests integrate seamlessly into established diagnostic pathways. Strong scientific evidence now backs this non-invasive testing approach. Nature Medicine published a June 2024 study covering 2,882 recipients across 14 centers. This comprehensive data builds immense confidence for using liquid biopsies during specialist kidney-transplant surveillance. Resulting with hospitals to likely accelerate their clinical adoption of such helpful diagnostic tools.
Different medical systems prioritize specific features on evaluating new biomarker tests. United States and Germany transplant programs favor multicenter validation and repeat-test consistency. Such western institutions also demand responsive laboratory support during their assay review. Japan and South Korea clinical services emphasize compact sample workflows and local technical access. An extensive global patient population directly drives this worldwide demand for better diagnostic tools. A February 2026 transplantation report counted 110,467 kidney transplants across 90 countries during 2024, illustrating a substantial recipient base requiring structured graft surveillance.
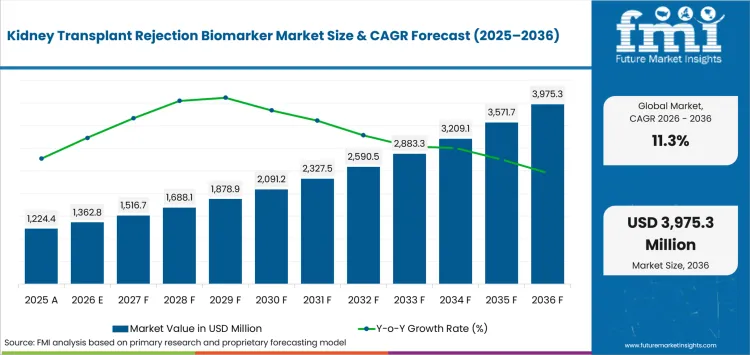
| Metric | Value |
|---|---|
| 2025 Market Size | USD 1,224.4 million |
| 2026 Market Size | USD 1,362.8 million |
| 2036 Market Size | USD 3,975.3 million |
| Forecast CAGR (2026-2036) | 11.3% |
| End User Focus | Transplant Centers (44.0% share in 2026) |
| Application Focus | Acute Rejection Detection (34.0% share in 2026) |
| Technology Focus | Next-Generation Sequencing (NGS) (33.2% share in 2026) |
Summary of Kidney Transplant Rejection Biomarker Market
| Market Signal | Commercial Impact |
|---|---|
| Demand and Growth Drivers | Kidney rejection biomarker selection grows as transplant teams seek measurable evidence prior to irreversible graft injury. Program design reflects clinical utility and clear escalation rules across specialist services.
|
| Product and Segment View | Segment direction is led by transplant centers, followed by acute rejection detection and next-generation sequencing. Specification review is expected to focus on clinical actionability and integration across specialist pathways.
|
| Geography and Growth Outlook | Country movement differs through reimbursement conditions and laboratory readiness. Commercial progress is expected to reflect local validation needs and repeat-testing access across national care systems.
|
| Competitive View | Competition centers on transplant-specific assays and evidence supporting clinical action. Commercial progress favors companies offering dependable sample logistics and specialist education across transplant institutions.
|
| Analyst Perspective | Kidney rejection biomarkers create durable value as measured signals alter biopsy timing and therapy review within repeatable specialist pathways. Company progress is anticipated to reflect laboratory consistency and clinical education across transplant programs.
|
Source: Future Market Insights analysis, 2026.
How is kidney transplant rejection biomarker market segmented?
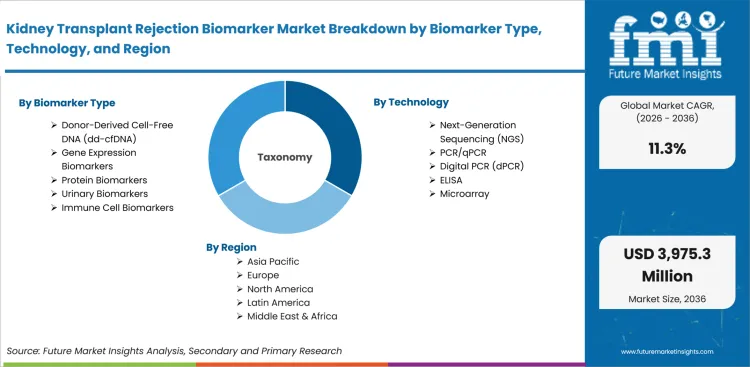
The kidney transplant rejection biomarker industry is segmented by biomarker type, technology, application, end user, and region.
The kidney transplant rejection biomarker industry is segmented by biomarker type, technology, application, end user, and region. Biomarker type coverage includes donor-derived cell-free DNA (dd-cfDNA), gene expression biomarkers, protein biomarkers, urinary biomarkers, and immune cell biomarkers. Technology coverage includes next-generation sequencing (NGS), PCR/qPCR, digital PCR (dPCR), ELISA, and microarray. Application coverage addresses acute rejection detection, chronic rejection monitoring, routine post-transplant surveillance, and immunosuppressive therapy monitoring. End-user coverage spans transplant centers, hospitals, clinical diagnostic laboratories, and academic and research institutes. Regional coverage includes North America, Latin America, Europe, East Asia, South Asia, Oceania, and the Middle East and Africa.
Why does Donor-Derived Cell-Free DNA shape biomarker type selection?
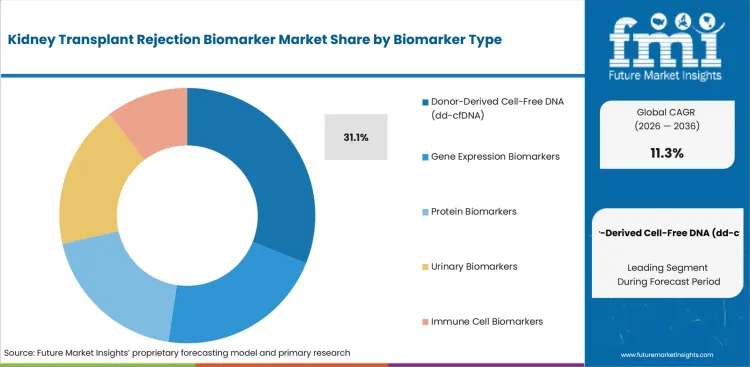
Biomolecules and Biomedicine reported a pooled AUROC of 0.80 for any rejection in a meta-analysis published in February 2024. Clinical interpretation is expected to position dd-cfDNA beside biopsy and standard monitoring during uncertain graft-injury assessment. Blood-based sampling reduces dependence on scheduled tissue collection during routine follow-up. Serial readings help clinicians distinguish stable patterns from changes requiring closer review. Laboratory reports gain utility as thresholds connect directly with biopsy or treatment decisions.
- In 2026, donor-derived cell-free DNA is projected to represent 31.1% share as it is led by blood-based sampling and measurable graft-derived injury across repeat surveillance visits. Transplant specialists position dd-cfDNA within clinical diagnostics pathways linking molecular change with biopsy selection and therapy review.
- Gene expression biomarkers and immune cell biomarkers are anticipated to support complementary evidence across inflammatory activity and tissue-specific injury. Protein-focused programs use one-step ELISA workflows for selected markers requiring familiar laboratory processing and controlled batch comparison.
Why does Next-Generation Sequencing shape technology demand?
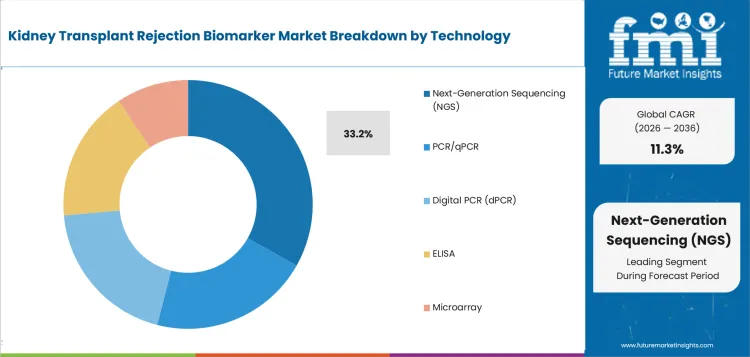
Central laboratories standardize read depth and bioinformatic review across participating programs. Consistent quality controls improve comparison between surveillance visits and for-cause testing. A March 2024 American Journal of Transplantation study evaluated 151 kidney-transplant recipients through a next-generation sequencing blood RNA signature. Findings support advanced molecular readouts within genomics workflows serving transplant assessment beyond conventional renal-function measures. Sequence-based processing supports repeatable donor-recipient discrimination across serial samples.
- Next-generation sequencing is estimated to secure 33.2% share of technology in 2026, guided by scalable donor-recipient discrimination and standardized processing across repeated post-transplant samples. Laboratory teams assess contamination controls and bioinformatic consistency prior to routine surveillance deployment.
- PCR/qPCR and Digital PCR (dPCR) promote targeted quantification across laboratories using real-time PCR systems and validated threshold controls. ELISA and microarray address protein measurement and expression profiling, with DNA microarray methods retaining research utility for multiplex discovery, reflecting target abundance and laboratory throughput.
How does Acute Rejection Detection shape application demand?
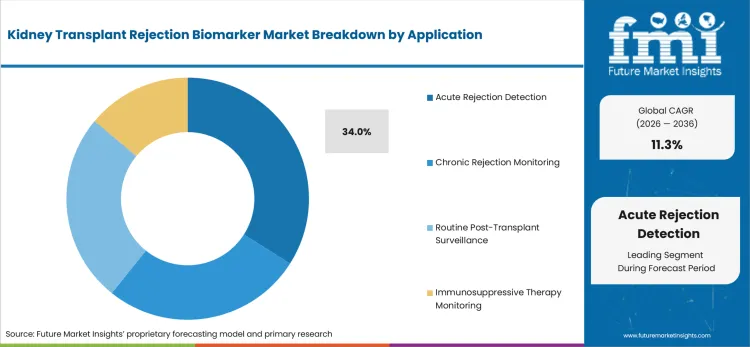
Analysis published by American Journal of Kidney Diseases in April 2024 covered 1,559 biopsy-paired urine samples, highlighting noninvasive rejection assessment across surveillance and graft-dysfunction episodes. Integrated biomarker and clinical information directed more selective biopsy decisions within specialist pathways. Urine and blood biomarkers support early triage during suspected graft dysfunction. Clinical teams compare molecular findings with creatinine trends and pathology history prior to invasive confirmation. Clear escalation rules improve confidence across acute treatment decisions.
- By application, acute rejection detection is anticipated to hold 34.0% share in 2026 since it reflects urgent therapy decisions prompted by suspected graft injury and uncertain creatinine changes. Clinical teams value assays producing timely evidence for biopsy prioritization and immunosuppression review during active deterioration.
- Chronic rejection monitoring and immunosuppressive therapy monitoring influence longitudinal assessment across stable and changing graft conditions. Repeat organ function assays complement molecular signals during trend review and treatment-response assessment.
Why do Transplant Centers lead end-user demand?
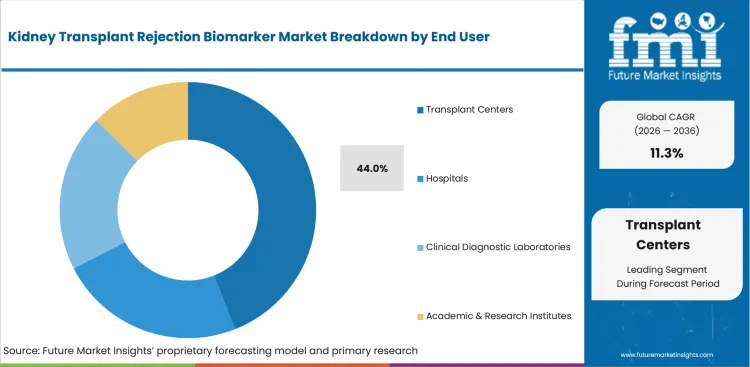
Centralized records help in comparison of molecular signals with antibodies and pathology findings. Repeat sample volumes strengthen laboratory quality control and trend interpretation. American Journal of Transplantation published an August 2025 analysis of 1,743 kidney-transplant recipients, connecting dd-cfDNA levels with rejection yield across surveillance and for-cause settings. Evidence from a real-world cohort supports specialist interpretation inside integrated in vitro diagnostics pathways. Transplant centers coordinate assay ordering and biopsy referral within one specialist program.
- Based on end-user, transplant centers are forecast to account for 44.0% share in 2026 as it is driven by direct control over surveillance schedules and immunosuppression decisions. Multidisciplinary teams compare molecular results with renal function and pathology history.
- Clinical diagnostic laboratories and academic & research institutes extend testing access through referral services and validated laboratory operations. Academic groups develop evidence and thresholds with diagnostic laboratories are likely to support standardized processing across distributed care networks.
What are drivers, restraints, and opportunities in kidney transplant rejection biomarker market?
Clinical evidence supports earlier injury assessment across transplant surveillance. Interpretation complexity and payment conditions may slow routine repeat testing.
- Driver: Kidney rejection biomarkers convert biological change into a measurable decision signal prior to pronounced renal-function deterioration. Earlier evidence supports biopsy triage and treatment review across specialist transplant pathways.
- Restraint: Biomarker elevation may reflect infection or non-rejection injury across complex post-transplant cases. Variable thresholds reduce confidence if results lack a clearly defined clinical response.
- Opportunity: Serial multimarker services support longitudinal surveillance across stable recipients and patients requiring closer assessment. Integrated reports combining molecular trends with clinical history improve specialist interpretation across repeat visits.
Demand is supported by transplant teams seeking earlier rejection signals without exposing every recipient to repeated biopsy procedures. Kidney International Reports presented 94% sensitivity for acute rejection in an ExoTRU study dated February 2025, supporting noninvasive triage prior to selected biopsy decisions. Clinical value is anticipated to improve as urine-based findings direct specialist attention toward recipients requiring invasive confirmation.
The November 2024 EU-TRAIN study in Kidney International assessed 412 patients, finding limited added discrimination from evaluated biomarkers beyond established clinical variables. Mixed incremental value is expected to constrain adoption for panels lacking reproducible action thresholds across transplant programs. Uncertain interpretation standards may delay sourcing as clinicians require consistent evidence before changing established surveillance protocols.
Wider integration with electronic records could create opportunities for personalized monitoring schedules and earlier immunosuppressive treatment adjustments. CareDx documented 1,258 adult recipients in its June 2026 report, establishing a substantial clinical base for longitudinal dd-cfDNA assessment. Multi-site evidence is likely to support surveillance services connecting repeat molecular results with graft outcomes and care escalation.
How are country CAGRs aligned in kidney transplant rejection biomarker market?
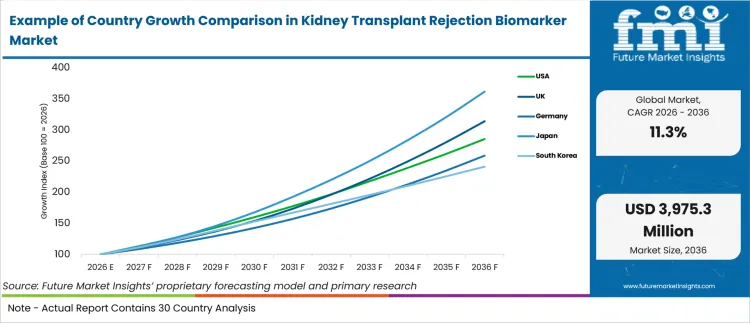
| Country or Market | CAGR |
|---|---|
| Japan | 13.7% |
| UK | 12.1% |
| USA | 11.1% |
| Germany | 10.0% |
| South Korea | 9.2% |
Source: Future Market Insights analysis, 2026.
How do country-level CAGRs compare in kidney transplant rejection biomarker market?
Country comparison shows a gradual step-down in growth across the markets covered. Japan sits at the upper end of the range, followed by the United Kingdom. The United States and Germany form the next growth band. South Korea remains at the lower end of the comparison. The 4.5 percentage-point spread indicates different levels of momentum shaped by transplant activity and specialist adoption conditions.
- Japan leads the comparison and establishes East Asia as a prominent expansion cluster among the markets shown.
- The United Kingdom follows Japan and maintains a relatively small gap from the leading market.
- The United States occupies the next position, supported by substantial transplant volume and established assay availability.
- Germany records a measured outlook as validation standards and reimbursement reviews influence repeat-testing decisions.
- South Korea completes the comparison due to specialist-center concentration and gradual molecular-surveillance adoption.
Markets with broadly similar CAGRs can still present different entry conditions due to reimbursement and transplant-center readiness. The full report provides regional analysis across North America, Latin America, Europe, East Asia, South Asia, Oceania, and the Middle East and Africa.
Country-wise Analysis
- Sector in Japan is set to scale at 13.7% CAGR during the assessment period, driven by concentrated specialist institutions and structured post-transplant follow-up. National care pathways are expected to favor repeatable testing supported by locally validated interpretation and dependable laboratory access. Statistics Bureau of Japan placed the population aged 65 years or older at 36.243 million in its April 2025 publication, increasing clinical pressure for durable graft monitoring among older recipients.
- National transplant pathways in UK support recurring surveillance across specialist kidney services and referral laboratories. Demand in the United Kingdom is forecast to rise at 12.1% CAGR from 2026 to 2036, guided by follow-up intensity and interest in less invasive graft assessment. In November 2025, NHS Blood and Transplant reported more than 6,500 people on the kidney waiting list. It reinforced pressure for graft-preservation tools serving transplanted recipients.
- Established molecular testing access and large transplant programs support serial biomarker evaluation across USA care networks. Scientific Registry of Transplant Recipients counted 27,660 kidney transplants during 2024 in its June 2026 annual report, expanding a substantial recipient base for rejection assessment. Sales in the United States are estimated to progress at 11.1% CAGR by 2036, reflecting repeat surveillance needs across a substantial installed clinical base.
- Industry in Germany is anticipated to expand at 10.0% CAGR during the study period, shaped by rigorous validation review and measured reimbursement adoption across transplant services. Specialist centers are expected to favor assays promoted by contextual interpretation across antibodies and renal-function findings. University of Hamburg cited 953 deceased organ donors during 2024 in an October 2025 study notice, highlighting persistent pressure to protect scarce transplanted organs.
- Concentrated tertiary hospitals in South Korea support specialist-led review of molecular graft surveillance across selected transplant programs. The market in South Korea is projected to post 9.2% CAGR by 2036, guided by gradual evidence adoption and controlled expansion across high-volume institutions. Ministry of Health and Welfare listed 397 brain-dead donors for 2024 in its October 2025 national plan, highlighting clinical emphasis on long-term graft preservation.
Who are notable companies in kidney transplant rejection biomarker market?
CareDx, Inc., Natera, Inc., Verici Dx plc, Insight Molecular Diagnostics Inc., Eurofins Scientific SE, Thermo Fisher Scientific Inc., and Bio-Rad Laboratories, Inc. are notable companies profiled. Company selection reflects direct kidney-transplant assays or supporting molecular laboratory capabilities.
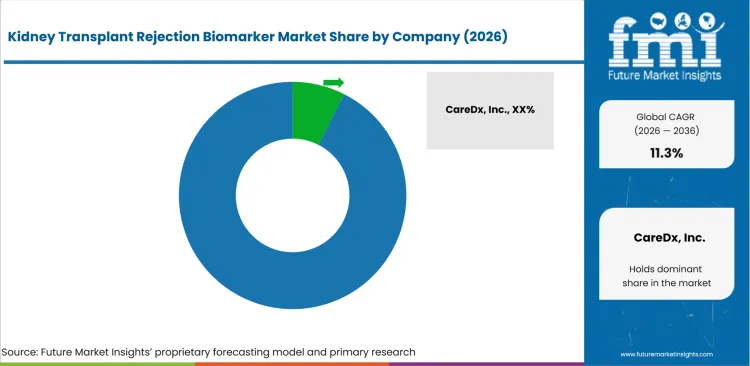
Competition in kidney transplant rejection biomarkers is anticipated to center on transplant-specific evidence and reporting aligned with specialist decisions. Direct assay developers are expected to receive greater clinical attention than enabling-platform suppliers lacking a defined kidney-rejection offer. A molecular assay strategy gains commercial weight as published clinical utility connects repeat results with biopsy selection and treatment review.
- CareDx and Natera are projected to compete based on direct donor-derived cell-free DNA participation and transplant-specific evidence. Clinical programs are likely to compare longitudinal validation, report interpretation and support across kidney-transplant centers.
- Verici Dx is anticipated to compete depending on gene-expression risk assessment focused on acute kidney rejection. Specialist services are expected to examine clinical discrimination and report clarity during assay review.
- Insight Molecular Diagnostics is forecast to support decentralized dd-cfDNA testing due to its GraftAssure portfolio. Laboratory programs are likely to assess local processing control and compatibility with existing molecular equipment.
- Eurofins Scientific SE and Bio-Rad Laboratories are expected to support reference testing and molecular measurement infrastructure. Provider selection is anticipated to reflect turnaround consistency and dependable technical service.
Competitive Benchmarking: Kidney Transplant Rejection Biomarker Market
| Company | Portfolio Depth | Clinical Match | Service Support | Service Reach |
|---|---|---|---|---|
| CareDx, Inc. | High | High | High | United States and selected global markets |
| Natera, Inc. | High | High | High | United States and selected global markets |
| Verici Dx plc | Medium | High | Medium | United States and UK |
| Insight Molecular Diagnostics Inc. | Medium | Medium | Medium | United States and selected global sites |
Source: Future Market Insights competitive analysis, 2026.
Key Developments in Kidney Transplant Rejection Biomarker Market
- In February 2025, CareDx announced European validation of AlloSeq cfDNA involving 580 kidney-transplant patients. Company findings strengthened decentralized sequencing evaluation for transplant-specific rejection monitoring.
- In July 2025, Natera announced PEDAL study results involving 488 kidney-transplant recipients. Company evidence supported longitudinal Prospera assessment following biopsy-proven rejection episodes.
- In June 2026, Verici Dx announced New York State approval for its Tutivia kidney-transplant rejection test. Company action expanded nationwide clinical access for gene-expression risk assessment.
Key Players in Kidney Transplant Rejection Biomarker Market
Donor-Derived Cell-Free DNA Monitoring Companies
- CareDx, Inc.
- Natera, Inc.
- Insight Molecular Diagnostics Inc.
Gene-Expression and Reference Testing Companies
- Verici Dx plc
- Eurofins Scientific SE
Molecular Platform Companies
- Thermo Fisher Scientific Inc.
- Bio-Rad Laboratories, Inc.
Kidney Transplant Rejection Biomarker Market Report Scope
| Coverage Field | Report Scope |
|---|---|
| Market Breakdown | Kidney transplant rejection biomarker market breakdown by biomarker type, technology, application, end user, and region. |
| Quantitative Units | USD million in 2026 to USD million by 2036 at CAGR. |
| Market Definition | Kidney transplant rejection biomarkers include assays, laboratory services, and analytical tools used to assess graft injury or rejection risk following kidney transplantation. |
| Regions Covered | North America, Latin America, Europe, East Asia, South Asia, Oceania, and Middle East and Africa. |
| Countries Covered | Japan, UK, USA, Germany, South Korea, and 30+ countries. |
| Key Companies Profiled | CareDx, Natera, Verici Dx, Insight Molecular Diagnostics, Eurofins Scientific SE, Thermo Fisher Scientific, and Bio-Rad Laboratories. |
| Forecast Period | 2026 to 2036. |
| Approach | Hybrid bottom-up and top-down assessment using segment shares, country CAGRs, transplant activity, clinical evidence, company participation, and service coverage. |
Source: Future Market Insights analysis, 2026.
Kidney Transplant Rejection Biomarker Market - Research Methodology
| Method | Approach |
|---|---|
| Primary Research | FMI analysts gathered input from manufacturers, service providers, technology developers, distributors, end users, procurement teams, and subject-matter experts. Interviews examined purchasing decisions, product or service evaluation, adoption barriers, approval requirements, pricing considerations, and expectations for technical or commercial support. Respondents were also asked what evidence is required before a trial, pilot, or initial order develops into regular purchasing. |
| Desk Research | Desk research covered government statistics, regulatory publications, trade data, industry associations, technical literature, standards, company filings, product information, and official corporate announcements. Sources were reviewed for relevance, publication date, geographic coverage, and consistency with the defined market scope. Claims relating to performance, applications, approvals, capacity, investment, and commercial activity were retained only when supported by credible public evidence. |
| Market Sizing and Forecasting | The market model combined the baseline value with historical performance, segment structure, pricing and volume indicators, adoption levels, company participation, and country-level demand conditions. Forecast assumptions considered economic activity, investment trends, regulatory developments, technology adoption, purchasing cycles, supply availability, and barriers to wider market use. Segment and regional estimates were reconciled before the final market total was calculated. |
| Data Validation | Estimates were checked against multiple independent indicators, including public data, company activity, trade patterns, industry developments, and findings from primary interviews. Validation also tested whether products, services, applications, and company revenues fell within the defined market boundaries. Adjacent categories, unsupported claims, overlapping revenues, and activities without direct market relevance were excluded to reduce double counting and maintain consistency across segments and countries. |
Source: Future Market Insights analysis, 2026.
Kidney Transplant Rejection Biomarker Market by Segments
Kidney Transplant Rejection Biomarker Market segmented by Biomarker Type:
- Donor-Derived Cell-Free DNA (dd-cfDNA)
- Gene Expression Biomarkers
- Protein Biomarkers
- Urinary Biomarkers
- Immune Cell Biomarkers
Kidney Transplant Rejection Biomarker Market segmented by Technology:
- Next-Generation Sequencing (NGS)
- PCR/qPCR
- Digital PCR (dPCR)
- ELISA
- Microarray
Kidney Transplant Rejection Biomarker Market segmented by Application:
- Acute Rejection Detection
- Chronic Rejection Monitoring
- Routine Post-Transplant Surveillance
- Immunosuppressive Therapy Monitoring
Kidney Transplant Rejection Biomarker Market segmented by End User:
- Transplant Centers
- Hospitals
- Clinical Diagnostic Laboratories
- Academic & Research Institutes
Kidney Transplant Rejection Biomarker Market segmented by Region:
- North America
- USA
- Canada
- Latin America
- Brazil
- Mexico
- Europe
- Germany
- UK
- France
- Italy
- Spain
- East Asia
- China
- Japan
- South Korea
- South Asia
- India
- ASEAN
- Oceania
- Australia
- New Zealand
- Middle East and Africa
- GCC Countries
- South Africa
Research Sources and Bibliography
- Aubert, O., Ursule-Dufait, C., Brousse, R., et al. (2024, June 2). Cell-free DNA for the detection of kidney allograft rejection. Nature Medicine, 30, 2320-2327.
- Bestard, O., Augustine, J., Wee, A., et al. (2024, March). Prospective observational study to validate a next-generation sequencing blood RNA signature to predict early kidney transplant rejection. American Journal of Transplantation, 24(3), 436-447.
- Bromberg, J. S., Brennan, D. C., Taber, D. J., et al. (2025, August 6). Donor-derived cell-free DNA significantly improves rejection yield in kidney transplant biopsies. American Journal of Transplantation, 25(12), 2529-2542.
- CareDx, Inc. (2025, February 20). CareDx announces study showing AlloSeq cfDNA highly accurate in detecting rejection in organ transplant patients.
- CareDx, Inc. (2026, June 16). CareDx announces second KOAR analysis published in the Journal of the American Society of Nephrology.
- El Fekih, R., Franzen, K., Hurley, J., et al. (2025, February 3). An exosomal mRNA urine test for detection and risk stratification of human kidney transplant rejection. Kidney International Reports, 10(4), 1131-1142.
- Goutaudier, V., Danger, R., Catar, R. A., et al. (2024, November). Evaluation of non-invasive biomarkers of kidney allograft rejection in a prospective multicenter unselected cohort study (EU-TRAIN). Kidney International, 106(5), 943-960.
- Martin, F., Carmona, M., Mahillo, B., Alvarez, M., Luengo, A., Chatzixiros, E., López-Fraga, M., Domínguez-Gil, B., & Tullius, S. G. (2026, February 10). Organ donation and transplantation worldwide: The Global Observatory on Donation and Transplantation 2024 report. Transplantation, 110(3), e655-e669.
- Ministry of Health and Welfare, Republic of Korea. (2025, October 17). MOHW establishes first comprehensive plan for organ and tissue donation.
- Natera, Inc. (2025, July 24). PEDAL study successful, shows monitoring with Prospera Kidney provides accurate prognosis of long-term clinical outcomes following rejection; now published in American Journal of Transplantation.
- NHS Blood and Transplant. (2025, November 27). Ethnic minority organ donations increase despite a drop in the number of transplants.
- Scientific Registry of Transplant Recipients. (2026, June 12). OPTN/SRTR 2024 annual data report: Kidney.
- Statistics Bureau of Japan. (2025, April 14). Current population estimates as of October 1, 2024.
- University of Hamburg. (2025, October 28). Opt-out system does not automatically mean more available organs.
- Van Loon, E., Tinel, C., de Loor, H., et al. (2024, April). Automated urinary chemokine assays for noninvasive detection of kidney transplant rejection: A prospective cohort study. American Journal of Kidney Diseases, 83(4), 467-476.
- Verici Dx plc. (2026, June 24). Verici Dx receives New York State approval, establishing nationwide access to Tutivia kidney transplant rejection test.
- Xing, Y., Guo, Q., Wang, C., Shi, H., Zheng, J., Jia, Y., Li, C., & Hao, C. (2024, February 20). Donor-derived cell-free DNA as a diagnostic marker for kidney-allograft rejection: A systematic review and meta-analysis. Biomolecules and Biomedicine, 24(4), 731-740.
This bibliography is provided for reader reference and is not exhaustive. The full report contains the complete reference list and detailed citations.
This Report Answers
- How do biomarker type, technology, application, and end user segments influence kidney transplant rejection biomarker demand?
- How do transplant teams evaluate kidney rejection biomarkers prior to routine surveillance use?
- How do country CAGRs differ across profiled transplant systems and laboratory conditions?
- What companies compete through transplant-specific assays and laboratory services?
- How are forecasts validated through bottom-up and top-down assessment using independent indicators?
- What evidence do transplant centers examine prior to multi-site testing expansion?
- How do assay consistency and clinical interpretation influence test selection across specialist services?
- What limits return on investment for repeat kidney rejection biomarker testing?
- How do sample logistics and technical support influence laboratory approval?
- What company capabilities improve long-term clinical confidence and recurring test use?
Frequently Asked Questions
What supports demand in kidney transplant rejection biomarker market?
Demand is likely to be supported by transplant teams seeking earlier evidence of graft injury across repeat surveillance visits. Hospitals are expected to favor assays combining clinical validation with dependable sample processing and specialist interpretation.
Which companies are active in kidney transplant rejection biomarker market?
Notable companies are anticipated to include CareDx and Bio-Rad Laboratories among others. Competition is likely to reflect transplant-specific evidence and support across specialist institutions.
What restraint affects kidney transplant rejection biomarker market?
Interpretation complexity restrains adoption due to infection or non-rejection injury elevating molecular signals. Repeat testing may slow led by payment coverage lacking alignment with clearly defined clinical actions.
Why do executives track kidney transplant rejection biomarker market?
Executives are expected to track biomarker adoption as surveillance decisions affect biopsy use and graft-preservation pathways. Evidence quality and service coverage are likely to guide investment review across clinical networks.
What business problem does kidney transplant rejection biomarker market address?
Kidney rejection biomarkers support earlier assessment of graft injury across blood and urine samples. Clinical teams need results supporting biopsy prioritization and treatment review during uncertain renal-function changes.
What do transplant teams evaluate prior to selecting companies?
Transplant teams are likely to evaluate analytical consistency and report interpretation. Laboratory support and sample logistics are expected to guide final provider review across participating institutions.
What limits return on investment for purchasing teams?
Return on investment weakens if repeat testing fails to alter biopsy use or treatment decisions. Low utilization and unclear payment coverage reduce recurring value from assay services across transplant programs.
How do companies build long-term clinical confidence?
Companies build clinical confidence based on dependable assay performance and evidence connected with specialist decisions. Education records and responsive troubleshooting are expected to influence recurring use across transplant institutions.
Preview the report firsthand - request a free sample
Get SampleGet the brochure for pricing and purchase details.
Get PDFTable of Content
- Key Takeaways
- Market Size and CAGR
- Top Growth Driver
- Fastest Growing Segment
- Leading Region
- Key Companies
- Emerging Opportunities
- Executive Summary
- Global Market Outlook
- Demand-side Trends
- Supply-side Trends
- Technology Roadmap Analysis
- Analysis and Recommendations
- Analyst Perspective (What is happening? Why now? What should investors know?)
- Key Questions Answered
- How large is the market?
- What is the CAGR?
- What are key trends?
- Which region dominates?
- Who are the leaders?
- Market Overview
- Market Coverage / Taxonomy
- Market Definition / Scope / Limitations
- Research Methodology
- Chapter Orientation
- Analytical Lens and Working Hypotheses
- Market Structure, Signals, and Trend Drivers
- Benchmarking and Cross-market Comparability
- Market Sizing, Forecasting, and Opportunity Mapping
- Research Design and Evidence Framework
- Desk Research Programme (Secondary Evidence)
- Expert Input and Fieldwork (Primary Evidence)
- Tooling, Models, and Reference Databases
- Data Engineering and Model Build
- Quality Assurance and Audit Trail
- Market Background
- Market Dynamics (Drivers, Restraints, Opportunity, Trends)
- Scenario Forecast (Optimistic, Likely, Conservative)
- Impact Analysis
- AI Impact
- Sustainability Impact
- Regulatory Impact
- Technology Impact
- Consumer / Buyer Analysis
- Purchase Drivers
- Adoption Barriers
- Buyer Journey
- Opportunity Map Analysis
- Product Life Cycle Analysis
- Supply Chain Analysis
- Investment Feasibility Matrix
- Value Chain Analysis
- PESTLE and Porter's Analysis
- Regulatory Landscape
- Regional Parent Market Outlook
- Production and Consumption Statistics
- Import and Export Statistics
- Global Market Analysis and Forecast, 2021 to 2036
- Historical Market Size Value (USD Million) Analysis, 2021 to 2025
- Current and Future Market Size Value (USD Million) Projections, 2026 to 2036
- Y-o-Y Growth Trend Analysis
- Absolute $ Opportunity Analysis
- Global Market Pricing Analysis, 2021 to 2036
- Global Market Analysis and Forecast, By Biomarker Type, 2021 to 2036
- Introduction / Key Findings
- Historical Market Size Value (USD Million) Analysis By Biomarker Type, 2021 to 2025
- Current and Future Market Size Value (USD Million) Analysis and Forecast By Biomarker Type, 2026 to 2036
- Donor-Derived Cell-Free DNA (dd-cfDNA)
- Gene Expression Biomarkers
- Protein Biomarkers
- Urinary Biomarkers
- Immune Cell Biomarkers
- Donor-Derived Cell-Free DNA (dd-cfDNA)
- Y-o-Y Growth Trend Analysis By Biomarker Type, 2021 to 2025
- Absolute $ Opportunity Analysis By Biomarker Type, 2026 to 2036
- Global Market Analysis and Forecast, By Technology, 2021 to 2036
- Introduction / Key Findings
- Historical Market Size Value (USD Million) Analysis By Technology, 2021 to 2025
- Current and Future Market Size Value (USD Million) Analysis and Forecast By Technology, 2026 to 2036
- Next-Generation Sequencing (NGS)
- PCR/qPCR
- Digital PCR (dPCR)
- ELISA
- Microarray
- Next-Generation Sequencing (NGS)
- Y-o-Y Growth Trend Analysis By Technology, 2021 to 2025
- Absolute $ Opportunity Analysis By Technology, 2026 to 2036
- Global Market Analysis and Forecast, By Application, 2021 to 2036
- Introduction / Key Findings
- Historical Market Size Value (USD Million) Analysis By Application, 2021 to 2025
- Current and Future Market Size Value (USD Million) Analysis and Forecast By Application, 2026 to 2036
- Acute Rejection Detection
- Chronic Rejection Monitoring
- Routine Post-Transplant Surveillance
- Immunosuppressive Therapy Monitoring
- Acute Rejection Detection
- Y-o-Y Growth Trend Analysis By Application, 2021 to 2025
- Absolute $ Opportunity Analysis By Application, 2026 to 2036
- Global Market Analysis and Forecast, By End User, 2021 to 2036
- Introduction / Key Findings
- Historical Market Size Value (USD Million) Analysis By End User, 2021 to 2025
- Current and Future Market Size Value (USD Million) Analysis and Forecast By End User, 2026 to 2036
- Transplant Centers
- Hospitals
- Clinical Diagnostic Laboratories
- Academic & Research Institutes
- Transplant Centers
- Y-o-Y Growth Trend Analysis By End User, 2021 to 2025
- Absolute $ Opportunity Analysis By End User, 2026 to 2036
- Global Market Analysis and Forecast, By Region, 2021 to 2036
- Introduction
- Historical Market Size Value (USD Million) Analysis By Region, 2021 to 2025
- Current Market Size Value (USD Million) Analysis and Forecast By Region, 2026 to 2036
- North America
- Latin America
- Western Europe
- Eastern Europe
- East Asia
- South Asia and Pacific
- Middle East & Africa
- Market Attractiveness Analysis By Region
- North America Market Analysis and Forecast, By Country, 2021 to 2036
- Historical Market Size Value (USD Million) Trend Analysis By Market Taxonomy, 2021 to 2025
- Market Size Value (USD Million) Forecast By Market Taxonomy, 2026 to 2036
- By Country
- USA
- Canada
- By Biomarker Type
- By Technology
- By Application
- By End User
- By Country
- Market Attractiveness Analysis
- By Country
- By Biomarker Type
- By Technology
- By Application
- By End User
- Key Takeaways
- Latin America Market Analysis and Forecast, By Country
- Historical Market Size Value (USD Million) Trend Analysis By Market Taxonomy, 2021 to 2025
- Market Size Value (USD Million) Forecast By Market Taxonomy, 2026 to 2036
- By Country
- Brazil
- Mexico
- Chile
- Rest of Latin America
- By Biomarker Type
- By Technology
- By Application
- By End User
- By Country
- Market Attractiveness Analysis
- By Country
- By Biomarker Type
- By Technology
- By Application
- By End User
- Key Takeaways
- Western Europe Market Analysis and Forecast, By Country
- Historical Market Size Value (USD Million) Trend Analysis By Market Taxonomy, 2021 to 2025
- Market Size Value (USD Million) Forecast By Market Taxonomy, 2026 to 2036
- By Country
- Germany
- UK
- Italy
- Spain
- France
- Nordic
- BENELUX
- Rest of Western Europe
- By Biomarker Type
- By Technology
- By Application
- By End User
- By Country
- Market Attractiveness Analysis
- By Country
- By Biomarker Type
- By Technology
- By Application
- By End User
- Key Takeaways
- Eastern Europe Market Analysis and Forecast, By Country
- Historical Market Size Value (USD Million) Trend Analysis By Market Taxonomy, 2021 to 2025
- Market Size Value (USD Million) Forecast By Market Taxonomy, 2026 to 2036
- By Country
- Russia
- Poland
- Hungary
- Balkan & Baltic
- Rest of Eastern Europe
- By Biomarker Type
- By Technology
- By Application
- By End User
- By Country
- Market Attractiveness Analysis
- By Country
- By Biomarker Type
- By Technology
- By Application
- By End User
- Key Takeaways
- East Asia Market Analysis and Forecast, By Country
- Historical Market Size Value (USD Million) Trend Analysis By Market Taxonomy, 2021 to 2025
- Market Size Value (USD Million) Forecast By Market Taxonomy, 2026 to 2036
- By Country
- China
- Japan
- South Korea
- By Biomarker Type
- By Technology
- By Application
- By End User
- By Country
- Market Attractiveness Analysis
- By Country
- By Biomarker Type
- By Technology
- By Application
- By End User
- Key Takeaways
- South Asia and Pacific Market Analysis and Forecast, By Country
- Historical Market Size Value (USD Million) Trend Analysis By Market Taxonomy, 2021 to 2025
- Market Size Value (USD Million) Forecast By Market Taxonomy, 2026 to 2036
- By Country
- India
- ASEAN
- Australia & New Zealand
- Rest of South Asia and Pacific
- By Biomarker Type
- By Technology
- By Application
- By End User
- By Country
- Market Attractiveness Analysis
- By Country
- By Biomarker Type
- By Technology
- By Application
- By End User
- Key Takeaways
- Middle East & Africa Market Analysis and Forecast, By Country
- Historical Market Size Value (USD Million) Trend Analysis By Market Taxonomy, 2021 to 2025
- Market Size Value (USD Million) Forecast By Market Taxonomy, 2026 to 2036
- By Country
- Kingdom of Saudi Arabia
- Other GCC Countries
- Türkiye
- South Africa
- Other African Union
- Rest of Middle East & Africa
- By Biomarker Type
- By Technology
- By Application
- By End User
- By Country
- Market Attractiveness Analysis
- By Country
- By Biomarker Type
- By Technology
- By Application
- By End User
- Key Takeaways
- Key Countries Market Analysis
- USA
- Pricing Analysis
- Market Share Analysis, 2025
- By Biomarker Type
- By Technology
- By Application
- By End User
- Canada
- Pricing Analysis
- Market Share Analysis, 2025
- By Biomarker Type
- By Technology
- By Application
- By End User
- Mexico
- Pricing Analysis
- Market Share Analysis, 2025
- By Biomarker Type
- By Technology
- By Application
- By End User
- Brazil
- Pricing Analysis
- Market Share Analysis, 2025
- By Biomarker Type
- By Technology
- By Application
- By End User
- Chile
- Pricing Analysis
- Market Share Analysis, 2025
- By Biomarker Type
- By Technology
- By Application
- By End User
- Germany
- Pricing Analysis
- Market Share Analysis, 2025
- By Biomarker Type
- By Technology
- By Application
- By End User
- UK
- Pricing Analysis
- Market Share Analysis, 2025
- By Biomarker Type
- By Technology
- By Application
- By End User
- Italy
- Pricing Analysis
- Market Share Analysis, 2025
- By Biomarker Type
- By Technology
- By Application
- By End User
- Spain
- Pricing Analysis
- Market Share Analysis, 2025
- By Biomarker Type
- By Technology
- By Application
- By End User
- France
- Pricing Analysis
- Market Share Analysis, 2025
- By Biomarker Type
- By Technology
- By Application
- By End User
- India
- Pricing Analysis
- Market Share Analysis, 2025
- By Biomarker Type
- By Technology
- By Application
- By End User
- ASEAN
- Pricing Analysis
- Market Share Analysis, 2025
- By Biomarker Type
- By Technology
- By Application
- By End User
- Australia & New Zealand
- Pricing Analysis
- Market Share Analysis, 2025
- By Biomarker Type
- By Technology
- By Application
- By End User
- China
- Pricing Analysis
- Market Share Analysis, 2025
- By Biomarker Type
- By Technology
- By Application
- By End User
- Japan
- Pricing Analysis
- Market Share Analysis, 2025
- By Biomarker Type
- By Technology
- By Application
- By End User
- South Korea
- Pricing Analysis
- Market Share Analysis, 2025
- By Biomarker Type
- By Technology
- By Application
- By End User
- Russia
- Pricing Analysis
- Market Share Analysis, 2025
- By Biomarker Type
- By Technology
- By Application
- By End User
- Poland
- Pricing Analysis
- Market Share Analysis, 2025
- By Biomarker Type
- By Technology
- By Application
- By End User
- Hungary
- Pricing Analysis
- Market Share Analysis, 2025
- By Biomarker Type
- By Technology
- By Application
- By End User
- Kingdom of Saudi Arabia
- Pricing Analysis
- Market Share Analysis, 2025
- By Biomarker Type
- By Technology
- By Application
- By End User
- Türkiye
- Pricing Analysis
- Market Share Analysis, 2025
- By Biomarker Type
- By Technology
- By Application
- By End User
- South Africa
- Pricing Analysis
- Market Share Analysis, 2025
- By Biomarker Type
- By Technology
- By Application
- By End User
- USA
- Market Structure Analysis
- Competition Dashboard
- Competition Benchmarking
- Market Share Analysis of Top Players
- By Regional
- By Biomarker Type
- By Technology
- By Application
- By End User
- Emerging Startups
- Innovation Benchmarking
- Competition Analysis
- Competition Deep Dive
- CareDx, Inc.
- Overview
- Product Portfolio
- Profitability by Market Segments
- Sales Footprint
- Strategy Overview
- Marketing Strategy
- Product Strategy
- Channel Strategy
- Natera, Inc.
- Eurofins Scientific
- Thermo Fisher Scientific Inc.
- QIAGEN N.V.
- Bio-Rad Laboratories, Inc.
- F. Hoffmann-La Roche Ltd.
- Illumina, Inc.
- Revvity, Inc.
- Oxford Nanopore Technologies plc
- CareDx, Inc.
- Case Studies
- Success Stories
- Recent Developments
- Competition Deep Dive
- Assumptions & Acronyms Used


