The Kids Shampoo Market is estimated to be valued at USD 3.7 billion in 2025 and is projected to reach USD 6.7 billion by 2035, registering a compound annual growth rate (CAGR) of 6.1% over the forecast period.
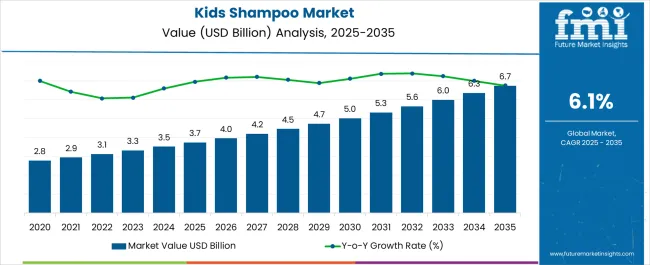
| Metric | Value |
|---|---|
| Kids Shampoo Market Estimated Value in (2025 E) | USD 3.7 billion |
| Kids Shampoo Market Forecast Value in (2035 F) | USD 6.7 billion |
| Forecast CAGR (2025 to 2035) | 6.1% |
The kids shampoo market is experiencing robust growth. Rising parental awareness about child health and safety, coupled with increasing demand for mild and chemical-free formulations, has been driving adoption. Current market dynamics are shaped by regulatory emphasis on safe ingredients, the premiumization of personal care products, and expanding retail penetration.
Organic and natural formulations are increasingly preferred, aligning with consumer concerns about skin sensitivity and long-term wellness. Manufacturers are investing in product innovation, packaging enhancements, and fragrance diversification to strengthen consumer appeal. Evolving distribution strategies, supported by organized retail and e-commerce platforms, are further widening accessibility.
The future outlook is reinforced by growing disposable incomes, urbanization, and expanding child-focused product ranges by multinational and regional brands Market growth rationale lies in the balance of consumer trust, brand differentiation, and compliance with stringent quality standards Collectively, these factors are creating opportunities for sustained revenue expansion and deeper penetration of kids shampoo products across global markets.
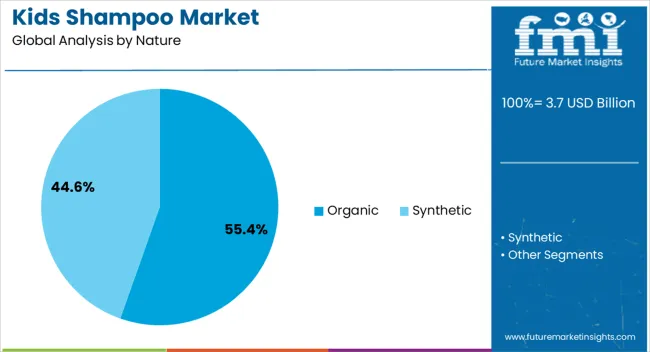
The organic segment, accounting for 55.40% of the nature category, has emerged as the leading choice due to heightened parental preference for safe, toxin-free, and environmentally friendly formulations. Its market strength is being supported by rising awareness of the adverse effects of synthetic chemicals on sensitive skin and scalp.
Brand trust and certification-based assurance have reinforced consumer confidence, while supply chain improvements in organic raw materials have enabled manufacturers to scale production. Premium positioning has allowed organic shampoos to capture higher margins, and targeted marketing campaigns have amplified awareness among urban households.
The segment is expected to retain leadership as wellness-driven consumption habits expand and regulatory scrutiny on children’s personal care products intensifies.
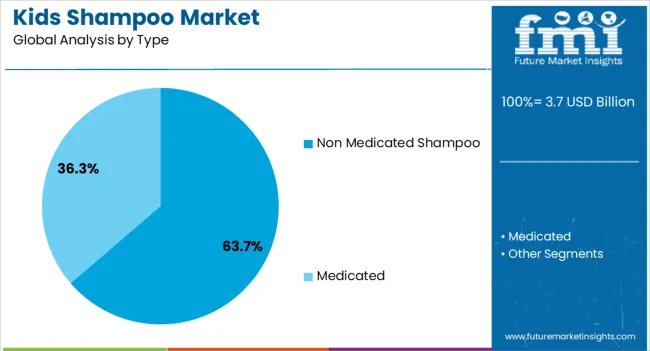
The non medicated shampoo segment, holding 63.70% of the type category, has maintained dominance due to its broad applicability in routine hair care for children. Its preference is being reinforced by mild formulations designed to cleanse effectively without irritation, making it suitable for daily use.
Demand stability is further driven by product availability across diverse price ranges, catering to both mass and premium markets. Manufacturers have focused on innovation through natural ingredients, tear-free claims, and attractive packaging, which has resonated strongly with parents and caregivers.
Continuous expansion of product assortments under non medicated lines is ensuring consistent adoption, supporting this segment’s leading market position.
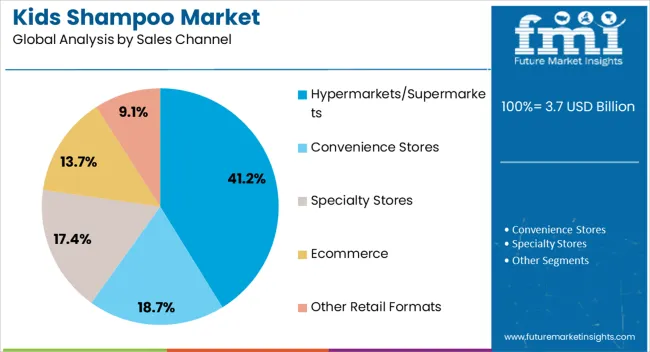
The hypermarkets and supermarkets segment, representing 41.20% of the sales channel category, has established itself as the primary distribution medium for kids shampoo products. Its leadership is supported by high product visibility, convenient availability, and the opportunity for consumers to compare multiple brands simultaneously.
Promotional campaigns, in-store discounts, and bundled offerings have further stimulated purchases within this channel. Strategic partnerships between retailers and manufacturers have enabled improved shelf placement and targeted marketing.
While e-commerce penetration is rising, the scale and trust associated with physical retail stores continue to drive consumer preference, ensuring the segment retains its leading share over the forecast period.
| Historical Value in 2025 | USD 3,227.20 million |
|---|---|
| Market Estimated Size in 2025 | USD 3,512.10 million |
| Projected Market Value in 2035 | USD 6,346.90 million |
Over the past five years, the kids shampoo market experienced a significant transformation. Several key trends emerged during this period. Brands began prioritizing child safety and health, phasing out harsh chemicals, and allergens from their products. This shift was in response to heightened parental concerns about product ingredients. There was a growing emphasis on eco friendliness, with brands introducing sustainable packaging and organic, biodegradable components.
Digital engagement marked another notable trend, with the integration of interactive apps and online resources, turning bath time into an entertaining and educational experience for children. Personalization also gained traction, acknowledging the diverse hair and scalp needs of kids, offering tailored solutions.
Looking ahead to the next decade, the kids shampoo market is poised for continued growth and innovation. The trajectory indicates a deepening commitment to natural and safe formulations, with stricter regulations driving the industry towards even cleaner ingredients. Sustainability will remain a cornerstone, with more brands adopting eco friendly packaging and exploring carbon neutral practices.
The digital landscape will further evolve, with augmented reality and gamification enhancing the interactive experiences for children. Personalization will become increasingly sophisticated, with AI driven recommendations and customization.
As parents become more discerning and eco conscious, market players will focus on ethical and social responsibility, aligning with consumers values. The kids shampoo market is set to become more competitive and dynamic, catering to the evolving needs of both parents and their young ones. The global market for Kids Shampoo is anticipated to grow at a moderate CAGR of 6.10% over the forecast period 2025 to 2035.
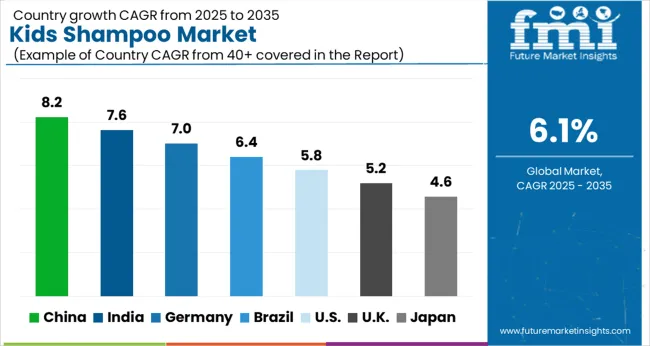
The below table showcases revenues in terms of the top five leading countries, spearheaded by the United States and United Kingdom.
Forecast CAGRs from 2025 to 2035
| Japan | 9.60% |
|---|---|
| China | 7.80% |
| Canada | 7.30% |
| Spain | 6.40% |
| The United States | 5.10% |
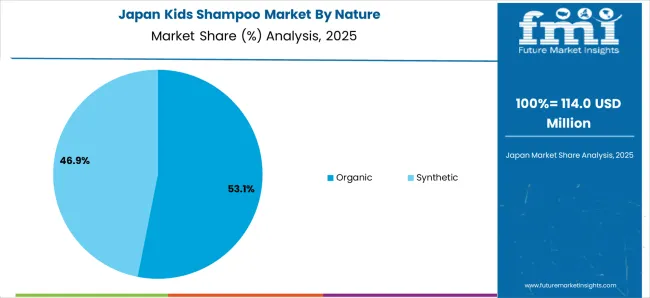
The Japan kids shampoo market is experiencing a notable surge, marked by distinctive trends and a compelling CAGR of 9.60% forecasted until 2035. An emerging trend lies in advanced formulations integrating traditional and natural Japan ingredients like yuzu, rice water, and camellia oil. Brands are leveraging these elements, known for their nourishing and gentle properties, appealing to health conscious parents seeking culturally inspired, safe solutions for their children hair care.
A heightened focus on eco friendly packaging, aligned with Japan commitment to sustainability, is driving innovation. Companies are increasingly adopting biodegradable materials and reducing plastic waste, resonating with environmentally aware consumers. Digital immersion remains pivotal, with interactive apps and gamified experiences shaping bath time for kids, ensuring both entertainment and education.
The Japan kids shampoo market is expected to observe steady growth is steered by this blend of traditional ingredients, sustainability initiatives, and technological engagement, promising a vibrant and evolving industry landscape in the years ahead.
The China kids shampoo market is poised for remarkable growth, with a projected CAGR of 7.80% until 2035, offering a realm of uncharted opportunities. A notable prospect lies in the rising middle class population with increasing disposable income.
As more families seek premium and safer products for their children, there is substantial potential for brands to introduce high end, specialized kids shampoos tailored to diverse needs, whether it is natural ingredients, eco friendliness, or specific hair concerns.
Tapping into the ecommerce boom in China can be a gamechanger. With the increasing reliance on online shopping platforms, reaching a wider customer base becomes more accessible for both established and emerging brands.
Collaborations with dermatologists and pediatricians for product endorsements and certifications can instill trust and credibility among Chinese parents, who prioritize safety and health. The market growth is intertwined with adaptability and innovation, offering numerous avenues for brands to explore and excel in this dynamic and promising sector.
In the Canada kids shampoo market, a CAGR of 7.30% through 2035 is expected, fueled by a blend of innovative drivers. An intriguing factor is the increasing multiculturalism in Canada. With a diverse population, there is a growing demand for kids hair care products that cater to various hair types and cultural preferences, presenting an uncharted opportunity for customization and specialized formulations.
A prominent driver is the trend of family wellness. Parents are increasingly seeking products that promote holistic well-being, encompassing physical health, eco-consciousness, and emotional balance. Kids shampoos that align with these values, offering natural ingredients, sustainable packaging, and soothing aromatherapy elements, are gaining traction.
Emerging partnerships with wellness spas and salons that provide children hair care services have the potential to reshape the market, providing unique experiences and expanding distribution channels. The Canada kids shampoo market is riding the wave of diversity and holistic health, offering a fascinating journey for both brands and consumers alike.
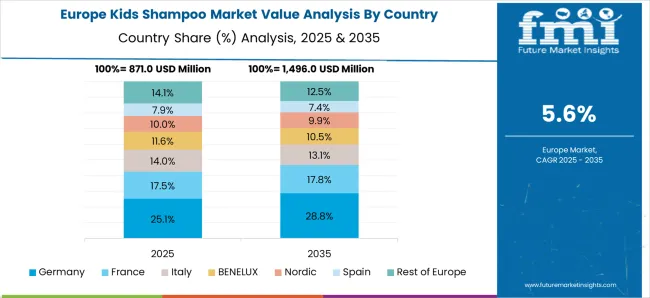
The Spain kids shampoo market is experiencing a surge, boasting a promising CAGR of 6.40% until 2035, driven by intriguing drivers. A remarkable factor is the growing trend of educational grooming. Parents are seeking hair care products that not only cleanse but also educate their children about proper hygiene and sustainable practices. Brands incorporating informative packaging, interactive labels, and eco friendly messages are gaining favor among conscious consumers.
As urbanization intensifies, the market has an unexpected driver in compact living spaces. Families in urban areas often have limited storage, spurring the demand for smaller, travel sized kids shampoos. Brands offering convenient and space efficient packaging are poised to capitalize on this emerging need.
Aligning with Spain’s vibrant culture, brands are experimenting with unique, locally inspired scents and ingredients, appealing to a sense of nostalgia and regional pride. The Spain kids shampoo market is not just about cleansing, it is a journey of education, convenience, and cultural resonance, promising exciting prospects for both brands and consumers.
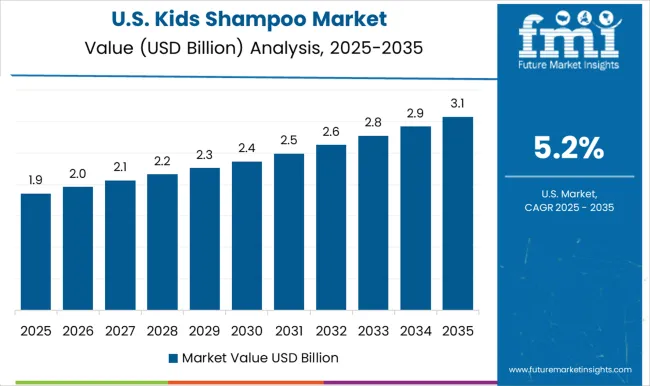
The United States kids shampoo market is on an upward trajectory, with a projected CAGR of 5.10% through 2035, driven by a blend of promising factors. An intriguing driver is the rising influence of kid fluencers on social media. As children increasingly engage with online content, their opinions on products carry weight. This trend compels brands to create products that are both safe and appealing to this techssavvy generation.
A surging focus on STEM education has spurred interest in products that stimulate scientific curiosity. Kids shampoos infused with mild chemistry lessons and interactive packaging are gaining momentum. The green school movement, which promotes eco consciousness in educational institutions, has resulted in a demand for eco friendly hair care solutions. Brands aligning with sustainable values and offering recyclable packaging are seizing this opportunity.
The United States kids shampoo market is evolving to meet the dynamic demands of today digitally connected and environmentally conscious young consumers, charting a unique and promising path forward.
| Category | Market Share in 2025 |
|---|---|
| Organic | 52.70% |
| Modern Trade | 24.30% |
In 2025, the organic segment is poised to emerge as a dominant force, claiming a substantial market share of 52.70%. This trend reflects a shifting consumer preference towards cleaner and more natural choices. With increasing awareness about the potential risks associated with chemical laden products, organic alternatives have gained trust and popularity.
This shift signifies a significant transformation in consumer behavior, as individuals prioritize safer and environmentally responsible options, mirroring a broader global movement towards sustainability and healthier living. As the organic segment continues to grow, it reshapes the market landscape, challenging conventional practices and encouraging a wave of eco friendly, nature inspired offerings.
By 2025, the modern trade segment is predicted to secure a substantial market share of 24.30%. This underscores the growing influence of organized retail channels in the kids shampoo market. Modern trade outlets such as supermarkets, hypermarkets, and specialty stores offer a wide range of options, attracting parents seeking convenience and variety.
With ample shelf space and the ability to showcase various brands, modern trade is perfectly positioned to cater to the diverse preferences of consumers. This significant market share indicates the enduring appeal of one stop shopping, where parents can readily access a plethora of kids hair care products under a single roof.
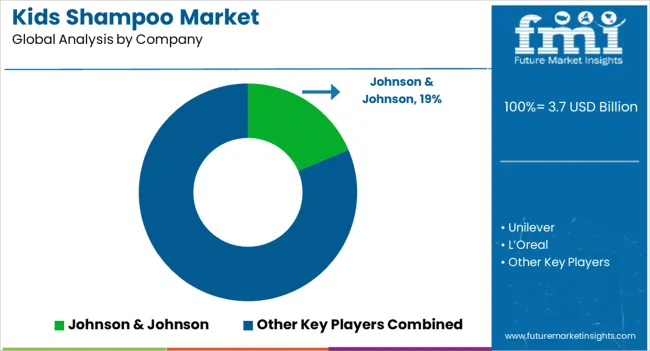
The kids shampoo market boasts a dynamic and competitive landscape, characterized by a myriad of established brands and innovative newcomers. Key players continually strive to outdo one another, not only in product quality but also in packaging and marketing strategies, creating a visually engaging and eco friendly experience.
The market sees a surge in niche players, offering personalized and unique solutions that cater to specific hair types and individual preferences. In this fiercely competitive arena, consumer safety, environmental consciousness, and interactive digital engagement are becoming pivotal differentiators, pushing brands to adapt and evolve, promising a vibrant and ever changing landscape for the kids shampoo market.
Product Portfolio
| Attribute | Details |
|---|---|
| Estimated Market Size in 2025 | USD 3,512.10 million |
| Projected Market Valuation in 2035 | USD 6,346.90 million |
| Value-based CAGR 2025 to 2035 | 6.10% |
| Forecast Period | 2025 to 2035 |
| Historical Data Available for | 2020 to 2025 |
| Market Analysis | Value in USD million |
| Key Regions Covered | North America; Latin America; Western Europe; Eastern Europe; South Asia and Pacific; East Asia; The Middle East & Africa |
| Key Market Segments Covered | Nature, Type, Sales Channel, Region |
| Key Countries Profiled | The United States, Canada, Brazil, Mexico, Germany, The United Kingdom, France, Spain, Italy, Russia, Poland, Czech Republic, Romania, India, Bangladesh, Australia, New Zealand, China, Japan, South Korea, GCC countries, South Africa, Israel |
| Key Companies Profiled | Unilever; Johnson & Johnson; L’Oreal; Beiersdorf; California Baby; Earth Mama Angel Baby; The Himalaya Drug Company; Mothercare; MONAT GLOBAL CORP; Weleda |
The global kids shampoo market is estimated to be valued at USD 3.7 billion in 2025.
The market size for the kids shampoo market is projected to reach USD 6.7 billion by 2035.
The kids shampoo market is expected to grow at a 6.1% CAGR between 2025 and 2035.
The key product types in kids shampoo market are organic and synthetic.
In terms of type, non medicated shampoo segment to command 63.7% share in the kids shampoo market in 2025.


Full Research Suite comprises of:
Market outlook & trends analysis
Interviews & case studies
Strategic recommendations
Vendor profiles & capabilities analysis
5-year forecasts
8 regions and 60+ country-level data splits
Market segment data splits
12 months of continuous data updates
DELIVERED AS:
PDF EXCEL ONLINE
Kids Splint Market Size and Share Forecast Outlook 2025 to 2035
Kids Toys Market Size and Share Forecast Outlook 2025 to 2035
Kids Sports Equipment and Accessories Market Size and Share Forecast Outlook 2025 to 2035
Kids’ Brain Health Supplements Market Size and Share Forecast Outlook 2025 to 2035
Kids Sports Injury Treatment Market Size and Share Forecast Outlook 2025 to 2035
Kids Musical Instrument Market Size and Share Forecast Outlook 2025 to 2035
Kids Storage Furniture Market by Type, Material, End-Use, and Region - Growth, Trends, and Forecast through 2025 to 2035
Kids’ Food and Beverages Market Analysis by Product Type, Age Group, Category, Distribution Channel and Region through 2035
Kids Apparel Market Trends - Growth, Demand & Forecast 2025 to 2035
Kids Recreational Services Market by Activity Type, Service Type, and Region - Forecast to 2025 to 2035
Kids Watch Market
Kids’ Eyewear Market Report – Trends & Forecast 2024-2034
Air Caster Skids System Market Size and Share Forecast Outlook 2025 to 2035
Probiotic for Kids Market Analysis - Size, Share, and Forecast 2025 to 2035
Industrial RO Skids Market Analysis - Size, Share, and Forecast Outlook 2025 to 2035
Mesh Nebulizer for Kids Market Size and Share Forecast Outlook 2025 to 2035
Coolant Filtration Skids Market Analysis - Size, Share, and Forecast Outlook 2025 to 2035
Luxury Products For Kids Market - Trends, Growth & Forecast 2025 to 2035
Pet Shampoo Market Size and Share Forecast Outlook 2025 to 2035
Market Share Breakdown of Pet Shampoo Manufacturers

Thank you!
You will receive an email from our Business Development Manager. Please be sure to check your SPAM/JUNK folder too.
Chat With
MaRIA