
- Market Size (2026)
- USD 55.2 Bn
- Forecast (2036)
- USD 94.3 Bn
- CAGR (2026 to 2036)
- 5.5%
How big is Labels Market in 2026?
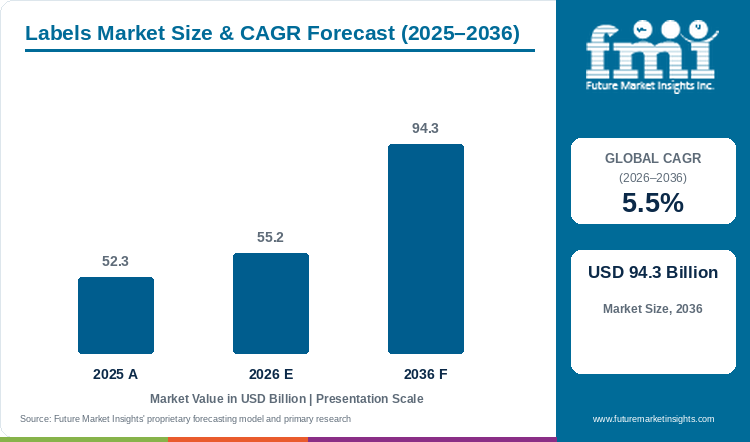
Starting from USD 52.3 billion in 2025, the labels market valuation advanced to USD 55.2 billion in 2026, with projections pointing toward USD 94.3 billion by 2036 at a CAGR of 5.5%.
Global labels industry valuation stands at an estimated USD 55.2 billion for 2026 compared with a USD 52.3 billion market size in 2025, and FMI projects total market value to reach USD 94.3 billion by 2036 on a 5.5% CAGR that generates USD 39.1 billion in added industry valuation. Much of this steady demand comes from food, beverage, and medicine brands updating package labels to meet new front-of-pack nutrition rules and barcode tracking standards instead of ordering pre-printed containers. A randomized experiment of 5,636 grocery shoppers in the United States published in the American Journal of Preventive Medicine in December 2025 found that clear front-of-package nutrition boxes improved shopper identification of healthier foods by 18.4 percentage points, showing why food makers are redesigning primary package labels [1]. Bottling plants and contract packers rely on self-adhesive rolls because they run cleanly on fast labeling lines without wet glue pots, putting Pressure-Sensitive Labels at 48.3% of application format demand in 2026 as converters supply pressure-sensitive tapes and labels for bottles, jars, and pouches. Even so, disposal fees for used backing paper and strict food-safe ink testing continue to put pressure on converter profit margins.
Key Market Trends & Insights
- By application format: Pressure-Sensitive Labels are projected to capture 48.3% in 2026 because pre-coated acrylic and hot-melt emulsion constructions run cleanly on automated rotary labeling heads.
- By facestock substrate: Polyolefin & PET Film is estimated to command 53.1% in 2026 as beverage, household chemical, and personal care brands specify moisture-resistant biaxially oriented polypropylene (BOPP), polyethylene (PE), and glycol-modified polyethylene terephthalate (PETG) films.
- By printing process: Narrow-Web Flexographic is expected to account for 43.9% in 2026 due to low unit ink costs and inline rotary die-cutting on high-volume consumer goods runs.
- By procurement channel: Direct Converter Contracts are forecast to generate 62.8% in 2026 as multinational food and pharmaceutical companies lock in multi-plant roll-stock pricing and color consistency audits.
- By sustainability grade: Recyclable & PCR Stock is anticipated to hold 58.6% in 2026 as brand owners adopt wash-off adhesives and post-consumer recycled film facestocks to meet statutory packaging recyclability targets.
Regional Highlights
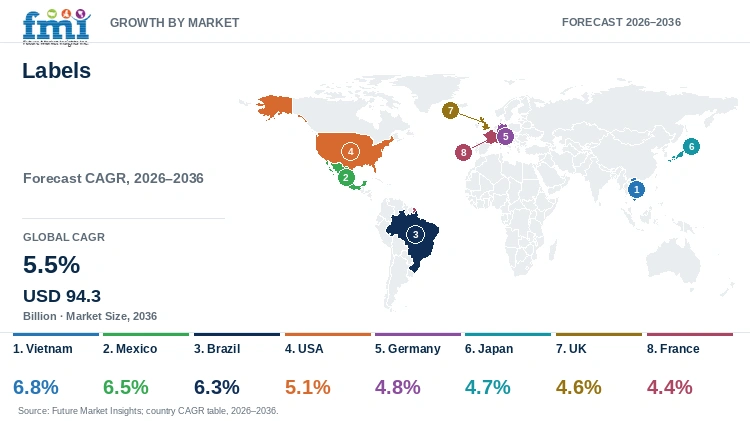
- Top national expansion: Vietnam is projected to lead national growth at a 6.8% CAGR through 2036, supported by export-oriented electronics, apparel, and packaged food manufacturing corridors.
- Broader country progression: Mexico is expected to expand at a 6.5% CAGR ahead of Brazil (6.3%), the United States (5.1%), Germany (4.8%), Japan (4.7%), the United Kingdom (4.6%), and France (4.4%).
Market Size & Forecast
Table 1: Market Size and Forecast for the Labels Market (USD billion and CAGR percentage), 2025 to 2036
| Metric | Value |
|---|---|
| 2025 Market Size | USD 52.3 billion |
| Estimated Market Size in 2026 | USD 55.2 billion |
| Projected Market Size by 2036 | USD 94.3 billion |
| CAGR, 2026 to 2036 | 5.5% |
| Added Revenue, 2026 to 2036 | USD 39.1 billion |
Food, beverage, and personal care brands face tighter supermarket shelf deadlines as health agencies enforce clearer nutrition boxes and allergen warnings on front labels. An online randomized controlled trial published in The Lancet Public Health in April 2026 evaluating 13,929 adults in the United States showed that front-of-package labels listing high saturated fat, sodium, and added sugars reduced shopper selection of unhealthy foods by 5.0 to 7.7 percentage points [2]. To handle frequent label artwork updates across hundreds of product varieties without long press stops, converters pair flexographic presses with in-mold label systems for dairy tubs, rigid lids, and household cleaner bottles.
Converted Roll-Stock and Container Volume Sizing
Table 2: Converted Roll-Stock and Container Volume Sizing for the Labels Market (USD billion and volume indicators), 2025 to 2036
| Metric | 2025 | 2026 | 2036 |
|---|---|---|---|
| Market size (USD billion) | 52.3 | 55.2 | 94.3 |
| Converted label stock area (billion sq meters) | 74.5 to 78.0 | 78.2 to 82.0 | 124.0 to 131.5 |
| Labeled primary packaging units (trillion units) | 3.1 to 3.3 | 3.3 to 3.5 | 5.1 to 5.5 |
| Average converter realization per sq meter (USD) | 0.67 to 0.70 | 0.67 to 0.71 | 0.72 to 0.76 |
Operational note: Converted square-meter volume ranges reconcile narrow-web and mid-web press throughput against average facestock caliper weights across pressure-sensitive, wet-glue, sleeve, and in-mold converting lines.
High-speed bottling lines and retail fulfillment centers need smooth release liners and tear-resistant label rolls so webs do not snap on fast applicators. Packaging lines are adopting digital label printing equipment to print 2D GS1 barcodes, batch numbers, and local language panels right on the packing line without stopping main printing presses.
Per Capita & Converter Plant Sizing
Table 3: Per Capita and Converter Plant Indicators for the Labels Market (USD and percentage ranges), 2025 to 2036
| Metric | 2025 | 2026 | 2036 |
|---|---|---|---|
| World population (billion) | 8.2 | 8.3 | 9.0 |
| Label spend per capita (USD) | 6.4 | 6.7 | 10.5 |
| Annual label procurement per CPG plant (USD thousand) | 410.0 to 460.0 | 430.0 to 485.0 | 680.0 to 760.0 |
| Multi-year converter contract share (%) | 59.0% to 63.0% | 61.0% to 65.0% | 68.0% to 72.0% |
Table 4: Converter Plant & Packaging Line Indicators for the Labels Market (USD billion and plant allocations), 2026
| Metric | Value | Institutional Reference Basis |
|---|---|---|
| Market size, 2026 | USD 55.2 billion | 2026 global industry valuation baseline |
| Commercial label converting plants | 14,200 plants | Active narrow-web, mid-web, and sleeve converter facilities |
| Average annual output per plant | USD 3.89 thousand per 1,000 sq m | Normalized commercial converter press realization |
| Direct converter contract allocation, 2026 | USD 34.7 billion | 62.8% procurement channel segment allocation |
E-commerce warehouses and cold-storage depots depend on clear, smudge-free barcodes across damp cardboard boxes, mailing bags, and plastic crates. Fulfillment centers install industrial label printers along conveyor lanes to apply high-contrast routing tags that stay readable through freezer storage and parcel delivery.
Analyst Perspective
"Packaging converters can no longer compete on press speed alone. Brand procurement teams now demand mono-material polyolefin facestocks with certified wash-off adhesives that separate cleanly in hot caustic recycling baths while running at full rotary applicator speed."
- Nandini Roy Choudhury, Principal Consultant - Packaging & Materials, Future Market Insights.
How is the labels market segmented?
The labels market is segmented by application format, facestock substrate, printing process, procurement channel, and sustainability grade. In 2026, Pressure-Sensitive Labels are projected at 48.3%, Polyolefin & PET Film at 53.1%, Narrow-Web Flexographic at 43.9%, Direct Converter Contracts at 62.8%, and Recyclable & PCR Stock at 58.6%.
By application format: Pressure-Sensitive Labels, Wet-Glue Wrap Labels, Heat-Shrink Sleeve Labels, and In-Mold Labels.
By facestock substrate: Polyolefin & PET Film, Coated & Thermal Paper, and Foil & Bio-Based Stock.
By printing process: Narrow-Web Flexographic, Digital Inkjet & Toner, and Rotogravure & Offset.
By procurement channel: Direct Converter Contracts, Packaging Distributors, e-Commerce B2B Portals, and Others.
By sustainability grade: Recyclable & PCR Stock, FSC & Compostable Stock, Wash-Off Caustic Stock, Linerless Direct Stock, and Others.
Why do Pressure-Sensitive Labels lead the application format category?
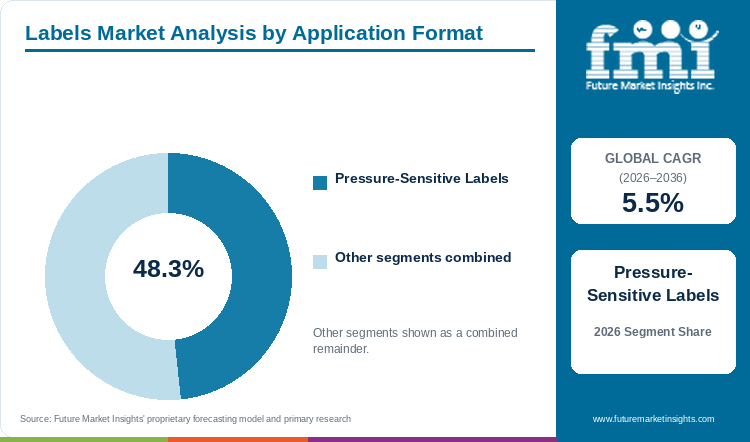
Pressure-Sensitive Labels are projected to capture 48.3% of application format demand in 2026, supported by clean rotary die-cutting and no-label-look film clarity.
Table 5: Application Format Share for the Labels Market (percentage share), 2026
| Application Format | Share (2026) |
|---|---|
| Pressure-Sensitive Labels | 48.3% |
| Other Segments Combined | 51.7%* |
| Total | 100.0% |
*Note: Remaining application format categories sum to 100.0% of 2026 industry volume.
Table 6: Application Format Leadership and Market Growth for the Labels Market (segment name and CAGR percentage), 2026 to 2036
| Metric | Value |
|---|---|
| Global CAGR (2026 to 2036) | 5.5% |
| Leading Segment | Pressure-Sensitive Labels |
Beverage, personal care, and medicine filling lines favor pressure-sensitive rolls because pre-coated adhesive backing removes the need for messy wet-glue pots and drying ovens on the factory floor. Converters laminate clear polypropylene film onto thin PET liners to supply self-adhesive label stock that wrap smoothly around curved glass and squeezable plastic bottles without wrinkling.
- Pressure-Sensitive Labels are projected to secure 48.3% of application format valuation in 2026, whereas Wet-Glue Wrap Labels, Heat-Shrink Sleeve Labels, and In-Mold Labels serve high-speed returnable beer bottles, 360-degree contoured dairy cups, and injection-molded tubs.
- In February 2026, Avery Dennison Corporation reported full-year 2025 net revenue of USD 8.9 billion, with its Materials Group generating USD 6.09 billion across pressure-sensitive label materials, graphics films, and performance polymers [3].
Why does Polyolefin & PET Film define the largest facestock substrate segment?
Polyolefin & PET Film is estimated to secure 53.1% of the facestock substrate category in 2026, driven by mono-material bottle recyclability and moisture resistance.
Using the same plastic family for both the label film and the bottle body prevents contamination when empty containers are washed and shredded at recycling plants. Beverage and personal care packers order polypropylene, polyethylene, and PETG film custom printed labels so shampoo tubes and chilled drink bottles keep their print gloss inside wet store coolers.
- Polyolefin & PET Film is estimated to command 53.1% of the facestock substrate segment in 2026, while Coated & Thermal Paper and Foil & Bio-Based Stock address dry grocery cartons, variable-weight deli scales, and wine bottle neck bands.
- Research published in the Journal of Food Science in February 2026 examining polyolefin recycling under European Union food-contact rules confirmed that mono-material polypropylene and polyethylene packaging designs reduce sorting contamination during closed-loop mechanical reprocessing [4].
What keeps Narrow-Web Flexographic ahead by printing process?
Narrow-Web Flexographic is expected to command 43.9% of printing process volume in 2026, supported by high-speed UV-LED curing and inline cold-foil embellishment.
Eight- to ten-color narrow-web and mid-web flexographic presses deliver low cost per thousand labels across medium and long grocery production runs. Press operators pair fast UV-LED curing lamps with automatic camera registration to print linerless label rolls and multi-page peel-back instruction labels in a single pass.
- Narrow-Web Flexographic is expected to hold 43.9% of printing process valuation in 2026, whereas Digital Inkjet & Toner and Rotogravure & Offset capture short-run seasonal promotions and ultra-long beverage wrap-around orders.
- A food-contact migration study published in the Journal of Food Science in May 2025 demonstrated that properly cured low-migration printing inks and acrylic adhesives prevent photoinitiator transfer across thin food packaging substrates [5].
Why do Direct Converter Contracts lead the procurement channel category?
Direct Converter Contracts are forecast to generate 62.8% of procurement channel valuation in 2026, owing to multi-plant SLA pricing and automated vendor-managed inventory.
Multinational food, beverage, and healthcare manufacturers negotiate multi-year supply agreements directly with regional and multi-plant label converters to lock in raw film indexation formulas and pantone color Delta-E tolerances. Direct contracting allows brand packaging engineers to co-develop custom die profiles, RFID inlays, and serialized anti-counterfeiting micro-text with dedicated press quality teams.
- Direct Converter Contracts are forecast to account for 62.8% of procurement channel demand in 2026, while Packaging Distributors and e-Commerce B2B Portals supply stock thermal rolls and short-run custom labels to small and mid-sized enterprises.
- In May 2026, Fedrigoni S.p.A. reported fiscal 2025 revenue of EUR 1.9 billion and adjusted EBITDA of EUR 0.30 billion, with its Self-Adhesives and RFID division accounting for 64% of group turnover through direct converter supply networks [6].
What gives Recyclable & PCR Stock the leading position in sustainability grade?
Recyclable & PCR Stock is anticipated to account for 58.6% of sustainability grade demand in 2026, reinforced by statutory recycled-content mandates and caustic wash-off adhesives.
Extended Producer Responsibility fee modulations penalize packaging formats where label adhesives or incompatible inks darken recycled PET and polyolefin pellet streams. Converters formulate Recyclable & PCR Stock with 30% to 50% mechanically or chemically recycled resin content and pair those facestocks with alkali-soluble emulsions that detach cleanly at 65 to 80 degrees Celsius.
- Recyclable & PCR Stock is anticipated to capture 58.6% of sustainability grade valuation in 2026, ahead of FSC & Compostable Stock used on organic produce trays and paperboard courier parcels.
- An enzymatic depolymerization study published in ACS Sustainable Chemistry & Engineering in May 2025 showed that targeted hydrolase pretreatment of multilayer PET-PE packaging films recovers clean monomer streams for closed-loop resynthesis [7].
What are the drivers, restraints, and opportunities in the labels market?
In the labels market, mandatory front-of-pack nutrition and digital product passport laws expand variable-data roll consumption whereas silicone release liner waste restrains margin expansion and smart freshness-sensing labels create commercial growth opportunities.
- Driver: Mandatory front-of-package nutrition warning rules, serialized pharmaceutical traceability laws, and e-commerce parcel barcode routing convert variable-data labels into non-discretionary packaging components.
- Restraint: Silicone-coated glassine and PET release liner disposal costs and low-migration UV photoinitiator compliance testing raise converter working capital requirements.
- Opportunity: Integrating colorimetric pH freshness indicators, digital sorting watermarks, and battery-free UHF RFID inlays into primary labels opens higher-margin contract tiers.
Growth Analysis and Future Potential: Qualitative Demand Catalysts
Online retail warehouses and grocery distribution centers are replacing loose paper packing slips with automated print-and-apply labelers that track every box from shelf to doorstep. A plastics sorting study published in Polymers in April 2025 showed that invisible digital watermarks printed on package labels improve optical sorting accuracy and cut recycled polypropylene processing costs by up to 30% [8]. Warehouse operators pair overhead barcode scanners with direct thermal labels to keep tracking codes readable across humid loading docks.
Risk Assessment of the Labels Market: Operational and Formulation Friction
Strict limits on chemical transfer from printing inks and adhesives into food require label converters to test every batch before supplying grocery packers. A food-packaging safety review published in Foods in February 2026 noted that European Union Regulation 2025/40 bans per- and polyfluoroalkyl substances (PFAS) in food-contact packaging from August 2026, forcing makers to reformulate barrier coatings and primers [9]. In healthcare packaging, brand security teams order tamper-evident security labels made with ultra-thin tamper films that tear visibly if a medicine carton is opened.
Commercial Opportunity Analysis: Smart Indicators and Industrial Durability
Meat, poultry, and seafood packers are testing color-changing freshness patches inside chilled trays so grocers and shoppers can check remaining shelf life at a glance. A smart-packaging review published in Food Research International in July 2025 confirmed that smartphone-readable pH and dye indicators mounted on meat packages track spoilage gases accurately during cold storage [10]. For heavy industrial drums, chemical makers specify chemical hazard drum labels printed on weather-resistant polyester film that survives salt water and solvent spills.
Labels Market by Country (2026 to 2036)
As per FMI, Vietnam is projected to lead labels market growth across tracked nations at a 6.8% CAGR between 2026 and 2036, followed by Mexico (6.5%), Brazil (6.3%), the USA (5.1%), Germany (4.8%), Japan (4.7%), the UK (4.6%), and France (4.4%).
Table 7: Country CAGR and Primary Growth Levers for the Labels Market (CAGR percentage), 2026 to 2036
| Country | CAGR (2026 to 2036) | Primary Growth Lever |
|---|---|---|
| Vietnam | 6.8% | Export electronics, apparel barcode tagging, and packaged food processing expansion |
| Mexico | 6.5% | Nearshoring consumer goods plants and NOM-051 octagonal warning label compliance |
| Brazil | 6.3% | ANVISA RDC 429 front-of-pack magnifying glass nutrition labels and beverage bottling |
| USA | 5.1% | FDA front-of-package nutrition proposals and DSCSA serialized pharmaceutical labels |
| Germany | 4.8% | EU PPWR 2025/40 recyclability sorting labels and high-speed slitting capacity |
| Japan | 4.7% | Ultra-thin linerless thermal food labels and automated convenience-store logistics |
| UK | 4.6% | Extended Producer Responsibility recyclability labeling and digital hybrid printing |
| France | 4.4% | Mandatory Triman sorting signage, Nutri-Score updates, and wine foil capsules |
Source: Future Market Insights analysis
Vietnam Labels Market Outlook (2026 to 2036)
Export-focused electronics assembly plants, footwear factories, and seafood cold-storage processors in Vietnam are expanding variable-data barcode and environmental sorting label procurement at a 6.8% CAGR through 2036. An empirical survey of urban consumers in Vietnam published in Waste Management & Research in September 2025 found that while 68.2% of respondents recognized general recycling loops on packaging labels, fewer than one-third could distinguish specific polymer resin codes without standardized graphic icons [11]. Domestic converters in Ho Chi Minh City and Bac Ninh are installing mid-web flexographic and thermal-transfer slitting lines to supply multinational export plants.
Key takeaway: In Vietnam, export manufacturing expansion and standardized polymer sorting graphics are projected to sustain a 6.8% CAGR through 2036.
Mexico Labels Market Outlook (2026 to 2036)
Cross-border food, beverage, and automotive component manufacturing in Mexico is projected to drive label demand at a 6.5% CAGR from 2026 to 2036 as plants comply with both NOM-051 warning octagons and North American retail barcode specifications. Materials engineering research from Mexico published in Polymers in May 2026 demonstrated that hybrid paper-polymer packaging structures cut virgin plastic resin usage by 37% and adhesive consumption by 50% while preserving wet mechanical strength [12]. Regional converters in Monterrey, Guadalajara, and Querétaro are expanding BOPP film and wash-off adhesive capacity for export beverage bottlers.
Key takeaway: In Mexico, nearshoring packaging lines and low-adhesive hybrid paper-film substrates are expected to support a 6.5% CAGR through 2036.
Brazil Labels Market Outlook (2026 to 2036)
Mandatory front-of-pack high-sugar, saturated-fat, and sodium magnifying-glass warnings under ANVISA Resolution RDC No. 429 are driving label redesigns across grocery and beverage plants in Brazil at a 6.3% CAGR through 2036. A July 2026 study in PLOS One applying Brazil's RDC 429 front-of-pack nutritional criteria across 994 food brand posts found that 61.28% of marketed food items exceeded statutory nutrient thresholds requiring warning disclosures [13]. Beer, soft-drink, and farm-chemical bottlers across São Paulo and Paraná continue to order wet-glue and pressure-sensitive BOPP roll stock in high volumes.
Key takeaway: In Brazil, ANVISA front-of-pack nutrition compliance and high-speed beverage bottling are forecast to drive a 6.3% CAGR through 2036.
USA Labels Market Outlook (2026 to 2036)
Demand in the USA is projected to advance at a 5.1% CAGR between 2026 and 2036 as food processors prepare for federal front-of-package nutrition boxes and pharmaceutical distributors enforce unit-level Drug Supply Chain Security Act (DSCSA) serialization. In May 2025, the U.S. Food and Drug Administration published its formal rulemaking dossier proposing a mandatory front-of-package Nutrition Info box detailing saturated fat, sodium, and added sugars as Low, Medium, or High on packaged foods [14]. North American converters are also scaling RFID-enabled smart labels and linerless direct-thermal rolls for omnichannel grocery fulfillment.
Key takeaway: In the USA, federal front-of-package nutrition rulemaking and unit-level retail RFID mandates are projected to anchor a 5.1% CAGR through 2036.
Germany Labels Market Outlook (2026 to 2036)
Packaging converters in Germany are projected to expand at a 4.8% CAGR through 2036 as consumer brands re-engineer label adhesives and inks to meet European Union recyclability grades before mandatory harmonized sorting symbols take effect. In April 2025, Fedrigoni S.p.A. announced a new 6,400-square-meter self-adhesive slitting and distribution center near Cologne, Germany, capable of processing 90,000,000 square meters of film and paper label materials annually for central European converters [15]. Automotive, pharmaceutical, and beverage plants across North Rhine-Westphalia and Bavaria prioritize wash-off polyolefin films and high-speed narrow-web flexo runs.
Key takeaway: In Germany, automated slitting investments and EU recyclability sorting compliance are estimated to support a 4.8% CAGR through 2036.
Japan Labels Market Outlook (2026 to 2036)
Retail convenience stores, pharmaceutical packers, and electronics manufacturers in Japan are forecast to expand label demand at a 4.7% CAGR through 2036 by adopting ultra-thin 38-micron film facestocks and silicone-free linerless thermal rolls. Pharmaceutical engineering research published in Pharmaceutics in January 2026 demonstrated that high-contrast machine-readable QR codes and variable optical markings improve automated medication authentication without damaging barrier coatings [16]. Converters in Tokyo and Osaka specialize in precision die-cut security seals, multi-layer peel-back clinical trial labels, and tack-controlled bento box wraps.
Key takeaway: In Japan, ultra-thin linerless thermal rolls and high-precision pharmaceutical security labels are projected to sustain a 4.7% CAGR through 2036.
UK Labels Market Outlook (2026 to 2036)
Supermarket private-label suppliers and contract beverage packers in the UK are projected to grow at a 4.6% CAGR from 2026 to 2036 as Extended Producer Responsibility fee schedules reward mono-material polyolefin labels and QR-linked digital authentication. A February 2026 study in Scientific Reports demonstrated that combining smart packaging QR codes with computer-vision verification detects counterfeit pharmaceutical and consumer packs in real time using standard optical cameras [17]. Converters in the Midlands and Yorkshire are adding hybrid digital-flexo presses to serve rapid supermarket promotional cycles.
Key takeaway: In the UK, Extended Producer Responsibility fee modulation and QR-linked pack verification are forecast to drive a 4.6% CAGR through 2036.
France Labels Market Outlook (2026 to 2036)
Cosmetics, luxury wine and spirits, and gourmet food producers in France are projected to expand label procurement at a 4.4% CAGR through 2036 under European Union Packaging and Packaging Waste Regulation (PPWR) sorting rules and updated Nutri-Score algorithms. On August 11, 2026, the European Commission confirmed that Regulation (EU) 2025/40 on packaging and packaging waste entered into general application on August 12, 2026, establishing binding design-for-recycling rules and harmonized material sorting labels across member states [18]. Converters in France combine hot-foil embossed textured papers for vineyards with wash-off clear BOPP labels for reusable glass jars.
Key takeaway: In France, binding EU PPWR sorting label rules and textured wine and cosmetics labeling are expected to support a 4.4% CAGR through 2036.
Full report country CAGRs cover: North America; Latin America; Western Europe; Eastern Europe; East Asia; South Asia and Pacific; Middle East and Africa.
Who are the notable companies in the labels market?
Avery Dennison Corporation, CCL Industries Inc., Multi-Color Corporation, UPM Raflatac, Fedrigoni S.p.A., Constantia Flexibles, Brady Corporation, and Lintec Corporation are the notable companies in the labels market.
FMI analysis indicates that competition in the commercial labels industry divides between vertically integrated roll-stock material Coat-and-Slit producers, multi-plant label converters serving multinational food and beverage brands, and specialized industrial identification manufacturers.
- Pressure-Sensitive Roll-Stock Leaders: Avery Dennison Corporation, UPM Raflatac, and Fedrigoni S.p.A. coat acrylic, hot-melt, and wash-off adhesives onto paper and polymer film webs for distribution to commercial converters.
- Global Multi-Format Label Converters: CCL Industries Inc., Multi-Color Corporation, and Constantia Flexibles operate narrow-web flexo, digital inkjet, rotogravure, and in-mold label presses for multinational consumer goods companies.
- Specialty & Industrial Identification Producers: Brady Corporation and Lintec Corporation manufacture high-durability chemical drum labels, cleanroom electronics tags, and tamper-evident pharmaceutical seals.
Competitive Benchmarking: Labels Market
Table 8: Competitive Benchmarking for the Labels Market (qualitative capability tiers), 2026
| Company | Roll-Stock Coating Breadth | Multi-Process Converting Depth | Recyclable & RFID Innovation | Geographic Reach |
|---|---|---|---|---|
| Avery Dennison Corporation | High | High | High | High |
| CCL Industries Inc. | Medium | High | High | High |
| Multi-Color Corporation | Medium | High | High | High |
| UPM Raflatac | High | Medium | High | High |
| Fedrigoni S.p.A. | High | Medium | High | High |
| Constantia Flexibles | Medium | High | Medium | High |
| Brady Corporation | Medium | High | Medium | High |
| Lintec Corporation | High | Medium | Medium | Medium |
Scoring basis: Capability tiers evaluate documented pressure-sensitive adhesive coating capacity, narrow-web and in-mold converting footprint, certified APR and RecyClass wash-off portfolios, and multi-region slitting distribution across North America, Europe, Latin America, and Asia-Pacific.
Key Developments in the Labels Market
- Avery Dennison Corporation reported first-quarter 2026 net revenue of USD 2.30 billion in April 2026, up 7.0% year-over-year, with Materials Group revenue reaching USD 1.65 billion across label and graphic materials [19].
- Multi-Color Corporation (MCC Global IML) announced a major North American manufacturing expansion at its Founders facility in October 2026 to scale next-generation in-mold label production for injection-molded and thermoformed rigid containers [20].
- Avery Dennison Corporation reported second-quarter 2026 net revenue of USD 2.46 billion in July 2026, up 10.9% year-over-year, supported by USD 1.80 billion in Materials Group label stock shipments and intelligent label adoption [21].
Key Players in the Labels Market
Pressure-Sensitive Roll-Stock Material Producers
- Avery Dennison Corporation
- UPM Raflatac
- Fedrigoni S.p.A.
Global Multi-Process Label Converters
- CCL Industries Inc.
- Multi-Color Corporation
- Constantia Flexibles
Specialty & Industrial Identification Specialists
- Brady Corporation
- Lintec Corporation
Labels Market - Report Scope
Table 9: Report Scope for the Labels Market (coverage fields and definitions), 2026 to 2036
| Coverage field | Report scope |
|---|---|
| Market breakdown | Application Format; Facestock Substrate; Printing Process; Procurement Channel; Sustainability Grade |
| Quantitative Units | USD Billion |
| Market Definition | Includes commercial revenue from converted labels and self-adhesive label roll stock across pressure-sensitive, wet-glue, heat-shrink/stretch sleeve, and in-mold formats. Category Scope Note: Excludes corrugated shipping cartons, direct-to-shape container screen printing without a discrete label substrate, and standalone hang-tag strings. |
| Regions Covered | North America; Latin America; Western Europe; Eastern Europe; East Asia; South Asia and Pacific; Middle East and Africa |
| Countries Covered | Vietnam, Mexico, Brazil, USA, Germany, Japan, UK, France, and additional countries in the full report |
| Key Companies Covered | Avery Dennison Corporation, CCL Industries Inc., Multi-Color Corporation, UPM Raflatac, Fedrigoni S.p.A., Constantia Flexibles, Brady Corporation, Lintec Corporation |
| Forecast Period | 2026 to 2036 |
| Approach | Primary and secondary research with top-down and bottom-up market triangulation. |
Labels Market - Research Methodology
Table 10: Research Methodology for the Labels Market (research methods and analytical approach), 2026
| Method | Approach |
|---|---|
| Primary Research | Structured interviews with narrow-web and mid-web label converters, pressure-sensitive roll-stock coating directors, CPG packaging procurement managers, and rotary labeling machinery OEMs. |
| Secondary Research | Analysis of corporate annual and quarterly filings, SEC EDGAR disclosures, FDA and European Commission packaging regulations, and peer-reviewed polymer and food-packaging journals. |
| Market Sizing and Forecasting | Top-down converter revenue models reconciled against bottom-up square-meter roll-stock coating capacity and primary packaged goods unit volumes from 2026 to 2036. |
| Country Forecasting Model | Country projections weight packaged food and beverage output, pharmaceutical serialization mandates, e-commerce parcel shipment growth, and EU PPWR / FDA nutrition labeling schedules across eight national markets. |
| Operational Benchmark Traceability | Roll-stock area and plant benchmarks in Tables 2, 3, and 4 trace to Avery Dennison and Fedrigoni slitting capacity disclosures, ACS and Polymers recycling trials, and FDA front-of-package rulemaking dockets. |
| Data Triangulation and Validation | Demand estimates are cross-checked against pressure-sensitive laminate shipments and converter press use without double counting raw base film sold prior to adhesive coating. |
Labels Market by Segments
Labels Market segmented by Application Format:
- Pressure-Sensitive Labels
- Wet-Glue Wrap Labels
- Heat-Shrink Sleeve Labels
- In-Mold Labels
Labels Market segmented by Facestock Substrate:
- Polyolefin & PET Film
- Coated & Thermal Paper
- Foil & Bio-Based Stock
Labels Market segmented by Printing Process:
- Narrow-Web Flexographic
- Digital Inkjet & Toner
- Rotogravure & Offset
Labels Market segmented by Procurement Channel:
- Direct Converter Contracts
- Packaging Distributors
- e-Commerce B2B Portals
- Others
Labels Market segmented by Sustainability Grade:
- Recyclable & PCR Stock
- FSC & Compostable Stock
- Wash-Off Caustic Stock
- Linerless Direct Stock
- Others
Labels Market by Region
- North America
- United States
- Canada
- Latin America
- Brazil
- Mexico
- Argentina
- Chile
- Western Europe
- Germany
- France
- United Kingdom
- Italy
- Spain
- Benelux
- Nordics
- Eastern Europe
- Poland
- Czech Republic
- Romania
- Hungary
- East Asia
- China
- Japan
- South Korea
- South Asia and Pacific
- India
- ASEAN
- Australia and New Zealand
- Middle East and Africa
- GCC Countries
- South Africa
- Türkiye
- Israel
Research Sources and Bibliography
- [1] Huang, Y., O'Sullivan, K., Block, J. P., Petimar, J., Lee, C. J. Y., & Grummon, A. H.. (2025, December 13). Impact of the Food and Drug Administration's Proposed Front-of-Package Label and Alternative Designs on Consumer Understanding: A Randomized Experiment. American Journal of Preventive Medicine, 70(5), 108222 (PubMed PMID 41397534).
- [2] Lemmon, B., Grummon, A. H., Marquez, A., Soederberg Miller, L. M., Au, L. E., Brown, S. D., Wang, A., Powell, L. M., & Falbe, J.. (2026, April 1). Efficacy of front-of-package nutrient labels designed for mandatory implementation in the USA: an online randomised controlled trial. The Lancet Public Health, 11(4), e221-e232 (PubMed PMID 41887825).
- [3] Avery Dennison Corporation. (2026, February 4). Avery Dennison Announces Fourth Quarter and Full Year 2025 Results. Avery Dennison Investor Relations.
- [4] Sharmin, N., Bandyopadhyay, S., Radusin, T., Li, K. D., Larsen, H., Hed, Y., & Pettersen, M. K.. (2026, February 1). An Overview of Enhancing Polyolefin Recycling in Food Packaging: Navigating New EU Regulations and Design for Recycling. Journal of Food Science, 91(2), e70856 (PubMed PMID 41607276).
- [5] Seref, N., & Cufaoglu, G.. (2025, May 1). Food Packaging and Chemical Migration: A Food Safety Perspective. Journal of Food Science, 90(5), e70265 (PubMed PMID 40401309).
- [6] Fedrigoni S.p.A.. (2026, May 28). Fedrigoni closes 2025 with growth in revenue and EBITDA, a resilient performance delivered against a backdrop of pronounced macroeconomic and geopolitical uncertainty. Fedrigoni Newsroom.
- [7] van Vliet, D. M., Mateman, J. J., van de Vondervoort, R. H. A. M., Moers, A. P. H. A., Collazo, L., Mencher, A., Werten, M. W. T., Thiyagarajan, S., Cordes, A., Sonnendecker, C., Thoden van Velzen, E. U., Doménech-Mata, R., Tamayo-Ramos, J. A., Julsing, M. K., & Ewing, T. A.. (2025, May 29). Efficient Recycling of PET-PE Multilayer Packaging Materials Based on Enzymatic Depolymerization of PET. ACS Sustainable Chemistry & Engineering, 13(22), 8212-8219 (PubMed PMID 40510915).
- [8] Rumetshofer, T., & Fischer, J.. (2025, April 25). Enhancement in Post-Consumer Mechanical Recycling of Plastics: Role of Design for Recycling, Specifications, and Efficient Sorting of Packaging Material. Polymers, 17(9), 1177 (PubMed PMID 40362962).
- [9] Ntzimani, A., & Tsironi, T.. (2026, February 5). Balancing Functionality and Safety in Food Packaging Coatings. Foods, 15(3), 571 (PubMed PMID 41683158).
- [10] Ehtesabi, H., & Afkaneh, S. Z.. (2025, July 31). Smartphone-based label on package for monitoring the freshness of meat: a review. Food Research International, 220, 117169 (PubMed PMID 41074378).
- [11] Lam, V. S., Nguyen, T. H. T., Tran, B. C., Nguyen, Q. C., Nguyen, L. T. V., Cap, H. M. N., & Nguyen, X. C.. (2025, September 9). Decoding plastic recycling in Vietnam: Packaging design, consumer recognition and model-based exploration. Waste Management & Research, 43(9), 734242X251366841 (PubMed PMID 40923563).
- [12] Bernal-Carrillo, J. G., Dehonor-Gómez, M., Lugo, L. E., Susunaga Notario, A. D. C., Mercado-Lemus, V. H., Betancourt-Cantera, J. A., Pérez-Bustamante, R., García-Herrera, J. E., Arcos-Gutiérrez, H., & Garduño, I. E.. (2026, May 13). Redesigning Flexible Food Packaging for the Circular Economy: A Comparative Assessment of Hybrid Paper-Based Solutions. Polymers, 18(10), 1197 (PubMed PMID 42198138).
- [13] Matos, J. P., Araújo, B. L. S. G., Ribeiro, M., Mais, L. A., & Horta, P. M.. (2026, July 17). Applying Brazilian front-of-pack nutrition labeling and PAHO nutritional criteria to digital food advertising: regulatory implications for protecting children and adolescents. PLOS One, 21(7), e0354180 (PubMed PMID 42467727).
- [14] U.S. Food and Drug Administration. (2025, May 8). Front-of-Package Nutrition Labeling. U.S. Department of Health and Human Services, FDA (Docket No. FDA-2024-N-2910).
- [15] Fedrigoni S.p.A.. (2025, April 10). Fedrigoni Self-Adhesives: new slitting centre to open in Germany. Fedrigoni Newsroom.
- [16] Shammout, H., Hopp, B., Smausz, T., Bohus, J., Jójárt-Laczkovich, O., Cseh, M., Kopniczky, J., Tari, B., Saker, R., Kristó, K., Sovány, T., & Ludasi, K.. (2026, January 6). Laser-Based QR Code Marking on Double Film-Coated Tablets: Balancing Marking Efficiency and Tablet Integrity-A Step Toward Safer Medicines. Pharmaceutics, 18(1), 73 (PubMed PMID 41599181).
- [17] Harshvardhan, K., Parikh, V., Prithviraj, S. K., Sanjay, D., & Rajay Vedaraj, I. S.. (2026, February 18). A framework for enhancing pharmaceutical integrity and patient safety: novel mobile health solution integrating smart packaging and computer vision. Scientific Reports, 16(1), 9777 (PubMed PMID 41708716).
- [18] European Commission Directorate-General for Environment. (2026, August 11). New EU packaging rules start to apply, including restrictions on PFAS in food-contact packaging. European Commission Environment News (Regulation EU 2025/40).
- [19] Avery Dennison Corporation. (2026, April 28). Avery Dennison Announces First Quarter 2026 Results. Avery Dennison Investor Relations.
- [20] Multi-Color Corporation (MCC Global IML). (2026, October 8). MCC Global IML expansion brings next-generation IML manufacturing to its Founders site. In-Mold Decorating Association.
- [21] Avery Dennison Corporation. (2026, July 30). Avery Dennison Announces Second Quarter 2026 Results. Avery Dennison Investor Relations.
- [22] Multi-Color Corporation (MCC Global IML). (2025, September 15). A hattrick for MCC Global IML with 3 wins at the 2025 IMDA awards. In-Mold Decorating Association.
- [23] Smorenburg, H., Kissock, K. R., Beck, E. J., Mathur, P., Hamaker, B., Lissner, L., Marostica, M. R., Jr., Nnam, N., Takimoto, H., & Roodenburg, A. J. C.. (2026, January 14). Revision of the Choices Nutrient Profiling System. Nutrients, 18(2), 258 (PubMed PMID 41599871).
This bibliography is provided for reader reference and is not exhaustive. The full report contains additional primary and secondary sources validated during the research study.
This Report Answers
- How large is the labels market in 2026 and what is forecast for 2036?
- Which regulatory and packaging pressures support demand for commercial labels?
- Why do Pressure-Sensitive Labels lead the application format category?
- Why does Polyolefin & PET Film lead the facestock substrate category?
- How do growth rates differ across Vietnam, Mexico, Brazil, and the USA?
- Which leading companies supply label roll stock and converted labels today?
- What limits rapid press conversion or supplier switching in the labels market?
- What should packaging buyers evaluate before contracting a label converter?
Table of Content
Table of Content
- Key Takeaways
- Market Size and CAGR
- Top Growth Driver
- Fastest Growing Segment
- Leading Region
- Key Companies
- Emerging Opportunities
- Executive Summary
- Global Market Outlook
- Demand-side Trends
- Supply-side Trends
- Technology Roadmap Analysis
- Analysis and Recommendations
- Analyst Perspective (What is happening? Why now? What should investors know?)
- Key Questions Answered
- How large is the market?
- What is the CAGR?
- What are key trends?
- Which region dominates?
- Who are the leaders?
Read More...
- Market Overview
- Market Coverage / Taxonomy
- Market Definition / Scope / Limitations
- Research Methodology
- Chapter Orientation
- Analytical Lens and Working Hypotheses
- Market Structure, Signals, and Trend Drivers
- Benchmarking and Cross-market Comparability
- Market Sizing, Forecasting, and Opportunity Mapping
- Research Design and Evidence Framework
- Desk Research Programme (Secondary Evidence)
- Expert Input and Fieldwork (Primary Evidence)
- Tooling, Models, and Reference Databases
- Data Engineering and Model Build
- Quality Assurance and Audit Trail
- Market Background
- Market Dynamics (Drivers, Restraints, Opportunity, Trends)
- Scenario Forecast (Optimistic, Likely, Conservative)
- Impact Analysis
- AI Impact
- Sustainability Impact
- Regulatory Impact
- Technology Impact
- Consumer / Buyer Analysis
- Purchase Drivers
- Adoption Barriers
- Buyer Journey
- Opportunity Map Analysis
- Product Life Cycle Analysis
- Supply Chain Analysis
- Investment Feasibility Matrix
- Value Chain Analysis
- PESTLE and Porter's Analysis
- Regulatory Landscape
- Regional Parent Market Outlook
- Production and Consumption Statistics
- Import and Export Statistics
- Global Market Analysis and Forecast, 2021 to 2036
- Historical Market Size Value (USD Billion) Analysis, 2021 to 2025
- Current and Future Market Size Value (USD Billion) Projections, 2026 to 2036
- Y-o-Y Growth Trend Analysis
- Absolute $ Opportunity Analysis
- Global Market Pricing Analysis, 2021 to 2036
- Global Market Analysis and Forecast, By Application Format, 2021 to 2036
- Introduction / Key Findings
- Historical Market Size Value (USD Billion) Analysis By Application Format, 2021 to 2025
- Current and Future Market Size Value (USD Billion) Analysis and Forecast By Application Format, 2026 to 2036
- Pressure-Sensitive Labels
- Wet-Glue Wrap Labels
- Heat-Shrink Sleeve Labels
- In-Mold Labels
- Y-o-Y Growth Trend Analysis By Application Format, 2021 to 2025
- Absolute $ Opportunity Analysis By Application Format, 2026 to 2036
- Global Market Analysis and Forecast, By Facestock Substrate, 2021 to 2036
- Introduction / Key Findings
- Historical Market Size Value (USD Billion) Analysis By Facestock Substrate, 2021 to 2025
- Current and Future Market Size Value (USD Billion) Analysis and Forecast By Facestock Substrate, 2026 to 2036
- Polyolefin & PET Film
- Coated & Thermal Paper
- Foil & Bio-Based Stock
- Y-o-Y Growth Trend Analysis By Facestock Substrate, 2021 to 2025
- Absolute $ Opportunity Analysis By Facestock Substrate, 2026 to 2036
- Global Market Analysis and Forecast, By Printing Process, 2021 to 2036
- Introduction / Key Findings
- Historical Market Size Value (USD Billion) Analysis By Printing Process, 2021 to 2025
- Current and Future Market Size Value (USD Billion) Analysis and Forecast By Printing Process, 2026 to 2036
- Narrow-Web Flexographic
- Digital Inkjet & Toner
- Rotogravure & Offset
- Y-o-Y Growth Trend Analysis By Printing Process, 2021 to 2025
- Absolute $ Opportunity Analysis By Printing Process, 2026 to 2036
- Global Market Analysis and Forecast, By Procurement Channel, 2021 to 2036
- Introduction / Key Findings
- Historical Market Size Value (USD Billion) Analysis By Procurement Channel, 2021 to 2025
- Current and Future Market Size Value (USD Billion) Analysis and Forecast By Procurement Channel, 2026 to 2036
- Direct Converter Contracts
- Packaging Distributors
- e-Commerce B2B Portals
- Others
- Y-o-Y Growth Trend Analysis By Procurement Channel, 2021 to 2025
- Absolute $ Opportunity Analysis By Procurement Channel, 2026 to 2036
- Global Market Analysis and Forecast, By Sustainability Grade, 2021 to 2036
- Introduction / Key Findings
- Historical Market Size Value (USD Billion) Analysis By Sustainability Grade, 2021 to 2025
- Current and Future Market Size Value (USD Billion) Analysis and Forecast By Sustainability Grade, 2026 to 2036
- Recyclable & PCR Stock
- FSC & Compostable Stock
- Wash-Off Caustic Stock
- Linerless Direct Stock
- Others
- Y-o-Y Growth Trend Analysis By Sustainability Grade, 2021 to 2025
- Absolute $ Opportunity Analysis By Sustainability Grade, 2026 to 2036
- Global Market Analysis and Forecast, By Region, 2021 to 2036
- Introduction
- Historical Market Size Value (USD Billion) Analysis By Region, 2021 to 2025
- Current Market Size Value (USD Billion) Analysis and Forecast By Region, 2026 to 2036
- North America
- Latin America
- Western Europe
- Eastern Europe
- East Asia
- South Asia and Pacific
- Middle East and Africa
- Market Attractiveness Analysis By Region
- North America Market Analysis and Forecast, By Country, 2021 to 2036
- Historical Market Size Value (USD Billion) Trend Analysis By Market Taxonomy, 2021 to 2025
- Market Size Value (USD Billion) Forecast By Market Taxonomy, 2026 to 2036
- By Country
- United States
- Canada
- By Application Format
- By Facestock Substrate
- By Printing Process
- By Procurement Channel
- By Sustainability Grade
- By Country
- Market Attractiveness Analysis
- By Country
- By Application Format
- By Facestock Substrate
- By Printing Process
- By Procurement Channel
- By Sustainability Grade
- Key Takeaways
- Latin America Market Analysis and Forecast, By Country
- Historical Market Size Value (USD Billion) Trend Analysis By Market Taxonomy, 2021 to 2025
- Market Size Value (USD Billion) Forecast By Market Taxonomy, 2026 to 2036
- By Country
- Brazil
- Mexico
- Argentina
- Chile
- By Application Format
- By Facestock Substrate
- By Printing Process
- By Procurement Channel
- By Sustainability Grade
- By Country
- Market Attractiveness Analysis
- By Country
- By Application Format
- By Facestock Substrate
- By Printing Process
- By Procurement Channel
- By Sustainability Grade
- Key Takeaways
- Western Europe Market Analysis and Forecast, By Country
- Historical Market Size Value (USD Billion) Trend Analysis By Market Taxonomy, 2021 to 2025
- Market Size Value (USD Billion) Forecast By Market Taxonomy, 2026 to 2036
- By Country
- Germany
- France
- United Kingdom
- Italy
- Spain
- Benelux
- Nordics
- By Application Format
- By Facestock Substrate
- By Printing Process
- By Procurement Channel
- By Sustainability Grade
- By Country
- Market Attractiveness Analysis
- By Country
- By Application Format
- By Facestock Substrate
- By Printing Process
- By Procurement Channel
- By Sustainability Grade
- Key Takeaways
- Eastern Europe Market Analysis and Forecast, By Country
- Historical Market Size Value (USD Billion) Trend Analysis By Market Taxonomy, 2021 to 2025
- Market Size Value (USD Billion) Forecast By Market Taxonomy, 2026 to 2036
- By Country
- Poland
- Czech Republic
- Romania
- Hungary
- By Application Format
- By Facestock Substrate
- By Printing Process
- By Procurement Channel
- By Sustainability Grade
- By Country
- Market Attractiveness Analysis
- By Country
- By Application Format
- By Facestock Substrate
- By Printing Process
- By Procurement Channel
- By Sustainability Grade
- Key Takeaways
- East Asia Market Analysis and Forecast, By Country
- Historical Market Size Value (USD Billion) Trend Analysis By Market Taxonomy, 2021 to 2025
- Market Size Value (USD Billion) Forecast By Market Taxonomy, 2026 to 2036
- By Country
- China
- Japan
- South Korea
- By Application Format
- By Facestock Substrate
- By Printing Process
- By Procurement Channel
- By Sustainability Grade
- By Country
- Market Attractiveness Analysis
- By Country
- By Application Format
- By Facestock Substrate
- By Printing Process
- By Procurement Channel
- By Sustainability Grade
- Key Takeaways
- South Asia and Pacific Market Analysis and Forecast, By Country
- Historical Market Size Value (USD Billion) Trend Analysis By Market Taxonomy, 2021 to 2025
- Market Size Value (USD Billion) Forecast By Market Taxonomy, 2026 to 2036
- By Country
- India
- ASEAN
- Australia and New Zealand
- By Application Format
- By Facestock Substrate
- By Printing Process
- By Procurement Channel
- By Sustainability Grade
- By Country
- Market Attractiveness Analysis
- By Country
- By Application Format
- By Facestock Substrate
- By Printing Process
- By Procurement Channel
- By Sustainability Grade
- Key Takeaways
- Middle East and Africa Market Analysis and Forecast, By Country
- Historical Market Size Value (USD Billion) Trend Analysis By Market Taxonomy, 2021 to 2025
- Market Size Value (USD Billion) Forecast By Market Taxonomy, 2026 to 2036
- By Country
- GCC Countries
- South Africa
- Türkiye
- Israel
- By Application Format
- By Facestock Substrate
- By Printing Process
- By Procurement Channel
- By Sustainability Grade
- By Country
- Market Attractiveness Analysis
- By Country
- By Application Format
- By Facestock Substrate
- By Printing Process
- By Procurement Channel
- By Sustainability Grade
- Key Takeaways
- Key Countries Market Analysis
- United States
- Pricing Analysis
- Market Share Analysis, 2025
- By Application Format
- By Facestock Substrate
- By Printing Process
- By Procurement Channel
- By Sustainability Grade
- Canada
- Pricing Analysis
- Market Share Analysis, 2025
- By Application Format
- By Facestock Substrate
- By Printing Process
- By Procurement Channel
- By Sustainability Grade
- Mexico
- Pricing Analysis
- Market Share Analysis, 2025
- By Application Format
- By Facestock Substrate
- By Printing Process
- By Procurement Channel
- By Sustainability Grade
- Brazil
- Pricing Analysis
- Market Share Analysis, 2025
- By Application Format
- By Facestock Substrate
- By Printing Process
- By Procurement Channel
- By Sustainability Grade
- Chile
- Pricing Analysis
- Market Share Analysis, 2025
- By Application Format
- By Facestock Substrate
- By Printing Process
- By Procurement Channel
- By Sustainability Grade
- Germany
- Pricing Analysis
- Market Share Analysis, 2025
- By Application Format
- By Facestock Substrate
- By Printing Process
- By Procurement Channel
- By Sustainability Grade
- United Kingdom
- Pricing Analysis
- Market Share Analysis, 2025
- By Application Format
- By Facestock Substrate
- By Printing Process
- By Procurement Channel
- By Sustainability Grade
- Italy
- Pricing Analysis
- Market Share Analysis, 2025
- By Application Format
- By Facestock Substrate
- By Printing Process
- By Procurement Channel
- By Sustainability Grade
- Spain
- Pricing Analysis
- Market Share Analysis, 2025
- By Application Format
- By Facestock Substrate
- By Printing Process
- By Procurement Channel
- By Sustainability Grade
- France
- Pricing Analysis
- Market Share Analysis, 2025
- By Application Format
- By Facestock Substrate
- By Printing Process
- By Procurement Channel
- By Sustainability Grade
- India
- Pricing Analysis
- Market Share Analysis, 2025
- By Application Format
- By Facestock Substrate
- By Printing Process
- By Procurement Channel
- By Sustainability Grade
- ASEAN
- Pricing Analysis
- Market Share Analysis, 2025
- By Application Format
- By Facestock Substrate
- By Printing Process
- By Procurement Channel
- By Sustainability Grade
- Australia and New Zealand
- Pricing Analysis
- Market Share Analysis, 2025
- By Application Format
- By Facestock Substrate
- By Printing Process
- By Procurement Channel
- By Sustainability Grade
- China
- Pricing Analysis
- Market Share Analysis, 2025
- By Application Format
- By Facestock Substrate
- By Printing Process
- By Procurement Channel
- By Sustainability Grade
- Japan
- Pricing Analysis
- Market Share Analysis, 2025
- By Application Format
- By Facestock Substrate
- By Printing Process
- By Procurement Channel
- By Sustainability Grade
- South Korea
- Pricing Analysis
- Market Share Analysis, 2025
- By Application Format
- By Facestock Substrate
- By Printing Process
- By Procurement Channel
- By Sustainability Grade
- Poland
- Pricing Analysis
- Market Share Analysis, 2025
- By Application Format
- By Facestock Substrate
- By Printing Process
- By Procurement Channel
- By Sustainability Grade
- Hungary
- Pricing Analysis
- Market Share Analysis, 2025
- By Application Format
- By Facestock Substrate
- By Printing Process
- By Procurement Channel
- By Sustainability Grade
- Türkiye
- Pricing Analysis
- Market Share Analysis, 2025
- By Application Format
- By Facestock Substrate
- By Printing Process
- By Procurement Channel
- By Sustainability Grade
- South Africa
- Pricing Analysis
- Market Share Analysis, 2025
- By Application Format
- By Facestock Substrate
- By Printing Process
- By Procurement Channel
- By Sustainability Grade
- Vietnam
- Pricing Analysis
- Market Share Analysis, 2025
- By Application Format
- By Facestock Substrate
- By Printing Process
- By Procurement Channel
- By Sustainability Grade
- United States
- Market Structure Analysis
- Competition Dashboard
- Competition Benchmarking
- Market Share Analysis of Top Players
- By Regional
- By Application Format
- By Facestock Substrate
- By Printing Process
- By Procurement Channel
- By Sustainability Grade
- Emerging Startups
- Innovation Benchmarking
- Competition Analysis
- Competition Deep Dive
- Avery Dennison Corporation
- Overview
- Product Portfolio
- Profitability by Market Segments
- Sales Footprint
- Strategy Overview
- Marketing Strategy
- Product Strategy
- Channel Strategy
- CCL Industries Inc.
- Multi-Color Corporation
- UPM Raflatac
- Fedrigoni S.p.A.
- Constantia Flexibles
- Brady Corporation
- Lintec Corporation
- Avery Dennison Corporation
- Case Studies
- Success Stories
- Recent Developments
- Competition Deep Dive
- Assumptions & Acronyms Used
List of Tables
- Table 1: Global Market Value (USD Billion) Forecast by Region, 2021 to 2036
- Table 2: Global Market Value (USD Billion) Forecast by Application Format, 2021 to 2036
- Table 3: Global Market Value (USD Billion) Forecast by Facestock Substrate, 2021 to 2036
- Table 4: Global Market Value (USD Billion) Forecast by Printing Process, 2021 to 2036
- Table 5: Global Market Value (USD Billion) Forecast by Procurement Channel, 2021 to 2036
- Table 6: Global Market Value (USD Billion) Forecast by Sustainability Grade, 2021 to 2036
- Table 7: North America Market Value (USD Billion) Forecast by Country, 2021 to 2036
- Table 8: North America Market Value (USD Billion) Forecast by Application Format, 2021 to 2036
- Table 9: North America Market Value (USD Billion) Forecast by Facestock Substrate, 2021 to 2036
- Table 10: North America Market Value (USD Billion) Forecast by Printing Process, 2021 to 2036
- Table 11: North America Market Value (USD Billion) Forecast by Procurement Channel, 2021 to 2036
- Table 12: North America Market Value (USD Billion) Forecast by Sustainability Grade, 2021 to 2036
- Table 13: Latin America Market Value (USD Billion) Forecast by Country, 2021 to 2036
- Table 14: Latin America Market Value (USD Billion) Forecast by Application Format, 2021 to 2036
- Table 15: Latin America Market Value (USD Billion) Forecast by Facestock Substrate, 2021 to 2036
- Table 16: Latin America Market Value (USD Billion) Forecast by Printing Process, 2021 to 2036
- Table 17: Latin America Market Value (USD Billion) Forecast by Procurement Channel, 2021 to 2036
- Table 18: Latin America Market Value (USD Billion) Forecast by Sustainability Grade, 2021 to 2036
- Table 19: Western Europe Market Value (USD Billion) Forecast by Country, 2021 to 2036
- Table 20: Western Europe Market Value (USD Billion) Forecast by Application Format, 2021 to 2036
- Table 21: Western Europe Market Value (USD Billion) Forecast by Facestock Substrate, 2021 to 2036
- Table 22: Western Europe Market Value (USD Billion) Forecast by Printing Process, 2021 to 2036
- Table 23: Western Europe Market Value (USD Billion) Forecast by Procurement Channel, 2021 to 2036
- Table 24: Western Europe Market Value (USD Billion) Forecast by Sustainability Grade, 2021 to 2036
- Table 25: Eastern Europe Market Value (USD Billion) Forecast by Country, 2021 to 2036
- Table 26: Eastern Europe Market Value (USD Billion) Forecast by Application Format, 2021 to 2036
- Table 27: Eastern Europe Market Value (USD Billion) Forecast by Facestock Substrate, 2021 to 2036
- Table 28: Eastern Europe Market Value (USD Billion) Forecast by Printing Process, 2021 to 2036
- Table 29: Eastern Europe Market Value (USD Billion) Forecast by Procurement Channel, 2021 to 2036
- Table 30: Eastern Europe Market Value (USD Billion) Forecast by Sustainability Grade, 2021 to 2036
- Table 31: East Asia Market Value (USD Billion) Forecast by Country, 2021 to 2036
- Table 32: East Asia Market Value (USD Billion) Forecast by Application Format, 2021 to 2036
- Table 33: East Asia Market Value (USD Billion) Forecast by Facestock Substrate, 2021 to 2036
- Table 34: East Asia Market Value (USD Billion) Forecast by Printing Process, 2021 to 2036
- Table 35: East Asia Market Value (USD Billion) Forecast by Procurement Channel, 2021 to 2036
- Table 36: East Asia Market Value (USD Billion) Forecast by Sustainability Grade, 2021 to 2036
- Table 37: South Asia and Pacific Market Value (USD Billion) Forecast by Country, 2021 to 2036
- Table 38: South Asia and Pacific Market Value (USD Billion) Forecast by Application Format, 2021 to 2036
- Table 39: South Asia and Pacific Market Value (USD Billion) Forecast by Facestock Substrate, 2021 to 2036
- Table 40: South Asia and Pacific Market Value (USD Billion) Forecast by Printing Process, 2021 to 2036
- Table 41: South Asia and Pacific Market Value (USD Billion) Forecast by Procurement Channel, 2021 to 2036
- Table 42: South Asia and Pacific Market Value (USD Billion) Forecast by Sustainability Grade, 2021 to 2036
- Table 43: Middle East and Africa Market Value (USD Billion) Forecast by Country, 2021 to 2036
- Table 44: Middle East and Africa Market Value (USD Billion) Forecast by Application Format, 2021 to 2036
- Table 45: Middle East and Africa Market Value (USD Billion) Forecast by Facestock Substrate, 2021 to 2036
- Table 46: Middle East and Africa Market Value (USD Billion) Forecast by Printing Process, 2021 to 2036
- Table 47: Middle East and Africa Market Value (USD Billion) Forecast by Procurement Channel, 2021 to 2036
- Table 48: Middle East and Africa Market Value (USD Billion) Forecast by Sustainability Grade, 2021 to 2036
List of Figures
- Figure 1: Global Market Pricing Analysis
- Figure 2: Global Market Value (USD Billion) Forecast 2021-2036
- Figure 3: Global Market Value Share and BPS Analysis by Application Format, 2026 and 2036
- Figure 4: Global Market Y-o-Y Growth Comparison by Application Format, 2026-2036
- Figure 5: Global Market Attractiveness Analysis by Application Format
- Figure 6: Global Market Value Share and BPS Analysis by Facestock Substrate, 2026 and 2036
- Figure 7: Global Market Y-o-Y Growth Comparison by Facestock Substrate, 2026-2036
- Figure 8: Global Market Attractiveness Analysis by Facestock Substrate
- Figure 9: Global Market Value Share and BPS Analysis by Printing Process, 2026 and 2036
- Figure 10: Global Market Y-o-Y Growth Comparison by Printing Process, 2026-2036
- Figure 11: Global Market Attractiveness Analysis by Printing Process
- Figure 12: Global Market Value Share and BPS Analysis by Procurement Channel, 2026 and 2036
- Figure 13: Global Market Y-o-Y Growth Comparison by Procurement Channel, 2026-2036
- Figure 14: Global Market Attractiveness Analysis by Procurement Channel
- Figure 15: Global Market Value Share and BPS Analysis by Sustainability Grade, 2026 and 2036
- Figure 16: Global Market Y-o-Y Growth Comparison by Sustainability Grade, 2026-2036
- Figure 17: Global Market Attractiveness Analysis by Sustainability Grade
- Figure 18: Global Market Value (USD Billion) Share and BPS Analysis by Region, 2026 and 2036
- Figure 19: Global Market Y-o-Y Growth Comparison by Region, 2026-2036
- Figure 20: Global Market Attractiveness Analysis by Region
- Figure 21: North America Market Incremental Dollar Opportunity, 2026-2036
- Figure 22: Latin America Market Incremental Dollar Opportunity, 2026-2036
- Figure 23: Western Europe Market Incremental Dollar Opportunity, 2026-2036
- Figure 24: Eastern Europe Market Incremental Dollar Opportunity, 2026-2036
- Figure 25: East Asia Market Incremental Dollar Opportunity, 2026-2036
- Figure 26: South Asia and Pacific Market Incremental Dollar Opportunity, 2026-2036
- Figure 27: Middle East and Africa Market Incremental Dollar Opportunity, 2026-2036
- Figure 28: North America Market Value Share and BPS Analysis by Country, 2026 and 2036
- Figure 29: North America Market Value Share and BPS Analysis by Application Format, 2026 and 2036
- Figure 30: North America Market Y-o-Y Growth Comparison by Application Format, 2026-2036
- Figure 31: North America Market Attractiveness Analysis by Application Format
- Figure 32: North America Market Value Share and BPS Analysis by Facestock Substrate, 2026 and 2036
- Figure 33: North America Market Y-o-Y Growth Comparison by Facestock Substrate, 2026-2036
- Figure 34: North America Market Attractiveness Analysis by Facestock Substrate
- Figure 35: North America Market Value Share and BPS Analysis by Printing Process, 2026 and 2036
- Figure 36: North America Market Y-o-Y Growth Comparison by Printing Process, 2026-2036
- Figure 37: North America Market Attractiveness Analysis by Printing Process
- Figure 38: North America Market Value Share and BPS Analysis by Procurement Channel, 2026 and 2036
- Figure 39: North America Market Y-o-Y Growth Comparison by Procurement Channel, 2026-2036
- Figure 40: North America Market Attractiveness Analysis by Procurement Channel
- Figure 41: North America Market Value Share and BPS Analysis by Sustainability Grade, 2026 and 2036
- Figure 42: North America Market Y-o-Y Growth Comparison by Sustainability Grade, 2026-2036
- Figure 43: North America Market Attractiveness Analysis by Sustainability Grade
- Figure 44: Latin America Market Value Share and BPS Analysis by Country, 2026 and 2036
- Figure 45: Latin America Market Value Share and BPS Analysis by Application Format, 2026 and 2036
- Figure 46: Latin America Market Y-o-Y Growth Comparison by Application Format, 2026-2036
- Figure 47: Latin America Market Attractiveness Analysis by Application Format
- Figure 48: Latin America Market Value Share and BPS Analysis by Facestock Substrate, 2026 and 2036
- Figure 49: Latin America Market Y-o-Y Growth Comparison by Facestock Substrate, 2026-2036
- Figure 50: Latin America Market Attractiveness Analysis by Facestock Substrate
- Figure 51: Latin America Market Value Share and BPS Analysis by Printing Process, 2026 and 2036
- Figure 52: Latin America Market Y-o-Y Growth Comparison by Printing Process, 2026-2036
- Figure 53: Latin America Market Attractiveness Analysis by Printing Process
- Figure 54: Latin America Market Value Share and BPS Analysis by Procurement Channel, 2026 and 2036
- Figure 55: Latin America Market Y-o-Y Growth Comparison by Procurement Channel, 2026-2036
- Figure 56: Latin America Market Attractiveness Analysis by Procurement Channel
- Figure 57: Latin America Market Value Share and BPS Analysis by Sustainability Grade, 2026 and 2036
- Figure 58: Latin America Market Y-o-Y Growth Comparison by Sustainability Grade, 2026-2036
- Figure 59: Latin America Market Attractiveness Analysis by Sustainability Grade
- Figure 60: Western Europe Market Value Share and BPS Analysis by Country, 2026 and 2036
- Figure 61: Western Europe Market Value Share and BPS Analysis by Application Format, 2026 and 2036
- Figure 62: Western Europe Market Y-o-Y Growth Comparison by Application Format, 2026-2036
- Figure 63: Western Europe Market Attractiveness Analysis by Application Format
- Figure 64: Western Europe Market Value Share and BPS Analysis by Facestock Substrate, 2026 and 2036
- Figure 65: Western Europe Market Y-o-Y Growth Comparison by Facestock Substrate, 2026-2036
- Figure 66: Western Europe Market Attractiveness Analysis by Facestock Substrate
- Figure 67: Western Europe Market Value Share and BPS Analysis by Printing Process, 2026 and 2036
- Figure 68: Western Europe Market Y-o-Y Growth Comparison by Printing Process, 2026-2036
- Figure 69: Western Europe Market Attractiveness Analysis by Printing Process
- Figure 70: Western Europe Market Value Share and BPS Analysis by Procurement Channel, 2026 and 2036
- Figure 71: Western Europe Market Y-o-Y Growth Comparison by Procurement Channel, 2026-2036
- Figure 72: Western Europe Market Attractiveness Analysis by Procurement Channel
- Figure 73: Western Europe Market Value Share and BPS Analysis by Sustainability Grade, 2026 and 2036
- Figure 74: Western Europe Market Y-o-Y Growth Comparison by Sustainability Grade, 2026-2036
- Figure 75: Western Europe Market Attractiveness Analysis by Sustainability Grade
- Figure 76: Eastern Europe Market Value Share and BPS Analysis by Country, 2026 and 2036
- Figure 77: Eastern Europe Market Value Share and BPS Analysis by Application Format, 2026 and 2036
- Figure 78: Eastern Europe Market Y-o-Y Growth Comparison by Application Format, 2026-2036
- Figure 79: Eastern Europe Market Attractiveness Analysis by Application Format
- Figure 80: Eastern Europe Market Value Share and BPS Analysis by Facestock Substrate, 2026 and 2036
- Figure 81: Eastern Europe Market Y-o-Y Growth Comparison by Facestock Substrate, 2026-2036
- Figure 82: Eastern Europe Market Attractiveness Analysis by Facestock Substrate
- Figure 83: Eastern Europe Market Value Share and BPS Analysis by Printing Process, 2026 and 2036
- Figure 84: Eastern Europe Market Y-o-Y Growth Comparison by Printing Process, 2026-2036
- Figure 85: Eastern Europe Market Attractiveness Analysis by Printing Process
- Figure 86: Eastern Europe Market Value Share and BPS Analysis by Procurement Channel, 2026 and 2036
- Figure 87: Eastern Europe Market Y-o-Y Growth Comparison by Procurement Channel, 2026-2036
- Figure 88: Eastern Europe Market Attractiveness Analysis by Procurement Channel
- Figure 89: Eastern Europe Market Value Share and BPS Analysis by Sustainability Grade, 2026 and 2036
- Figure 90: Eastern Europe Market Y-o-Y Growth Comparison by Sustainability Grade, 2026-2036
- Figure 91: Eastern Europe Market Attractiveness Analysis by Sustainability Grade
- Figure 92: East Asia Market Value Share and BPS Analysis by Country, 2026 and 2036
- Figure 93: East Asia Market Value Share and BPS Analysis by Application Format, 2026 and 2036
- Figure 94: East Asia Market Y-o-Y Growth Comparison by Application Format, 2026-2036
- Figure 95: East Asia Market Attractiveness Analysis by Application Format
- Figure 96: East Asia Market Value Share and BPS Analysis by Facestock Substrate, 2026 and 2036
- Figure 97: East Asia Market Y-o-Y Growth Comparison by Facestock Substrate, 2026-2036
- Figure 98: East Asia Market Attractiveness Analysis by Facestock Substrate
- Figure 99: East Asia Market Value Share and BPS Analysis by Printing Process, 2026 and 2036
- Figure 100: East Asia Market Y-o-Y Growth Comparison by Printing Process, 2026-2036
- Figure 101: East Asia Market Attractiveness Analysis by Printing Process
- Figure 102: East Asia Market Value Share and BPS Analysis by Procurement Channel, 2026 and 2036
- Figure 103: East Asia Market Y-o-Y Growth Comparison by Procurement Channel, 2026-2036
- Figure 104: East Asia Market Attractiveness Analysis by Procurement Channel
- Figure 105: East Asia Market Value Share and BPS Analysis by Sustainability Grade, 2026 and 2036
- Figure 106: East Asia Market Y-o-Y Growth Comparison by Sustainability Grade, 2026-2036
- Figure 107: East Asia Market Attractiveness Analysis by Sustainability Grade
- Figure 108: South Asia and Pacific Market Value Share and BPS Analysis by Country, 2026 and 2036
- Figure 109: South Asia and Pacific Market Value Share and BPS Analysis by Application Format, 2026 and 2036
- Figure 110: South Asia and Pacific Market Y-o-Y Growth Comparison by Application Format, 2026-2036
- Figure 111: South Asia and Pacific Market Attractiveness Analysis by Application Format
- Figure 112: South Asia and Pacific Market Value Share and BPS Analysis by Facestock Substrate, 2026 and 2036
- Figure 113: South Asia and Pacific Market Y-o-Y Growth Comparison by Facestock Substrate, 2026-2036
- Figure 114: South Asia and Pacific Market Attractiveness Analysis by Facestock Substrate
- Figure 115: South Asia and Pacific Market Value Share and BPS Analysis by Printing Process, 2026 and 2036
- Figure 116: South Asia and Pacific Market Y-o-Y Growth Comparison by Printing Process, 2026-2036
- Figure 117: South Asia and Pacific Market Attractiveness Analysis by Printing Process
- Figure 118: South Asia and Pacific Market Value Share and BPS Analysis by Procurement Channel, 2026 and 2036
- Figure 119: South Asia and Pacific Market Y-o-Y Growth Comparison by Procurement Channel, 2026-2036
- Figure 120: South Asia and Pacific Market Attractiveness Analysis by Procurement Channel
- Figure 121: South Asia and Pacific Market Value Share and BPS Analysis by Sustainability Grade, 2026 and 2036
- Figure 122: South Asia and Pacific Market Y-o-Y Growth Comparison by Sustainability Grade, 2026-2036
- Figure 123: South Asia and Pacific Market Attractiveness Analysis by Sustainability Grade
- Figure 124: Middle East and Africa Market Value Share and BPS Analysis by Country, 2026 and 2036
- Figure 125: Middle East and Africa Market Value Share and BPS Analysis by Application Format, 2026 and 2036
- Figure 126: Middle East and Africa Market Y-o-Y Growth Comparison by Application Format, 2026-2036
- Figure 127: Middle East and Africa Market Attractiveness Analysis by Application Format
- Figure 128: Middle East and Africa Market Value Share and BPS Analysis by Facestock Substrate, 2026 and 2036
- Figure 129: Middle East and Africa Market Y-o-Y Growth Comparison by Facestock Substrate, 2026-2036
- Figure 130: Middle East and Africa Market Attractiveness Analysis by Facestock Substrate
- Figure 131: Middle East and Africa Market Value Share and BPS Analysis by Printing Process, 2026 and 2036
- Figure 132: Middle East and Africa Market Y-o-Y Growth Comparison by Printing Process, 2026-2036
- Figure 133: Middle East and Africa Market Attractiveness Analysis by Printing Process
- Figure 134: Middle East and Africa Market Value Share and BPS Analysis by Procurement Channel, 2026 and 2036
- Figure 135: Middle East and Africa Market Y-o-Y Growth Comparison by Procurement Channel, 2026-2036
- Figure 136: Middle East and Africa Market Attractiveness Analysis by Procurement Channel
- Figure 137: Middle East and Africa Market Value Share and BPS Analysis by Sustainability Grade, 2026 and 2036
- Figure 138: Middle East and Africa Market Y-o-Y Growth Comparison by Sustainability Grade, 2026-2036
- Figure 139: Middle East and Africa Market Attractiveness Analysis by Sustainability Grade
- Figure 140: Global Market - Tier Structure Analysis
- Figure 141: Global Market - Company Share Analysis
Frequently Asked Questions
How big is the labels market in 2026, and what is forecast for 2036?
According to FMI, global labels market valuation is estimated to reach USD 55.2 billion in 2026 and is projected to climb to USD 94.3 billion by 2036, up from USD 52.3 billion in 2025.
What is the CAGR for the labels market from 2026 to 2036?
Future Market Insights projects a 5.5% compound annual growth rate between 2026 and 2036, generating USD 39.1 billion in incremental industry valuation over the decade.
Which application format segment leads the labels market?
Pressure-Sensitive Labels are projected to capture 48.3% of application format demand in 2026 because self-adhesive rolls allow clean rotary application above 300 meters per minute without wet-glue maintenance.
Which facestock substrate segment leads the labels market?
Polyolefin & PET Film is estimated to secure 53.1% of the facestock substrate category in 2026, supported by moisture durability and mono-material recycling compatibility on rigid plastic containers.
Which country has a notable growth outlook during the assessment period?
Vietnam is projected to lead national expansion at a 6.8% CAGR through 2036, driven by export electronics barcode labeling and packaged food processing.
Who are the key players in the market?
Avery Dennison Corporation, CCL Industries Inc., Multi-Color Corporation, UPM Raflatac, Fedrigoni S.p.A., Constantia Flexibles, Brady Corporation, and Lintec Corporation are the leading companies analyzed in this report.
Preview the report firsthand - request a free sample
Get SampleGet the brochure for pricing and purchase details.
Get PDF
