Life Science Logistics Market Size and Share Forecast Outlook 2025 to 2035

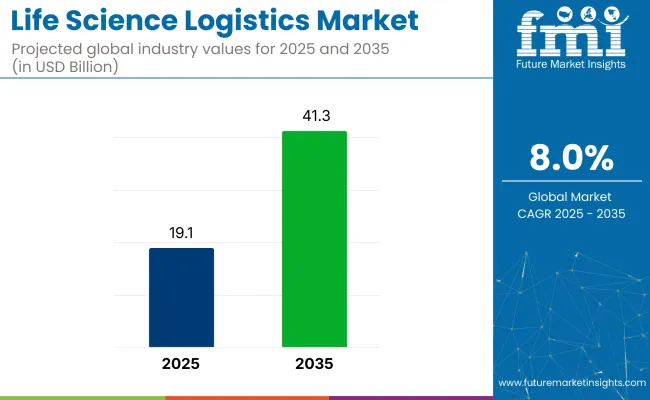
The global life science logistics market is forecasted to grow from USD 19.1 billion in 2025 to USD 41.3 billion by 2035, registering a CAGR of 8% during the forecast period.
Quick Stats for Life Science Logistics Market

  • Industry Value (2025): USD 19.1 billion
  • Industry Forecast Value (2035): USD 41.3 billion
  • Forecast CAGR: 8%
  • Leading Segment: Pharmaceutical Companies (55% share)
  • Key Growth Region: Asia Pacific (India)
  • Key Players: DHL, World Courier, Quick STAT, CEVA Logistics, and Market

Life Science Logistics Market

Attribute Value
Market Size in 2025 USD 19.1 billion
Market Size in 2035 USD 41.3 billion
CAGR (2025 to 2035) 8%

This growth is being driven by the rising demand for specialized logistics services dedicated to the transportation, storage, and distribution of sensitive life science products such as pharmaceuticals, biotechnology products, and medical devices. The increasing complexity of life science supply chains, combined with the critical need for temperature-controlled logistics and cold chain management, is further propelling industry expansion worldwide.

The role of innovation and strategic partnerships is being emphasized by industry leaders. As noted by Klaus Dohrmann, Head of Innovation and Trend Research at DHL, “When significant investment is made in the industry, partnerships to drive innovation are facilitated.

Internal expertise is leveraged to identify strong use cases for new technologies.” Major logistics providers such as DHL, FedEx, UPS Healthcare, and Kuehne + Nagel are focusing on expanding service offerings, technological innovation, and geographic footprint to meet growing demands.

The increasing adoption of personalized medicine, biologics, and vaccines is also accelerating the need for specialized logistics solutions. With rising healthcare awareness and pharmaceutical manufacturing growth, the industry is expected to witness sustained growth and technological advancement through 2035.

The industry holds a specialized share within its parent markets. In the logistics and supply chain market, it accounts for approximately 5-7%, as life science logistics is a niche sector focusing on the transport of sensitive healthcare products. Within the healthcare and pharmaceutical supply chain market, the share is higher, around 10-12%, driven by the critical need for timely and safe delivery of medical supplies and drugs.

In the cold chain logistics market, the logistics represents about 15-18%, due to the essential role of temperature-controlled transportation for pharmaceuticals and biologics. Within the biotechnology market, the share is around 3-5%, as it supports the transportation of research materials and biotech products. In the medical devices market, the logistics holds about 4-6%, supporting the transport of sensitive and high-value medical devices.

Analyzing Life Science Logistics Market by Top Investment Segments

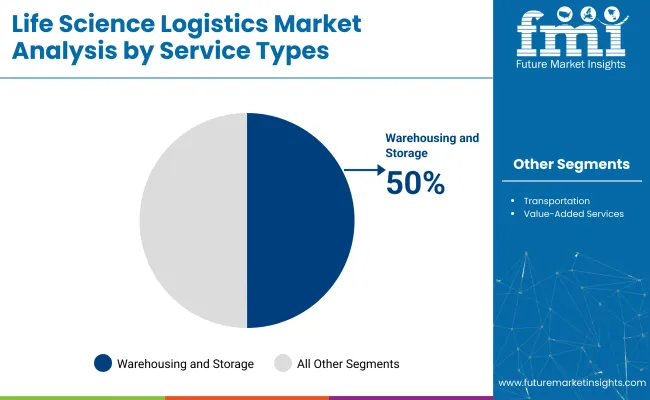
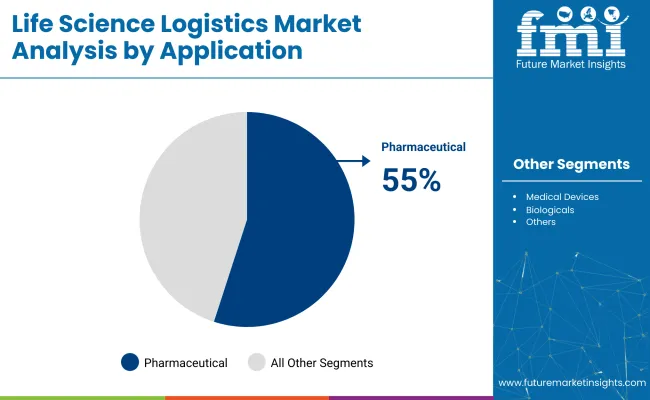
The industry is expected to be dominated by pharmaceuticals, capturing 55% of the end-user share in 2025. Warehousing and storage services will lead with 50% of the service type industry, while pharmaceuticals will also lead logistics applications with a 45% share.

Warehousing and Storage Services to Lead Life Science Logistics by Service Type in 2025

Warehousing and storage services are expected to capture 50% of the industry in 2025 due to their vital role in maintaining the integrity of sensitive life science products such as pharmaceuticals, biologics, and vaccines. These services are essential for ensuring the safe storage and inventory management of temperature-sensitive products that require strict environmental controls.

With the increasing global demand for life-saving therapies and biologics, warehousing solutions that offer advanced temperature-controlled facilities, security, and tracking systems are critical. These services ensure compliance with regulatory requirements and provide flexibility in managing global supply chains.
  • Essential for the safe storage and management of temperature-sensitive products
  • Increasing demand for biologics and vaccines drives the need for secure storage.
  • Advanced temperature-controlled facilities ensure compliance and inventory managemen.t

Life Science Logistics Market Analysis By Service Types

Pharmaceuticals Expected to Dominate Life Science Logistics Applications with 45% Share in 2025

Pharmaceuticals are projected to hold a dominant 45% share of the industry in 2025 due to the critical need for safe, temperature-controlled transportation and storage of sensitive products such as drugs, biologics, and vaccines.

The rising global demand for life-saving medications and advanced biologics has increased the complexity of logistics operations, requiring specialized handling, packaging, and transportation solutions. The logistics providers are focusing on developing advanced systems to manage the end-to-end supply chain, ensuring timely delivery and compliance with stringent regulatory requirements. The sector’s reliance on precise inventory tracking and cold chain solutions further drives its dominance.
  • Rising demand for life-saving medications and biologics increases logistics complexity.
  • Need for specialized handling and temperature-controlled transportation fuels growth.
  • Advanced tracking and cold chain solutions ensure compliance and timely delivery

Life Science Logistics Market Analysis By Application

Pharmaceutical Companies Lead the End-User Segment with 55% Industry Share in 2025

Pharmaceutical companies are projected to capture 55% of the industry in 2025 due to their significant need for efficient, temperature-controlled logistics to transport and store drugs, biologics, and vaccines. The sector 's reliance on precise logistics operations is driven by the growing global demand for life-saving treatments and the increasing complexity of drug formulations, especially biologics.

These companies require specialized logistics services that comply with strict regulatory requirements, including cold chain management and inventory tracking. As the pharmaceutical industry continues to expand, especially in emerging industries, the demand for advanced logistics services will remain a key driver for this segment.

  • Increasing global demand for life-saving drugs and biologics fuels logistics needs
  • Cold chain management and regulatory compliance are crucial for pharmaceutical logistics
  • Growth in emerging industries further amplifies the need for specialized logistics services

Top Life Science Logistics Market Dynamics

The industry is driven by rising demand for temperature-sensitive products, advancements in cold chain technologies, and the growth of clinical trials. However, challenges such as escalating transportation costs, stringent regulations, and managing temperature-sensitive shipments hinder broader industry growth.

Rising Demand for Temperature-Sensitive Life Science Products

The industry is expanding due to the increasing demand for temperature-sensitive products like pharmaceuticals and biologics, advancements in cold chain technologies, and the growth of clinical trials.

Rising chronic diseases and biologic therapies are driving the need for specialized logistics, while innovations such as real-time temperature monitoring and IoT-enabled tracking are improving efficiency. The surge in clinical trials is further intensifying demand for reliable and timely transportation of clinical materials, shaping the future of the industry.

  • Growing demand for temperature-sensitive products is driving the need for reliable logistics solutions.
  • Cold chain innovations like automated storage and IoT tracking are enhancing logistics efficiency.
  • An increasing number of global clinical trials is accelerating the need for specialized transportation of trial materials.

Challenges Hindering Growth in the Life Science Logistics Industry

The industry faces several challenges, including rising transportation costs, stringent regulatory compliance requirements, and the complexities of managing temperature-sensitive shipments. The increasing cost of fuel and limited carrier capacity are driving up logistics expenses, while complex regulations across various regions add operational difficulties.

Ensuring the integrity of temperature-sensitive products requires sophisticated infrastructure and monitoring systems. These obstacles demand strategic planning and investment in technology to maintain industry growth.
  • Rising fuel prices and limited capacity are driving up logistics costs.
  • Compliance with complex regional regulations adds operational complexity and costs.
  • Maintaining product integrity during temperature-sensitive shipments requires advanced infrastructure and monitoring systems.

Analyzing Top Countries Advancing, Managing, and Delivering Life Science Logistics

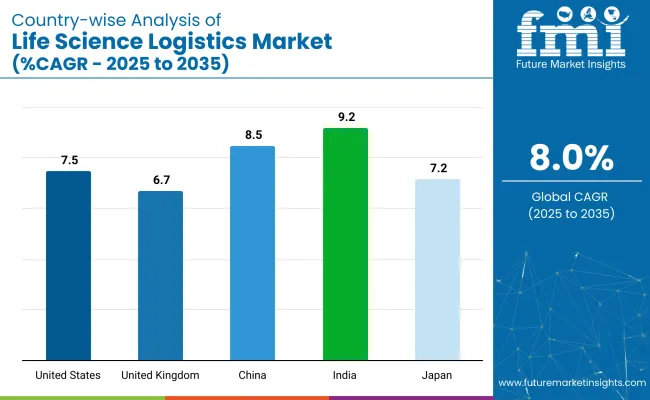
Country Wise Analysis Of Life Science Logistics Market

Countries CAGR (2025 to 2035)
United States 7.5%
United Kingdom 6.7%
China 8.5%
India 9.2%
Japan 7.2%

The industry demand is projected to rise at an 8% CAGR from 2025 to 2035. Of the five profiled countries out of 40 covered, India leads at 9.2%, followed by China at 8.5% and the United States at 7.5%, while Japan records 7.2% and the United Kingdom posts 6.7%.

These rates translate to a growth premium of +15% for India, +7% for China, and -6% for the United Kingdom versus the baseline, while the United States and Japan show more moderate growth. Divergence reflects local catalysts: rapid healthcare infrastructure development in India, increasing demand for life sciences logistics driven by expanding pharmaceutical and biotechnology industries in China, and steady demand in the USA and Japan. The United Kingdom shows more conservative growth due to industry saturation and economic factors.

Growth Analysis of Life Science Logistics Market in the United States

The industry in the United States is set to record a CAGR of 7.5% through 2035. Industry growth is being driven by regulatory adherence, FDA-aligned handling protocols, and a high-volume demand for temperature-sensitive biologics.

FedEx Healthcare, UPS Healthcare, and DHL Supply Chain have expanded temperature-controlled capabilities through specialized fleet upgrades and GMP-compliant warehousing. Real-time tracking using IoT sensors and blockchain has strengthened visibility, while large-scale vaccine and personalized medicine distribution has prompted infrastructure modernization.

  • Blockchain systems are being integrated into biologics transit for chain-of-custody validation.
  • Smart containers with predictive analytics are deployed in long-haul pharmaceutical routes.
  • FDA guidance on gene therapies has spurred dedicated cold-chain process redesigns.

Future Outlook for Life Science Logistics Market in the United Kingdom

Sales of the logistics services in the United Kingdom are projected to grow at a CAGR of 6.7% through 2035. Demand is being supported by strict regulatory mandates under MHRA and GDP frameworks, combined with innovation in last-mile delivery. Logistics providers such as Kuehne + Nagel and DHL have invested in AI-enabled storage optimization and temperature-tracking technologies.

Vaccine and biologic shipments remain central drivers, while automation in warehousing and predictive route mapping enhances consistency. Brexit-adjusted trade protocols have elevated demand for compliant cross-border transit solutions.

  • MHRA-accredited distribution centers are expanding cold chain audits for 2-8°,C lanes.
  • Vaccine programs have driven last-mile electric vehicle investment in dense urban zones.
  • APIs and middleware now link warehouse systems directly to NHS inventory hubs.

Demand Forecast for Life Science Logistics Market in China

Demand for the logistics services in China is estimated to grow at a CAGR of 8.5% through 2035. Cold-chain capacity is scaling in response to surging pharmaceutical production and export logistics, particularly for vaccines and biosimilars.

SF Express, Yusen Logistics, and ZTO Express are expanding certified facilities and refrigerated fleet coverage to meet tightened transport regulations. Digital twin technology and integrated e-commerce fulfillment have reinforced visibility. Government mandates around drug traceability and temperature compliance are pushing the logistics toward smart tracking and sensor analytics.

  • Multi-temperature vehicle fleets are now mandated for biologic last-mile transport in tier-one cities.
  • Pharma export zones are integrating IoT-linked storage across bonded logistics parks.
  • Real-time route deviation alerts are improving biologic delivery reliability.

Analysis of Life Science Logistics Market in India

The industry in India is projected to grow at a CAGR of 9.2% through 2035. Expansion is being led by the country's role as a major generic pharmaceutical exporter and rising demand for biologics. Firms including Blue Dart, Snowman Logistics, and Gati are enhancing cold chain warehousing across metro regions and industrial corridors.

GDP compliance and thermal-mapping standards are being prioritized to meet global contract terms. Adoption of IoT-based validation and energy-efficient refrigeration systems is reinforcing the appeal of Indian firms in global supply networks.

  • Urban vaccine distribution is transitioning to hybrid cold-box models with digital logs.
  • Pharma clusters in Gujarat and Telangana are integrating GDP-compliant shipping lanes.
  • Government incentives are supporting cold-chain infrastructure under the National Logistics Policy.

Life Science Logistics Market Growth Outlook in Japan

The industry in Japan is expected to grow at a CAGR of 7.2% through 2035. Industry growth is driven by advanced healthcare infrastructure and strict adherence to GDP and GMP logistics standards. Nippon Express, Yamato Transport, and Sagawa Express are deploying AI-integrated temperature management for biologics, vaccines, and active pharmaceutical ingredients.

Cold chain routes with embedded compliance modules are being optimized for rural hospital deliveries and specialty clinics. Aging demographics and long-term pharmaceutical demand sustain steady expansion.
  • Regional pharma warehouses are adopting robotic inventory controls for cold storage.
  • Biologics supply lines now use shock-absorbent packaging with thermal integrity.
  • GMP-aligned delivery schedules are being embedded into digital route-management tools.

Leading Life Science Logistics Market Suppliers

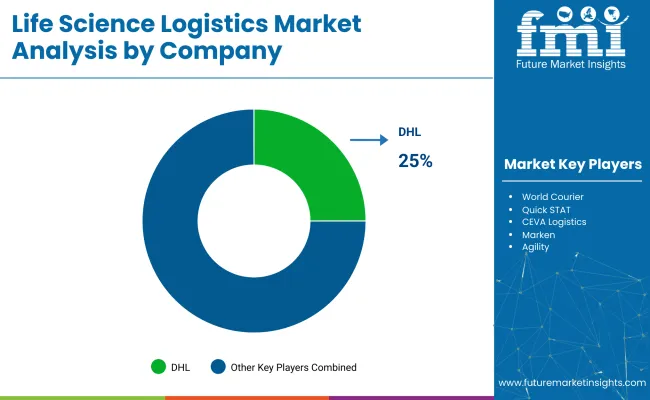
Life Science Logistics Market Analysis By Company

Leading Company - DHL, Industry Share - 30%.

The global industry features a competitive landscape with dominant players, key players, and emerging players. Dominant players such as DHL, World Courier, and Quick STAT lead the industry with extensive service portfolios, strong R&,D capabilities, and robust distribution networks across pharmaceuticals, biotechnology, and clinical research sectors.

Key players including CEVA Logistics, Marken, and Agility offer specialized solutions tailored to specific applications and regional industries. Emerging players, such as Rhenus Group, MNX Global Logistics, and CRYOPDP, focus on innovative technologies and cost-effective solutions, expanding their presence in the global industry.

Recent Life Science Logistics Industry Developments

  • In April 2025, UPS announced plans to acquire Andlauer Healthcare Group for USD 1.6 billion, strengthening its healthcare logistics operations. This acquisition aims to enhance UPS 's capabilities in temperature-controlled logistics and expand its global reach within the healthcare sector.
  • In March 2025, DHL acquired CryoPDP, a USA-based pharmaceutical logistics firm, to bolster its presence in the pharma sector. This strategic move aims to enhance DHL 's temperature-controlled logistics solutions and expand its capabilities in managing complex supply chains for the pharmaceutical industry.

Key Players in Life Science Logistics Market

  • DHL
  • World Courier
  • Quick STAT
  • CEVA Logistics
  • Marken
  • Agility
  • Rhenus Group
  • MNX Global Logistics
  • CRYOPDP
  • Langham Logistics
  • Life Science Logistics
  • Biocair

Research Coverage and Scope Summary

Report Attributes Details
Current Total Industry Size (2025) USD 19.1 billion
Projected Industry Size (2035) USD 41.3 billion
CAGR (2025 to 2035) 8%
Base Year for Estimation 2024
Historical Period 2020 to 2024
Projections Period 2025 to 2035
Quantitative Units USD billion for value and metric tons for volume
Service Types Analyzed (Segment 1) Warehousing & storage, Transportation, Value-added services
Applications Covered (Segment 2) Pharmaceuticals, Medical devices, Biologicals, Clinical trial materials
End Users Covered (Segment 3) Pharmaceutical companies, Hospitals and clinics, Contract research organizations (CROs), Others
Regions Covered North America, Europe, Asia-Pacific, Latin America, Middle East &, and Africa
Countries Covered United States, Germany, United Kingdom, China, India, Japan, Brazil, Canada, Australia
Key Players Influencing the Industry DHL, World Courier, Quick STAT, CEVA Logistics, Marken, Agility, Rhenus Group, MNX Global Logistics, CRYOPDP, Langham Logistics, Life Science Logistics, Biocair, Others
Additional Attributes Cold-chain temperature control capabilities, Digitalization and IoT-enabled tracking, Regulatory compliance (GDP, GSP), Sustainability and green logistics initiatives, Customized packaging and labeling solutions

Key Segmentation

By Service Type:

The industry is segmented by service type into warehousing & storage, transportation, and value-added services.

By Application:

By application, the industry includes pharmaceuticals, medical devices, biologicals, and clinical trial materials.

By End User:

In terms of end users, the industry is segmented into pharmaceutical companies, hospitals and clinics, contract research organizations (CROs), and others.

By Region:

The industry covers North America, Europe, Asia-Pacific, Latin America, and Middle East and Africa.

Table of Content

  1. Executive Summary
    • Global Market Outlook
    • Demand-side Trends
    • Supply-side Trends
    • Technology Roadmap Analysis
    • Analysis and Recommendations
  2. Market Overview
    • Market Coverage/Taxonomy
    • Market Definition/Scope/Limitations
  3. Market Background
    • Market Dynamics
      • Drivers
      • Restraints
      • Opportunity
      • Trends
    • Scenario Forecast
      • Demand in Optimistic Scenario
      • Demand in Likely Scenario
      • Demand in Conservative Scenario
    • Opportunity Map Analysis
    • Product Life Cycle Analysis
    • Supply Chain Analysis
      • Supply Side Participants and their Roles
        • Producers
        • Mid-Level Participants (Traders/ Agents/ Brokers)
        • Wholesalers and Distributors
      • Value Added and Value Created at Node in the Supply Chain
      • List of Raw Material Suppliers
      • List of Existing and Potential Buyer’s
    • Investment Feasibility Matrix
    • Value Chain Analysis
      • Profit Margin Analysis
      • Wholesalers and Distributors
      • Retailers
    • PESTLE and Porter’s Analysis
    • Regulatory Landscape
      • By Key Regions
      • By Key Countries
    • Regional Parent Market Outlook
    • Production and Consumption Statistics
    • Import and Export Statistics
  4. Global Market Analysis 2020 to 2024 and Forecast, 2025 to 2035
    • Historical Market Size Value (USD Billion) & Volume (Metric Tons) Analysis, 2020 to 2024
    • Current and Future Market Size Value (USD Billion) & Volume (Metric Tons) Projections, 2025 to 2035
      • Y-o-Y Growth Trend Analysis
      • Absolute $ Opportunity Analysis
  5. Global Market Pricing Analysis 2020 to 2024 and Forecast 2025 to 2035
  6. Global Market Analysis 2020 to 2024 and Forecast 2025 to 2035, By Service Type
    • Introduction/Key Findings
    • Historical Market Size Value (USD Billion) & Volume (Metric Tons) Analysis By Service Type, 2020 to 2024
    • Current and Future Market Size Value (USD Billion) & Volume (Metric Tons) Analysis and Forecast By Service Type, 2025 to 2035
      • Warehousing & Storage
      • Transportation
      • Value-added Services
    • Y-o-Y Growth Trend Analysis By Service Type, 2020 to 2024
    • Absolute $ Opportunity Analysis By Service Type, 2025 to 2035
  7. Global Market Analysis 2020 to 2024 and Forecast 2025 to 2035, By Application
    • Introduction/Key Findings
    • Historical Market Size Value (USD Billion) & Volume (Metric Tons) Analysis By Application, 2020 to 2024
    • Current and Future Market Size Value (USD Billion) & Volume (Metric Tons) Analysis and Forecast By Application, 2025 to 2035
      • Pharmaceuticals
      • Medical Devices
      • Biologicals
      • Clinical Trial Materials
    • Y-o-Y Growth Trend Analysis By Application, 2020 to 2024
    • Absolute $ Opportunity Analysis By Application, 2025 to 2035
  8. Global Market Analysis 2020 to 2024 and Forecast 2025 to 2035, By End User
    • Introduction/Key Findings
    • Historical Market Size Value (USD Billion) & Volume (Metric Tons) Analysis By End User, 2020 to 2024
    • Current and Future Market Size Value (USD Billion) & Volume (Metric Tons) Analysis and Forecast By End User, 2025 to 2035
      • Pharmaceutical Companies
      • Hospitals and clinics
      • Contract Research Organizations (CROs)
      • Others
    • Y-o-Y Growth Trend Analysis By End User, 2020 to 2024
    • Absolute $ Opportunity Analysis By End User, 2025 to 2035
  9. Global Market Analysis 2020 to 2024 and Forecast 2025 to 2035, By Region
    • Introduction
    • Historical Market Size Value (USD Billion) & Volume (Metric Tons) Analysis By Region, 2020 to 2024
    • Current Market Size Value (USD Billion) & Volume (Metric Tons) Analysis and Forecast By Region, 2025 to 2035
      • North America
      • Latin America
      • Western Europe
      • Eastern Europe
      • East Asia
      • South Asia & Pacific
      • Middle East and Africa
    • Market Attractiveness Analysis By Region
  10. North America Market Analysis 2020 to 2024 and Forecast 2025 to 2035, By Country
    • Historical Market Size Value (USD Billion) & Volume (Metric Tons) Trend Analysis By Market Taxonomy, 2020 to 2024
    • Market Size Value (USD Billion) & Volume (Metric Tons) Forecast By Market Taxonomy, 2025 to 2035
      • By Country
        • USA
        • Canada
        • Mexico
      • By Service Type
      • By Application
      • By End User
    • Market Attractiveness Analysis
      • By Country
      • By Service Type
      • By Application
      • By End User
    • Key Takeaways
  11. Latin America Market Analysis 2020 to 2024 and Forecast 2025 to 2035, By Country
    • Historical Market Size Value (USD Billion) & Volume (Metric Tons) Trend Analysis By Market Taxonomy, 2020 to 2024
    • Market Size Value (USD Billion) & Volume (Metric Tons) Forecast By Market Taxonomy, 2025 to 2035
      • By Country
        • Brazil
        • Argentina
        • Rest of LATAM
      • By Service Type
      • By Application
      • By End User
    • Market Attractiveness Analysis
      • By Country
      • By Service Type
      • By Application
      • By End User
    • Key Takeaways
  12. Western Europe Market Analysis 2020 to 2024 and Forecast 2025 to 2035, By Country
    • Historical Market Size Value (USD Billion) & Volume (Metric Tons) Trend Analysis By Market Taxonomy, 2020 to 2024
    • Market Size Value (USD Billion) & Volume (Metric Tons) Forecast By Market Taxonomy, 2025 to 2035
      • By Country
        • Germany
        • Italy
        • France
        • UK
        • Spain
        • BENELUX
        • Nordic
        • Rest of W. Europe
      • By Service Type
      • By Application
      • By End User
    • Market Attractiveness Analysis
      • By Country
      • By Service Type
      • By Application
      • By End User
    • Key Takeaways
  13. Eastern Europe Market Analysis 2020 to 2024 and Forecast 2025 to 2035, By Country
    • Historical Market Size Value (USD Billion) & Volume (Metric Tons) Trend Analysis By Market Taxonomy, 2020 to 2024
    • Market Size Value (USD Billion) & Volume (Metric Tons) Forecast By Market Taxonomy, 2025 to 2035
      • By Country
        • Russia
        • Hungary
        • Poland
        • Balkan & Baltics
        • Rest of E. Europe
      • By Service Type
      • By Application
      • By End User
    • Market Attractiveness Analysis
      • By Country
      • By Service Type
      • By Application
      • By End User
    • Key Takeaways
  14. East Asia Market Analysis 2020 to 2024 and Forecast 2025 to 2035, By Country
    • Historical Market Size Value (USD Billion) & Volume (Metric Tons) Trend Analysis By Market Taxonomy, 2020 to 2024
    • Market Size Value (USD Billion) & Volume (Metric Tons) Forecast By Market Taxonomy, 2025 to 2035
      • By Country
        • China
        • Japan
        • South Korea
      • By Service Type
      • By Application
      • By End User
    • Market Attractiveness Analysis
      • By Country
      • By Service Type
      • By Application
      • By End User
    • Key Takeaways
  15. South Asia & Pacific Market Analysis 2020 to 2024 and Forecast 2025 to 2035, By Country
    • Historical Market Size Value (USD Billion) & Volume (Metric Tons) Trend Analysis By Market Taxonomy, 2020 to 2024
    • Market Size Value (USD Billion) & Volume (Metric Tons) Forecast By Market Taxonomy, 2025 to 2035
      • By Country
        • India
        • Australia & New Zealand
        • ASEAN
        • Rest of SAP
      • By Service Type
      • By Application
      • By End User
    • Market Attractiveness Analysis
      • By Country
      • By Service Type
      • By Application
      • By End User
    • Key Takeaways
  16. Middle East and Africa Market Analysis 2020 to 2024 and Forecast 2025 to 2035, By Country
    • Historical Market Size Value (USD Billion) & Volume (Metric Tons) Trend Analysis By Market Taxonomy, 2020 to 2024
    • Market Size Value (USD Billion) & Volume (Metric Tons) Forecast By Market Taxonomy, 2025 to 2035
      • By Country
        • GCC Countries
        • Northern Africa
        • South Africa
        • Turkiye
        • Rest of MEA
      • By Service Type
      • By Application
      • By End User
    • Market Attractiveness Analysis
      • By Country
      • By Service Type
      • By Application
      • By End User
    • Key Takeaways
  17. Key Countries Market Analysis
    • USA
      • Pricing Analysis
      • Market Share Analysis, 2024
        • By Service Type
        • By Application
        • By End User
    • Canada
      • Pricing Analysis
      • Market Share Analysis, 2024
        • By Service Type
        • By Application
        • By End User
    • Brazil
      • Pricing Analysis
      • Market Share Analysis, 2024
        • By Service Type
        • By Application
        • By End User
    • Mexico
      • Pricing Analysis
      • Market Share Analysis, 2024
        • By Service Type
        • By Application
        • By End User
    • Argentina
      • Pricing Analysis
      • Market Share Analysis, 2024
        • By Service Type
        • By Application
        • By End User
  18. Market Structure Analysis
    • Competition Dashboard
    • Competition Benchmarking
    • Market Share Analysis of Top Players
      • By Regional
      • By Service Type
      • By Application
      • By End User
  19. Competition Analysis
    • Competition Deep Dive
      • DHL
        • Overview
        • Product Portfolio
        • Profitability by Market Segments (Product/Age /Sales Channel/Region)
        • Sales Footprint
        • Strategy Overview
          • Marketing Strategy
          • Product Strategy
          • Channel Strategy
      • World Courier
        • Overview
        • Product Portfolio
        • Profitability by Market Segments (Product/Age /Sales Channel/Region)
        • Sales Footprint
        • Strategy Overview
          • Marketing Strategy
          • Product Strategy
          • Channel Strategy
      • Quick STAT
        • Overview
        • Product Portfolio
        • Profitability by Market Segments (Product/Age /Sales Channel/Region)
        • Sales Footprint
        • Strategy Overview
          • Marketing Strategy
          • Product Strategy
          • Channel Strategy
      • CEVA Logistics
        • Overview
        • Product Portfolio
        • Profitability by Market Segments (Product/Age /Sales Channel/Region)
        • Sales Footprint
        • Strategy Overview
          • Marketing Strategy
          • Product Strategy
          • Channel Strategy
      • Marken
        • Overview
        • Product Portfolio
        • Profitability by Market Segments (Product/Age /Sales Channel/Region)
        • Sales Footprint
        • Strategy Overview
          • Marketing Strategy
          • Product Strategy
          • Channel Strategy
      • Agility
        • Overview
        • Product Portfolio
        • Profitability by Market Segments (Product/Age /Sales Channel/Region)
        • Sales Footprint
        • Strategy Overview
          • Marketing Strategy
          • Product Strategy
          • Channel Strategy
      • Rhenus Group
        • Overview
        • Product Portfolio
        • Profitability by Market Segments (Product/Age /Sales Channel/Region)
        • Sales Footprint
        • Strategy Overview
          • Marketing Strategy
          • Product Strategy
          • Channel Strategy
      • MNX Global Logistics
        • Overview
        • Product Portfolio
        • Profitability by Market Segments (Product/Age /Sales Channel/Region)
        • Sales Footprint
        • Strategy Overview
          • Marketing Strategy
          • Product Strategy
          • Channel Strategy
      • CRYOPDP
        • Overview
        • Product Portfolio
        • Profitability by Market Segments (Product/Age /Sales Channel/Region)
        • Sales Footprint
        • Strategy Overview
          • Marketing Strategy
          • Product Strategy
          • Channel Strategy
      • Langham Logistics
        • Overview
        • Product Portfolio
        • Profitability by Market Segments (Product/Age /Sales Channel/Region)
        • Sales Footprint
        • Strategy Overview
          • Marketing Strategy
          • Product Strategy
          • Channel Strategy
      • Life Science Logistics
        • Overview
        • Product Portfolio
        • Profitability by Market Segments (Product/Age /Sales Channel/Region)
        • Sales Footprint
        • Strategy Overview
          • Marketing Strategy
          • Product Strategy
          • Channel Strategy
      • Biocair
        • Overview
        • Product Portfolio
        • Profitability by Market Segments (Product/Age /Sales Channel/Region)
        • Sales Footprint
        • Strategy Overview
          • Marketing Strategy
          • Product Strategy
          • Channel Strategy
  20. Assumptions & Acronyms Used
  21. Research Methodology

List of Tables

  • Table 1: Global Market Value (USD Billion) Forecast by Region, 2020-2035
  • Table 2: Global Market Volume (Metric Tons) Forecast by Region, 2020-2035
  • Table 3: Global Market Value (USD Billion) Forecast by Service Type, 2020-2035
  • Table 4: Global Market Volume (Metric Tons) Forecast by Service Type, 2020-2035
  • Table 5: Global Market Value (USD Billion) Forecast by Application, 2020-2035
  • Table 6: Global Market Volume (Metric Tons) Forecast by Application, 2020-2035
  • Table 7: Global Market Value (USD Billion) Forecast by End User, 2020-2035
  • Table 8: Global Market Volume (Metric Tons) Forecast by End User, 2020-2035
  • Table 9: North America Market Value (USD Billion) Forecast by Country, 2020-2035
  • Table 10: North America Market Volume (Metric Tons) Forecast by Country, 2020-2035
  • Table 11: North America Market Value (USD Billion) Forecast by Service Type, 2020-2035
  • Table 12: North America Market Volume (Metric Tons) Forecast by Service Type, 2020-2035
  • Table 13: North America Market Value (USD Billion) Forecast by Application, 2020-2035
  • Table 14: North America Market Volume (Metric Tons) Forecast by Application, 2020-2035
  • Table 15: North America Market Value (USD Billion) Forecast by End User, 2020-2035
  • Table 16: North America Market Volume (Metric Tons) Forecast by End User, 2020-2035
  • Table 17: Latin America Market Value (USD Billion) Forecast by Country, 2020-2035
  • Table 18: Latin America Market Volume (Metric Tons) Forecast by Country, 2020-2035
  • Table 19: Latin America Market Value (USD Billion) Forecast by Service Type, 2020-2035
  • Table 20: Latin America Market Volume (Metric Tons) Forecast by Service Type, 2020-2035
  • Table 21: Latin America Market Value (USD Billion) Forecast by Application, 2020-2035
  • Table 22: Latin America Market Volume (Metric Tons) Forecast by Application, 2020-2035
  • Table 23: Latin America Market Value (USD Billion) Forecast by End User, 2020-2035
  • Table 24: Latin America Market Volume (Metric Tons) Forecast by End User, 2020-2035
  • Table 25: Western Europe Market Value (USD Billion) Forecast by Country, 2020-2035
  • Table 26: Western Europe Market Volume (Metric Tons) Forecast by Country, 2020-2035
  • Table 27: Western Europe Market Value (USD Billion) Forecast by Service Type, 2020-2035
  • Table 28: Western Europe Market Volume (Metric Tons) Forecast by Service Type, 2020-2035
  • Table 29: Western Europe Market Value (USD Billion) Forecast by Application, 2020-2035
  • Table 30: Western Europe Market Volume (Metric Tons) Forecast by Application, 2020-2035
  • Table 31: Western Europe Market Value (USD Billion) Forecast by End User, 2020-2035
  • Table 32: Western Europe Market Volume (Metric Tons) Forecast by End User, 2020-2035
  • Table 33: Eastern Europe Market Value (USD Billion) Forecast by Country, 2020-2035
  • Table 34: Eastern Europe Market Volume (Metric Tons) Forecast by Country, 2020-2035
  • Table 35: Eastern Europe Market Value (USD Billion) Forecast by Service Type, 2020-2035
  • Table 36: Eastern Europe Market Volume (Metric Tons) Forecast by Service Type, 2020-2035
  • Table 37: Eastern Europe Market Value (USD Billion) Forecast by Application, 2020-2035
  • Table 38: Eastern Europe Market Volume (Metric Tons) Forecast by Application, 2020-2035
  • Table 39: Eastern Europe Market Value (USD Billion) Forecast by End User, 2020-2035
  • Table 40: Eastern Europe Market Volume (Metric Tons) Forecast by End User, 2020-2035
  • Table 41: East Asia Market Value (USD Billion) Forecast by Country, 2020-2035
  • Table 42: East Asia Market Volume (Metric Tons) Forecast by Country, 2020-2035
  • Table 43: East Asia Market Value (USD Billion) Forecast by Service Type, 2020-2035
  • Table 44: East Asia Market Volume (Metric Tons) Forecast by Service Type, 2020-2035
  • Table 45: East Asia Market Value (USD Billion) Forecast by Application, 2020-2035
  • Table 46: East Asia Market Volume (Metric Tons) Forecast by Application, 2020-2035
  • Table 47: East Asia Market Value (USD Billion) Forecast by End User, 2020-2035
  • Table 48: East Asia Market Volume (Metric Tons) Forecast by End User, 2020-2035
  • Table 49: South Asia & Pacific Market Value (USD Billion) Forecast by Country, 2020-2035
  • Table 50: South Asia & Pacific Market Volume (Metric Tons) Forecast by Country, 2020-2035
  • Table 51: South Asia & Pacific Market Value (USD Billion) Forecast by Service Type, 2020-2035
  • Table 52: South Asia & Pacific Market Volume (Metric Tons) Forecast by Service Type, 2020-2035
  • Table 53: South Asia & Pacific Market Value (USD Billion) Forecast by Application, 2020-2035
  • Table 54: South Asia & Pacific Market Volume (Metric Tons) Forecast by Application, 2020-2035
  • Table 55: South Asia & Pacific Market Value (USD Billion) Forecast by End User, 2020-2035
  • Table 56: South Asia & Pacific Market Volume (Metric Tons) Forecast by End User, 2020-2035
  • Table 57: Middle East and Africa Market Value (USD Billion) Forecast by Country, 2020-2035
  • Table 58: Middle East and Africa Market Volume (Metric Tons) Forecast by Country, 2020-2035
  • Table 59: Middle East and Africa Market Value (USD Billion) Forecast by Service Type, 2020-2035
  • Table 60: Middle East and Africa Market Volume (Metric Tons) Forecast by Service Type, 2020-2035
  • Table 61: Middle East and Africa Market Value (USD Billion) Forecast by Application, 2020-2035
  • Table 62: Middle East and Africa Market Volume (Metric Tons) Forecast by Application, 2020-2035
  • Table 63: Middle East and Africa Market Value (USD Billion) Forecast by End User, 2020-2035
  • Table 64: Middle East and Africa Market Volume (Metric Tons) Forecast by End User, 2020-2035

List of Figures

  • Figure 1: Global Market Volume (Metric Tons) Forecast 2020-2035
  • Figure 2: Global Market Pricing Analysis
  • Figure 3: Global Market Value (USD Billion) Forecast 2020-2035
  • Figure 4: Global Market Value Share and BPS Analysis by Service Type, 2025 and 2035
  • Figure 5: Global Market Y-o-Y Growth Comparison by Service Type, 2025-2035
  • Figure 6: Global Market Attractiveness Analysis by Service Type
  • Figure 7: Global Market Value Share and BPS Analysis by Application, 2025 and 2035
  • Figure 8: Global Market Y-o-Y Growth Comparison by Application, 2025-2035
  • Figure 9: Global Market Attractiveness Analysis by Application
  • Figure 10: Global Market Value Share and BPS Analysis by End User, 2025 and 2035
  • Figure 11: Global Market Y-o-Y Growth Comparison by End User, 2025-2035
  • Figure 12: Global Market Attractiveness Analysis by End User
  • Figure 13: Global Market Value (USD Billion) Share and BPS Analysis by Region, 2025 and 2035
  • Figure 14: Global Market Y-o-Y Growth Comparison by Region, 2025-2035
  • Figure 15: Global Market Attractiveness Analysis by Region
  • Figure 16: North America Market Incremental $ Opportunity, 2025-2035
  • Figure 17: Latin America Market Incremental $ Opportunity, 2025-2035
  • Figure 18: Western Europe Market Incremental $ Opportunity, 2025-2035
  • Figure 19: Eastern Europe Market Incremental $ Opportunity, 2025-2035
  • Figure 20: East Asia Market Incremental $ Opportunity, 2025-2035
  • Figure 21: South Asia & Pacific Market Incremental $ Opportunity, 2025-2035
  • Figure 22: Middle East and Africa Market Incremental $ Opportunity, 2025-2035
  • Figure 23: North America Market Value Share and BPS Analysis by Country, 2025 and 2035
  • Figure 24: North America Market Value Share and BPS Analysis by Service Type, 2025 and 2035
  • Figure 25: North America Market Y-o-Y Growth Comparison by Service Type, 2025-2035
  • Figure 26: North America Market Attractiveness Analysis by Service Type
  • Figure 27: North America Market Value Share and BPS Analysis by Application, 2025 and 2035
  • Figure 28: North America Market Y-o-Y Growth Comparison by Application, 2025-2035
  • Figure 29: North America Market Attractiveness Analysis by Application
  • Figure 30: North America Market Value Share and BPS Analysis by End User, 2025 and 2035
  • Figure 31: North America Market Y-o-Y Growth Comparison by End User, 2025-2035
  • Figure 32: North America Market Attractiveness Analysis by End User
  • Figure 33: Latin America Market Value Share and BPS Analysis by Country, 2025 and 2035
  • Figure 34: Latin America Market Value Share and BPS Analysis by Service Type, 2025 and 2035
  • Figure 35: Latin America Market Y-o-Y Growth Comparison by Service Type, 2025-2035
  • Figure 36: Latin America Market Attractiveness Analysis by Service Type
  • Figure 37: Latin America Market Value Share and BPS Analysis by Application, 2025 and 2035
  • Figure 38: Latin America Market Y-o-Y Growth Comparison by Application, 2025-2035
  • Figure 39: Latin America Market Attractiveness Analysis by Application
  • Figure 40: Latin America Market Value Share and BPS Analysis by End User, 2025 and 2035
  • Figure 41: Latin America Market Y-o-Y Growth Comparison by End User, 2025-2035
  • Figure 42: Latin America Market Attractiveness Analysis by End User
  • Figure 43: Western Europe Market Value Share and BPS Analysis by Country, 2025 and 2035
  • Figure 44: Western Europe Market Value Share and BPS Analysis by Service Type, 2025 and 2035
  • Figure 45: Western Europe Market Y-o-Y Growth Comparison by Service Type, 2025-2035
  • Figure 46: Western Europe Market Attractiveness Analysis by Service Type
  • Figure 47: Western Europe Market Value Share and BPS Analysis by Application, 2025 and 2035
  • Figure 48: Western Europe Market Y-o-Y Growth Comparison by Application, 2025-2035
  • Figure 49: Western Europe Market Attractiveness Analysis by Application
  • Figure 50: Western Europe Market Value Share and BPS Analysis by End User, 2025 and 2035
  • Figure 51: Western Europe Market Y-o-Y Growth Comparison by End User, 2025-2035
  • Figure 52: Western Europe Market Attractiveness Analysis by End User
  • Figure 53: Eastern Europe Market Value Share and BPS Analysis by Country, 2025 and 2035
  • Figure 54: Eastern Europe Market Value Share and BPS Analysis by Service Type, 2025 and 2035
  • Figure 55: Eastern Europe Market Y-o-Y Growth Comparison by Service Type, 2025-2035
  • Figure 56: Eastern Europe Market Attractiveness Analysis by Service Type
  • Figure 57: Eastern Europe Market Value Share and BPS Analysis by Application, 2025 and 2035
  • Figure 58: Eastern Europe Market Y-o-Y Growth Comparison by Application, 2025-2035
  • Figure 59: Eastern Europe Market Attractiveness Analysis by Application
  • Figure 60: Eastern Europe Market Value Share and BPS Analysis by End User, 2025 and 2035
  • Figure 61: Eastern Europe Market Y-o-Y Growth Comparison by End User, 2025-2035
  • Figure 62: Eastern Europe Market Attractiveness Analysis by End User
  • Figure 63: East Asia Market Value Share and BPS Analysis by Country, 2025 and 2035
  • Figure 64: East Asia Market Value Share and BPS Analysis by Service Type, 2025 and 2035
  • Figure 65: East Asia Market Y-o-Y Growth Comparison by Service Type, 2025-2035
  • Figure 66: East Asia Market Attractiveness Analysis by Service Type
  • Figure 67: East Asia Market Value Share and BPS Analysis by Application, 2025 and 2035
  • Figure 68: East Asia Market Y-o-Y Growth Comparison by Application, 2025-2035
  • Figure 69: East Asia Market Attractiveness Analysis by Application
  • Figure 70: East Asia Market Value Share and BPS Analysis by End User, 2025 and 2035
  • Figure 71: East Asia Market Y-o-Y Growth Comparison by End User, 2025-2035
  • Figure 72: East Asia Market Attractiveness Analysis by End User
  • Figure 73: South Asia & Pacific Market Value Share and BPS Analysis by Country, 2025 and 2035
  • Figure 74: South Asia & Pacific Market Value Share and BPS Analysis by Service Type, 2025 and 2035
  • Figure 75: South Asia & Pacific Market Y-o-Y Growth Comparison by Service Type, 2025-2035
  • Figure 76: South Asia & Pacific Market Attractiveness Analysis by Service Type
  • Figure 77: South Asia & Pacific Market Value Share and BPS Analysis by Application, 2025 and 2035
  • Figure 78: South Asia & Pacific Market Y-o-Y Growth Comparison by Application, 2025-2035
  • Figure 79: South Asia & Pacific Market Attractiveness Analysis by Application
  • Figure 80: South Asia & Pacific Market Value Share and BPS Analysis by End User, 2025 and 2035
  • Figure 81: South Asia & Pacific Market Y-o-Y Growth Comparison by End User, 2025-2035
  • Figure 82: South Asia & Pacific Market Attractiveness Analysis by End User
  • Figure 83: Middle East and Africa Market Value Share and BPS Analysis by Country, 2025 and 2035
  • Figure 84: Middle East and Africa Market Value Share and BPS Analysis by Service Type, 2025 and 2035
  • Figure 85: Middle East and Africa Market Y-o-Y Growth Comparison by Service Type, 2025-2035
  • Figure 86: Middle East and Africa Market Attractiveness Analysis by Service Type
  • Figure 87: Middle East and Africa Market Value Share and BPS Analysis by Application, 2025 and 2035
  • Figure 88: Middle East and Africa Market Y-o-Y Growth Comparison by Application, 2025-2035
  • Figure 89: Middle East and Africa Market Attractiveness Analysis by Application
  • Figure 90: Middle East and Africa Market Value Share and BPS Analysis by End User, 2025 and 2035
  • Figure 91: Middle East and Africa Market Y-o-Y Growth Comparison by End User, 2025-2035
  • Figure 92: Middle East and Africa Market Attractiveness Analysis by End User
  • Figure 93: Global Market - Tier Structure Analysis
  • Figure 94: Global Market - Company Share Analysis

Frequently Asked Questions

What is the projected size of the life science logistics market in 2025 and 2035?

The industry size is projected to be USD 19.1 billion in 2025 and USD 41.3 billion by 2035.

What is the expected CAGR for the life science logistics market from 2025 to 2035?

The expected CAGR is 8% from 2025 to 2035.

Which country is expected to grow the fastest in the life science logistics market?

India is expected to grow the fastest with a projected CAGR of 9.2% from 2025 to 2035.

Who is the leading company in the life science logistics market?

DHL is the leading company, holding a 25% industry share.

Which end-user segment leads the life science logistics market in 2025?

Pharmaceutical companies lead the end-user segment with a 55% industry share in 2025.

Explore Similar Insights

Future Market Insights

Life Science Logistics Market