The Life Science Software Market is estimated to be valued at USD 15.9 billion in 2025 and is projected to reach USD 31.6 billion by 2035, registering a compound annual growth rate (CAGR) of 7.1% over the forecast period.
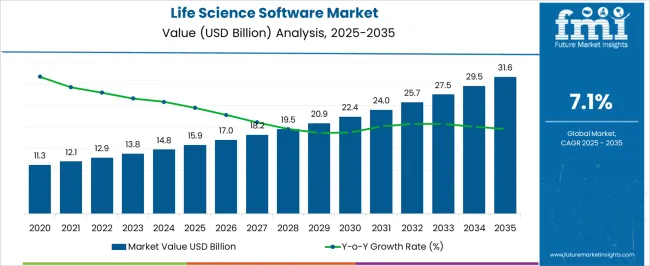
| Metric | Value |
|---|---|
| Life Science Software Market Estimated Value in (2025 E) | USD 15.9 billion |
| Life Science Software Market Forecast Value in (2035 F) | USD 31.6 billion |
| Forecast CAGR (2025 to 2035) | 7.1% |
The life science software market is experiencing steady expansion, driven by the increasing complexity of research data, rising demand for digital solutions in clinical workflows, and the need for regulatory compliance across the biopharmaceutical industry. Industry announcements and company disclosures have highlighted growing investment in software platforms designed to enhance drug discovery, streamline clinical trials, and support laboratory automation.
The adoption of artificial intelligence, advanced analytics, and cloud-enabled solutions has strengthened capabilities in data integration, predictive modeling, and real-time monitoring. Healthcare systems and research institutions are placing greater emphasis on efficiency and accuracy in managing sensitive scientific data, further driving the adoption of specialized software platforms.
Investor reports have underlined the biopharmaceutical sector’s role as a major growth contributor, supported by expanding drug pipelines and global clinical trial activity. Looking ahead, the market is expected to progress through continuous innovation in cloud-based systems, digital twin technologies, and integrated platforms designed for collaboration between researchers, healthcare providers, and regulators.
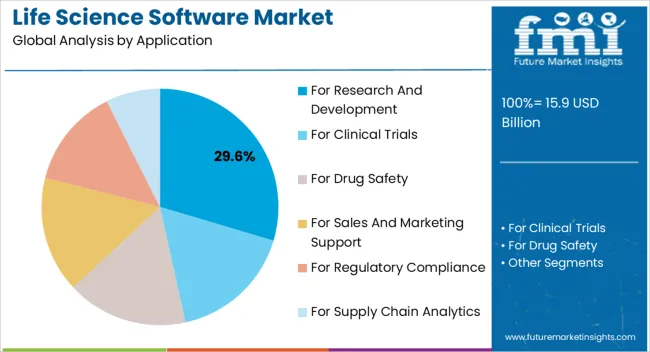
The For Research and Development segment is projected to account for 29.60% of the life science software market revenue in 2025, reflecting its central role in advancing drug discovery and molecular biology studies. Growth of this segment has been driven by the increasing reliance on digital tools to manage high-throughput data from genomics, proteomics, and other life science research domains.
Research institutions and laboratories have adopted software platforms that facilitate simulation, data modeling, and predictive analytics to reduce development timelines and improve reproducibility. Academic and industry collaborations have emphasized the importance of integrated R&D software for accelerating innovation and reducing costs associated with experimental inefficiencies.
As scientific research continues to generate complex datasets, software tailored for R&D applications is expected to remain essential for managing workflow automation and supporting early-stage discovery programs.
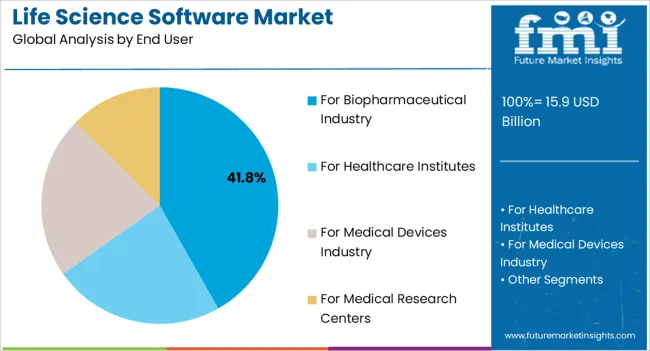
The For Biopharmaceutical Industry segment is projected to capture 41.80% of the life science software market revenue in 2025, establishing itself as the leading end-user category. This dominance has been supported by the biopharmaceutical sector’s extensive use of software to manage regulatory compliance, optimize clinical trials, and streamline drug manufacturing.
Company disclosures and industry updates have indicated significant investments in digital platforms to integrate laboratory information systems, electronic data capture, and pharmacovigilance solutions. The increasing size and complexity of global drug pipelines have necessitated software systems that ensure data integrity, patient safety, and compliance with international regulatory standards.
Additionally, the adoption of real-time analytics has enhanced biopharmaceutical companies’ ability to monitor clinical trial progress and manufacturing outcomes. These factors have reinforced the segment’s leadership and its continuing growth trajectory in the life science software market.
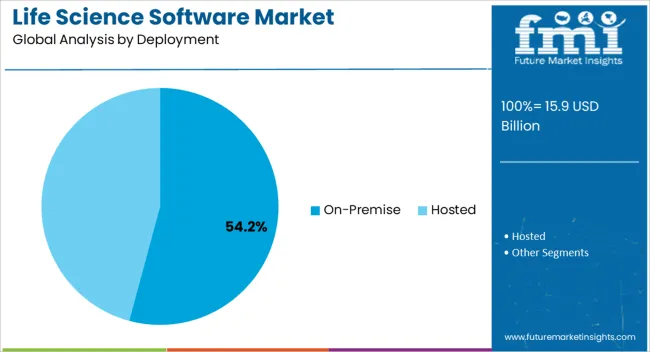
The On-Premise segment is projected to hold 54.20% of the life science software market revenue in 2025, maintaining its position as the dominant deployment model. Growth of this segment has been driven by the biopharmaceutical industry’s emphasis on data security, regulatory compliance, and control over sensitive information.
On-premise solutions have been preferred by organizations handling proprietary research data, where local infrastructure ensures restricted access and reduced vulnerability to external threats. Annual reports and IT investment disclosures have highlighted that on-premise systems remain integral to institutions managing large-scale laboratory operations and clinical data warehouses.
Although cloud-based deployment is gaining momentum, the need for stringent data protection in regulated environments has sustained demand for on-premise systems. Furthermore, integration with existing legacy infrastructure has made on-premise deployment a practical choice for many life science organizations. As cybersecurity and compliance requirements continue to evolve, the On-Premise segment is expected to retain its leadership while coexisting with hybrid and cloud-based solutions in the future market landscape.
Continuous technological innovations, the accessibility of big data in the life science industry, the increasing adoption of analytics techniques in clinics and hospitals as well as for sales and promotion in the pharmaceutical companies, and the burgeoning need for enhanced patient care shipment are some of the major factors driving the expansion of the life science software market.
Furthermore, factors such as an increase in the frequency of chronic diseases, massive pressure to reduce healthcare spending, and a bigger emphasis on value-based medicine all contribute to the significant growth of this market.
However, aspects such as the elevated cost of implementing life science software, complex programming, additional infrastructure, and data management costs limit the expansion of the life science software market.
Due to the elevated adoption of cutting-edge technologies and a substantial majority of investments, North America dominates the life science software market. Because of the escalating digitization of healthcare-related work processes and the presence of major healthcare firms implementing this software in these regions, North America is the leading market in the life science software market. It is expected to grow rapidly over the next decade.
The United States is the key industry in North America for life science software. The market in this region will develop faster than South America's. The demand for security, easy access to data, and productive patient information management will aid the growth of the life science software industry. North America is accounting for a market share of 40.5% of the global life science software market.
The European life science software market is expected to grow at a 9% CAGR. During the forecast period, the European life science software sector is predicted to account for the largest share of the global market. Geographically, the European life science software market accounted for a sizable share of the overall in 2024 and is anticipated to grow at a healthy rate during the forecast period.
During the forecast period, the German life science software market is expected to be a lucrative business regional market in Europe. The German market benefits from social advancements such as censuses and technological advancements such as digitization. The growing use of IoT and cloud computing is expected to boost the life science software market. Europe is accounting for a market share of 24% of the global life science software market.
The biopharmaceutical segment's life science software market share will develop significantly during the forecast period. Life science software can benefit biopharmaceutical companies by providing a global healthcare standard. It bolsters the functionalities of logistic partners and collaborates with trading partners such as contract packagers. During the forecast period, these characteristics will drive segment growth.
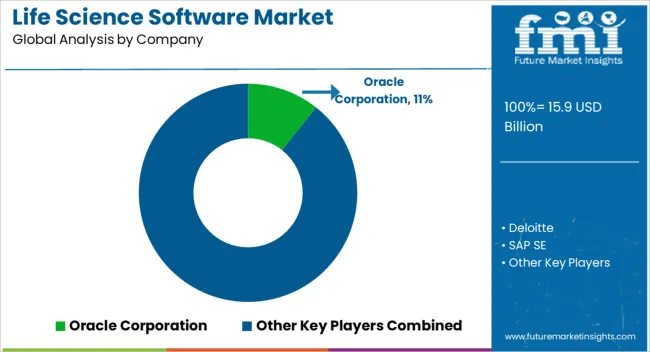
Manufacturers are adopting various marketing strategies such as new product launches, geographical expansion, mergers and acquisitions, partnerships, and collaboration to identify the interests of potential buyers and create a larger customer base. For instance,
Some of the leading life science software providers include Oracle Corporation, Deloitte, SAP SE, Accelrys Software, Inc., Cegedim SA, Medidata Solution, Inc., Revitas, Inc., Veeva Systems, Inc., Model N, Inc., SAS Institute, Inc., PTC Therapeutics, Inc., TIBCO Software, Inc., and Perceptive Informatics, Inc.
These key life science software providers are adopting various strategies, such as new product launches and approvals, partnerships, collaborations, acquisitions, mergers, etc., to increase their sales and gain a competitive edge in the global life science software market. For instance,
| Report Attribute | Details |
|---|---|
| Growth Rate | CAGR of 7.1% from 2025 to 2035 |
| Expected Market Value (2025) | USD 15.9 billion |
| Anticipated Forecast Value (2035) | USD 31.6 billion |
| Base Year for Estimation | 2025 |
| Historical Data | 2020 to 2025 |
| Forecast Period | 2025 to 2035 |
| Quantitative Units | Revenue in USD million and CAGR from 2025 to 2035 |
| Report Coverage | Revenue Forecast, Volume Forecast, Company Ranking, Competitive Landscape, Growth Factors, Trends and Pricing Analysis |
| Segments Covered | Application, End User, Deployment, Region |
| Regions Covered | North America; Latin America; Europe; South Asia; East Asia; Oceania; Middle East & Africa |
| Key Countries Profiled | United States, Canada, Mexico, Brazil, Germany, Italy, UK, Spain, France, China, Japan, South Korea, India, Malaysia, Singapore, Thailand, Australia, New Zealand, GCC, South Africa, Israel |
| Key Companies Profiled | Oracle Corporation; Deloitte; SAP SE; Accelrys Software Inc.; Cegedim SA; Medidata Solution Inc.; Revitas Inc.; Veeva Systems Inc.; Model N Inc.; SAS Institute Inc.; PTC Therapeutics Inc.; TIBCO Software Inc.; Perceptive Informatics Inc. |
| Customization | Available Upon Request |
The global life science software market is estimated to be valued at USD 15.9 billion in 2025.
The market size for the life science software market is projected to reach USD 31.6 billion by 2035.
The life science software market is expected to grow at a 7.1% CAGR between 2025 and 2035.
The key product types in life science software market are for research and development, for clinical trials, for drug safety, for sales and marketing support, for regulatory compliance and for supply chain analytics.
In terms of end user, for biopharmaceutical industry segment to command 41.8% share in the life science software market in 2025.


Our Research Products

The "Full Research Suite" delivers actionable market intel, deep dives on markets or technologies, so clients act faster, cut risk, and unlock growth.

The Leaderboard benchmarks and ranks top vendors, classifying them as Established Leaders, Leading Challengers, or Disruptors & Challengers.

Locates where complements amplify value and substitutes erode it, forecasting net impact by horizon

We deliver granular, decision-grade intel: market sizing, 5-year forecasts, pricing, adoption, usage, revenue, and operational KPIs—plus competitor tracking, regulation, and value chains—across 60 countries broadly.

Spot the shifts before they hit your P&L. We track inflection points, adoption curves, pricing moves, and ecosystem plays to show where demand is heading, why it is changing, and what to do next across high-growth markets and disruptive tech

Real-time reads of user behavior. We track shifting priorities, perceptions of today’s and next-gen services, and provider experience, then pace how fast tech moves from trial to adoption, blending buyer, consumer, and channel inputs with social signals (#WhySwitch, #UX).

Partner with our analyst team to build a custom report designed around your business priorities. From analysing market trends to assessing competitors or crafting bespoke datasets, we tailor insights to your needs.
Supplier Intelligence
Discovery & Profiling
Capacity & Footprint
Performance & Risk
Compliance & Governance
Commercial Readiness
Who Supplies Whom
Scorecards & Shortlists
Playbooks & Docs
Category Intelligence
Definition & Scope
Demand & Use Cases
Cost Drivers
Market Structure
Supply Chain Map
Trade & Policy
Operating Norms
Deliverables
Buyer Intelligence
Account Basics
Spend & Scope
Procurement Model
Vendor Requirements
Terms & Policies
Entry Strategy
Pain Points & Triggers
Outputs
Pricing Analysis
Benchmarks
Trends
Should-Cost
Indexation
Landed Cost
Commercial Terms
Deliverables
Brand Analysis
Positioning & Value Prop
Share & Presence
Customer Evidence
Go-to-Market
Digital & Reputation
Compliance & Trust
KPIs & Gaps
Outputs
Full Research Suite comprises of:
Market outlook & trends analysis
Interviews & case studies
Strategic recommendations
Vendor profiles & capabilities analysis
5-year forecasts
8 regions and 60+ country-level data splits
Market segment data splits
12 months of continuous data updates
DELIVERED AS:
PDF EXCEL ONLINE
Life Sciences Next-generation Customer Engagement Platforms Market Size and Share Forecast Outlook 2025 to 2035
Life Science Multichannel Campaign Management Market Size and Share Forecast Outlook 2025 to 2035
Life Sciences Analytics Market Size and Share Forecast Outlook 2025 to 2035
Life Science Logistics Market Analysis - Size, Share, and Forecast Outlook 2025 to 2035
Life Science and Chemical Instruments Market Analysis - Growth & Forecast 2024 to 2034
Software-Defined Wide Area Network Market Size and Share Forecast Outlook 2025 to 2035
Life Support Systems Market Size and Share Forecast Outlook 2025 to 2035
Software Defined Vehicle Market Size and Share Forecast Outlook 2025 to 2035
Software Defined Networking (SDN) And Network Function Virtualization (NFV) Market Size and Share Forecast Outlook 2025 to 2035
Software Defined Perimeter (SDP) Market Size and Share Forecast Outlook 2025 to 2035
Software-Defined Wide Area Network SD-WAN Market Size and Share Forecast Outlook 2025 to 2035
Software Defined Radio (SDR) Market Size and Share Forecast Outlook 2025 to 2035
Software License Management (SLM) Market Size and Share Forecast Outlook 2025 to 2035
Lifestyle Concierge Services Market Size and Share Forecast Outlook 2025 to 2035
Software-Defined Networking SDN Market Size and Share Forecast Outlook 2025 to 2035
Software-Defined Anything (SDx) Market Size and Share Forecast Outlook 2025 to 2035
Software-Defined Data Center Market Size and Share Forecast Outlook 2025 to 2035
Software Containers Market Size and Share Forecast Outlook 2025 to 2035
Software Defined Application And Infrastructure Market Size and Share Forecast Outlook 2025 to 2035
Software Defined Networking Market Size and Share Forecast Outlook 2025 to 2035

Thank you!
You will receive an email from our Business Development Manager. Please be sure to check your SPAM/JUNK folder too.
Chat With
MaRIA