
- Market Size (2026)
- USD 556.4 Mn
- Forecast (2036)
- USD 1094.5 Mn
- CAGR (2026 to 2036)
- 7.0%
How big is the Long-Chain Dicarboxylic Acid Market in 2026?
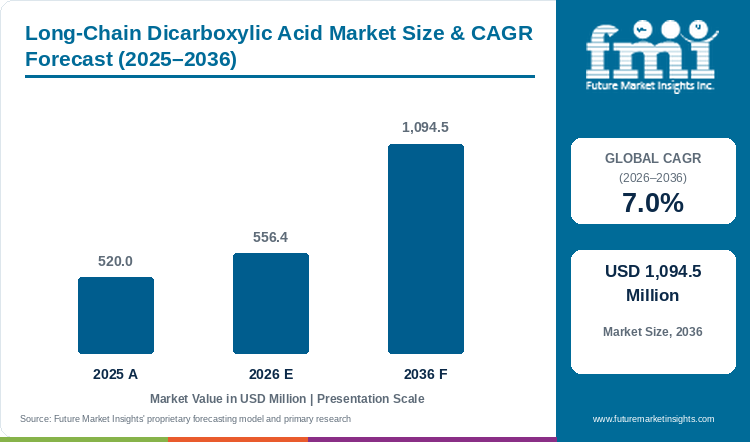
Revenue in the global long-chain dicarboxylic acid market is forecast to climb to USD 1,094.5 million in 2036 at a CAGR of 7.0% from 2026 to 2036. The market was valued at USD 520.0 million in 2025, with USD 556.4 million estimated for 2026.
Polymer qualification drives a sales cycle separate from plant expansion. Cathay Biotech's 2025 annual report described downstream bio-based polyamide commercialization as dependent on customer certification and process adaptation.FMI reads this as showing that established monomer demand and new polymer projects must be assessed separately. An acid producer can ship recurring volumes while a downstream material still needs application approval.
Evonik's November 2025 announcement reported trial production at a second Shanghai polyamides reactor. The company identified AABB polyamides among its planned local products and scheduled operations for December 2025. Such investment supports the case for regional polymer supply. The strongest opening lies with acid grades already accepted in a polymer recipe, followed by applications that justify a new qualification. FMI therefore expects grade consistency and customer conversion pace to matter alongside output. Broader polyamide market analysis provides the downstream context.
Key Market Trends & Insights
- Buyers specify purity by the named molecule as well as total acids. Cathay specifies DC12 purity of at least 98.5% and total acids of at least 99.0%. A total-acid result does not define polymer feedstock equivalence.
- DC12 has a route into coating formulations with different purchasing cycles from engineering plastics. UBE identifies DDA as a curing agent for acrylic powder paints as well as a resin intermediate.
- Carbon-origin documentation is becoming a point of differentiation. Evonik's technical literature distinguishes PA1012 made with fossil-derived DC12 from a version using biomass-derived DC12. The finished polymer must still meet its application specification.
Regional Highlights
- Global share rises for China and India. FMI projects China at 41.9% against 38.0% in 2026 and India at 6.0% against 5.0% in 2026 by 2036.
- Revenue rises in Japan, the United States and Germany, though each loses global share. FMI projects Japan at 6.7% against 8.0% in 2026, the United States at 12.8% against 14.0% in 2026 and Germany at 7.0% against 8.0% in 2026 by 2036.
Long-Chain Dicarboxylic Acid Market Size and Forecast
Table 1: Long-Chain Dicarboxylic Acid Market Size and Forecast
| Market size and forecast | Value |
|---|---|
| Market size in 2025 | USD 520.0 million |
| Estimated market size in 2026 | USD 556.4 million |
| Projected market size by 2036 | USD 1,094.5 million |
| CAGR from 2026 to 2036 | 7.0% |
Source: Future Market Insights analysis of the Long-Chain dicarboxylic acid market, 2026.
Analyst Perspective
“FMI expects the most durable contracts to remain attached to a specific acid grade and an approved conversion process. The faster opportunity in longer-chain products will require development work before it produces repeat sales. Producers that manage this transition well will expand their product mix without weakening delivery performance for established DC12 customers.”
- Nikhil Kaitwade, Principal Consultant, FMI
How is the Long-Chain Dicarboxylic Acid Market segmented?
- By carbon chain: DC12 dodecanedioic acid, DC10 sebacic acid and DC13 to DC14, and DC15 to DC18.
- By application: Nylon and polyamide, Coatings and powder coatings, Lubricants and greases, Fragrances and adhesives, and Other.
- By production route: Fermentation-Based and Chemical Synthesis.
- By region: North America, Western Europe, East Asia, South Asia, Latin America, and Rest of world.
Why does the DC12 dodecanedioic acid segment lead by Carbon Chain in the Long-Chain Dicarboxylic Acid Market in 2026?
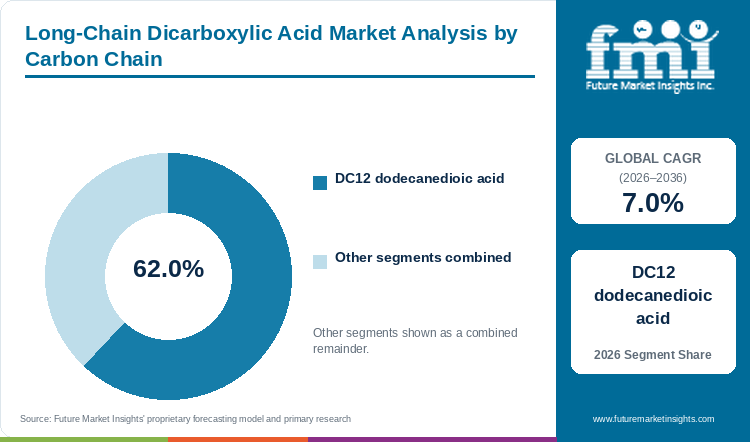
The DC12 dodecanedioic acid segment holds 62.0% of the Long-Chain Dicarboxylic Acid Market by carbon chain in 2026.
DC12 benefits from several established conversion routes. Its position is supported by polymer demand but is not confined to a single nylon. UBE's DDA portfolio identifies polyester and polyurethane resins alongside polyamides. This diversity spreads commercial exposure across customers whose requirements differ in curing behavior, color, and final product duty. A downturn in one polymer application therefore need not affect the entire DC12 order book at the same rate.
The leading category generates USD 345.0 million in 2026 and reaches USD 647.5 million by 2036. Its 6.5% CAGR is below the total market's 7.0%. FMI expects that difference to reduce DC12's share without displacing its central role. Producers serving both polymer and coating customers have a reason to preserve DC12 process stability while developing additional chain lengths.
The buying decision also reaches beyond the purity headline. A customer evaluating another production route needs evidence that its own resin or ester remains within specification. New entrants face the cost of qualifying a grade before they can compete for regular deliveries. Existing DC12 suppliers retain an advantage where repeat batches have already been accepted.
DC10 sebacic acid and DC13 to DC14 and DC15 to DC18 together hold the remaining 38.0% by carbon chain.
Table 2: Carbon Chain, 2026 Share
| Leading Share | 2026 market share |
|---|---|
| DC12 dodecanedioic acid | 62.0% |
| All Other Segments Combined Share | 38.0% |
Source: Future Market Insights analysis of the Long-Chain dicarboxylic acid market, 2026.
Why does the Nylon and polyamide segment lead by Application in the Long-Chain Dicarboxylic Acid Market in 2026?
The Nylon and polyamide segment holds 48.0% of the Long-Chain Dicarboxylic Acid Market by application in 2026.
The nylon opportunity is concentrated in particular chemistries. Terra literature describes PA1012 as a combination of decamethylene diamine and dodecanedioic acid. This is a direct link between an acid specification and a resin family. It is different from treating every long-chain nylon expansion as an equal source of diacid demand. PA12, PA11, and individual copolymers require their own monomer accounting.
Nylon and polyamide revenue reaches USD 267.1 million in 2026. It is forecast at USD 553.7 million by 2036, with a 7.6% CAGR. FMI expects growth to follow the conversion of approved materials into recurring production, particularly where a resin's moisture response and chemical resistance support demanding components. The PA612 offering includes automotive technical parts and plastic-rubber hybrids. Those capabilities explain the type of specification that can defend a specialty monomer position.
Alternative polymer selection remains a commercial limit. A successful application may choose another nylon, a different resin family, or a finished component imported from another region. Monomer suppliers therefore need access to the polymer developer as well as the final customer. Trials that resolve the resin recipe and the commercial production route have greater value than a broad expression of interest in lightweight materials.
Coatings and powder coatings, Lubricants and greases, Fragrances and adhesives and Other together account for the remaining 52.0% by application.
Table 3: Application, 2026 Share
| Leading Share | 2026 market share |
|---|---|
| Nylon and polyamide | 48.0% |
| All Other Segments Combined Share | 52.0% |
Source: Future Market Insights analysis of the Long-Chain dicarboxylic acid market, 2026.
Why does the Fermentation-Based segment lead by Production Route in the Long-Chain Dicarboxylic Acid Market in 2026?
The Fermentation-Based segment holds 60.0% of the Long-Chain Dicarboxylic Acid Market by production route in 2026.
Fermentation-based supply leads because a bio-based producer reported 100,847.1 tonnes of long-chain diacid sales in its 2025 annual report, and the same producer describes a series of biologically manufactured diacids from sebacic acid to octadecanedioic acid. Sales at that volume from a single route give polymer buyers a proven source against which to judge other routes.
Chemical synthesis keeps a separate position through established polymer producers. A customer qualified on one route cannot switch without repeating approval.
FMI's 2026 assessment values Fermentation-Based supply at USD 333.8 million. Customers that want documented carbon origin may favour the biological route, while others stay on chemical supply where a polymer is already approved. Producers should present route and specification together.
Chemical Synthesis together hold the remaining 40.0% by production route.
Table 4: Production Route, 2026 Share
| Leading Share | 2026 market share |
|---|---|
| Fermentation-Based | 60.0% |
| All Other Segments Combined Share | 40.0% |
Source: Future Market Insights analysis of the Long-Chain dicarboxylic acid market, 2026.
What are the key drivers restraints and opportunities?
Approved specialty polymers support repeat acid consumption. Slow customer conversion and production-route qualification constrain expansion, while longer-chain grades offer opportunities beyond the established DC12 mix.
Driver
Polymer and ester formulations create recurring orders once the acid grade and conversion process are accepted.
Restraint
New monomer supply must survive customer testing before additional output becomes repeat commercial demand.
Opportunity
DC15 to DC18 products and differentiated DC12 origins widen the commercial offer without requiring every customer to adopt the same resin chemistry.
How do purchasing rules and qualification affect Long-Chain dicarboxylic acid market demand?
The market's strongest driver is continuation of an approved formulation into regular output. New resin development is useful only when a processor can reproduce the required properties and obtain customer acceptance. The annual report makes clear that customer certification and process adaptation take time in the bio-based polyamide business.
FMI expects the nylon application to increase its revenue share during 2026 to 2036. Demand will depend on which resin grades enter production and where their monomers are sourced. Monomer manufacturers with an application team can address the customer's actual polymer result, including color or consistency concerns, before a purchasing decision. This work supports a repeat contract more directly than promotion of an undifferentiated bio-manufacturing claim. Adipic acid supplies the shorter-chain route into nylon and is covered in FMI's adipic acid market.
The hot melt adhesives market offers another downstream route. Only relevant polyamide and other acid-containing formulations translate into this market. Adhesive growth based on unrelated polymers must remain outside the diacid demand calculation.
What limits reliable Long-Chain dicarboxylic acid market supply and quality?
Grade changes can create delays even when chemical capacity is available. Processing guidance cautions against contamination between different polyamides. FMI interprets this as a reminder that similarity in a material name is insufficient for substitution. For acid suppliers, an approved polymer route may retain its incumbent monomer even when another acid offers an attractive purchase price.
Import procedures add a separate constraint. European registration responsibilities and US chemical import certification apply before a customer can freely treat an overseas offer as equivalent to domestic supply. They affect the cost and timing of establishing a compliant commercial route. A supplier should resolve responsibility for the substance and intended use before committing to a delivery schedule.
Where can suppliers win additional business in the Long-Chain dicarboxylic acid market?
FMI projects DC15 to DC18 revenue of USD 184.4 million in 2036. Growth in this category requires individual product development instead of simple extension of a DC12 sales contract. A producer able to separate and repeatedly supply the desired chain length has an opening with formulators whose requirements differ from standard nylon manufacture.
Coatings remain another focused outlet. UBE's documented acrylic powder-paint use establishes a specific DC12 application. Development activity in PFAS-free powder coatings is relevant to the wider formulation discussion, although PFAS removal does not itself require a long-chain diacid. The opportunity is to establish a defensible cure or resin function within a new formulation, with purchasing terms that recognize the work required to qualify it.
Long-Chain Dicarboxylic Acid Market by Country (2026 to 2036)
Table 5: Long-Chain Dicarboxylic Acid Market Country Growth Forecast
| Country | CAGR, 2026 to 2036 |
|---|---|
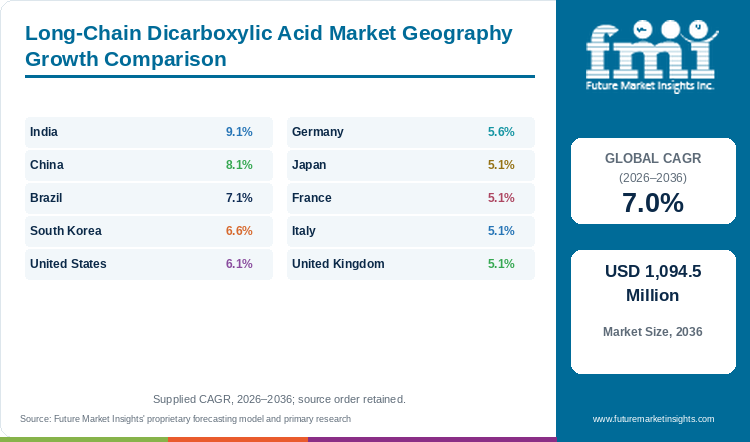
| India | 9.1% |
| China | 8.1% |
| Brazil | 7.1% |
| South Korea | 6.6% |
| United States | 6.1% |
| Germany | 5.6% |
| Japan | 5.1% |
| France | 5.1% |
| Italy | 5.1% |
| United Kingdom | 5.1% |
Source: Future Market Insights analysis of the Long-Chain dicarboxylic acid market, 2026.
India
India offers the fastest growth in the named country outlook, with revenue projected to rise from USD 27.8 million in 2026 to USD 66.2 million in 2036. The resulting 9.1% CAGR from 2026 to 2036 reflects a smaller starting base and a widening opportunity for specialty-material conversion.
SIAM's 2025 to 2026 annual report records passenger-vehicle domestic sales of about 4.6 million units and exports of about 0.9 million units. Export programs matter to material suppliers because a component specification may need to meet the requirements of several vehicle markets. The acid opportunity arises when a local resin or compound is selected for those programs. Increased vehicle shipments alone do not specify the monomer route.
India also deserves a chain-specific assessment. Technical literature identifies sebacic acid as the diacid used in PA610 and PA1010, while PA1012 uses DC12. A seller discussing renewable feedstocks must therefore connect the claim to the actual acid and polymer being purchased. The presence of a familiar plant-based feedstock does not make all bio-based polyamides interchangeable.
FMI expects application support and commercially workable order sizes to influence early purchases. A developing resin grade may begin with small qualification lots before the customer places larger orders. Suppliers that price these stages sensibly can build an account without forcing the buyer to hold excess material. India's opportunity is consequently as much about successful conversion projects as headline industrial growth.
China
China combines a major acid-production position with investment in downstream specialty materials. The 2025 report recorded higher diacid shipments alongside a separate discussion of slower polyamide customer conversion. FMI expects local acid demand to grow at an 8.1% CAGR from 2026 to 2036. Revenue rises from USD 211.4 million to USD 458.9 million, increasing China's allocation of global revenue. Revenue in China climbs by USD 247.5 million, first among the ten.
Domestic polymer development offers producers an opportunity to work through specification problems close to the conversion line. The opportunity is strongest where the customer's selected resin actually incorporates a C10 to C18 diacid. China's broader electric-vehicle or sports-material production cannot be counted indiscriminately as monomer demand. The November 2025 Shanghai announcement described an AABB polyamide and elastomer investment. The relevant commercial question is which products use purchased diacids and which rely on another monomer route.
FMI's interpretation is that local qualification capability helps convert a development relationship into a recurring acid contract. It also creates exposure to the customer's launch schedule. A producer expanding output before those programs mature must manage inventory and working capital while keeping established export grades consistent. China's position therefore rests on manufacturing continuity as well as new polymer programs. A larger local material-development base supports the forecast, but acid sales should still be assessed grade by grade.
Brazil
Brazil's growth argument includes expanding local industrial output, but the link to acid demand remains indirect. ANFAVEA reported vehicle production of about 2.6 million units in 2025, up 3.5%, with vehicle exports rising 32.1%. For materials suppliers, the export increase matters because local component production can support repeat orders. Whether it creates diacid sales depends on where the relevant polymer, coating, or ester is made.
The Brazilian market is forecast to reach USD 22.0 million in 2036, compared with USD 11.1 million in 2026. FMI's 7.1% CAGR from 2026 to 2036 is close to the global value-growth rate. Brazil retains a 2.0% revenue share at the end of the forecast period.
Its commercial opportunity spans industrial formulation as well as selected polymer applications. Lubricants and greases constitute a separate outlet in this assessment. However, finished lubricant production should not be translated directly into diacid consumption because only appropriate ester and additive routes require the relevant molecule. An acid seller needs to establish the customer's chemistry and the scale of its local conversion before committing to a supply program.
FMI expects delivery economics to be particularly important for smaller specialty accounts. A shipment that is economical for a large polymer producer may leave a formulator holding too much stock. Suppliers and distributors can address this through suitable lot sizes and planned replenishment, provided the grade remains consistent. Brazil's forecast therefore favors commercially disciplined account development, combining new industrial programs with practical supply arrangements for existing users.
South Korea
South Korean demand is exposed to the requirements of export-oriented component production. The trade ministry reported automobile exports of USD 6.7 billion in June 2026, with growth in shipments to North America and the European Union. That geographic spread gives suppliers a reason to maintain consistent material performance across customer programs.
FMI forecasts South Korean acid revenue of USD 42.0 million in 2036, compared with USD 22.3 million in 2026. The 6.6% CAGR over 2026 to 2036 is slightly below the global value-growth rate. The country's share stays close to its starting allocation, easing from 4.0% to 3.8%.
The useful commercial question is which thermal-management, tubing, or technical-part programs use a diacid-containing polyamide. The expanded Asian polymer offer includes automotive tubing among its applications. A Korean customer evaluating that class of material may purchase finished polymer instead of acid. A merchant monomer seller therefore needs to locate the polymerization step and its purchasing authority before treating the component opportunity as an addressable acid account.
FMI expects accepted alternative sources to have value when they protect continuity across export schedules. However, an additional origin also creates work in technical comparison and incoming-quality control. The supplier must show a reason for that work, such as a specific grade capability or dependable supply terms. Korea's prospects favor a targeted approach to polymer manufacturers and relevant formulators, with no assumption that general electric-vehicle expansion automatically benefits every long-chain acid.
United States
For US buyers, an imported acid becomes commercially useful only when its technical and regulatory position is clear. EPA requires chemical importers to certify compliance with TSCA or the applicable exclusion, with documentation filed through the relevant customs process. This places responsibility on the importing business as well as the overseas seller. A low quotation cannot compensate for an unresolved import route when the customer has a production campaign scheduled.
FMI forecasts a 6.1% CAGR for US revenue from 2026 to 2036. Sales increase from USD 77.9 million to USD 140.2 million. The country remains a large destination, although its 2036 share of 12.8% is lower than the 2026 allocation of 14.0%. This indicates expansion at a more measured pace than in the fastest-growing markets.
The commercial case is application-led. An established polyamide producer needs reproducible monomer quality, while a coating or ester formulator may evaluate a different acid specification and order pattern. Suppliers serving these accounts should avoid presenting one broad grade as suitable for every conversion route. They need to agree the intended chemistry before discussing replacement of an incumbent source.
FMI expects supply arrangements that combine compliant import documentation with dependable replenishment to remain attractive. Local stock can shorten the customer's exposure to an international shipment, but it also ties up capital in a material whose grade is specific to its users. The sales opportunity lies in selecting the right accounts and inventory commitments, not simply in placing more acid in a warehouse.
Germany
Germany's specialty-polymer opportunity sits within a mature automotive production base. VDA reports domestic passenger-car output of about 4.1 million vehicles in 2025, a 2.0% increase over the preceding year. This is relevant industrial context for materials used in technical parts.
The German market is projected to expand from USD 44.5 million in 2026 to USD 76.4 million in 2036. FMI's forecast CAGR stands at 5.6% over 2026 to 2036. Its share declines to 7.0% by the end of the period, reflecting faster growth elsewhere instead of an absolute fall in German revenue.
The PA612 offering demonstrates a concrete downstream route in automotive technical components and hybrid material structures. For monomer suppliers, the value of such an application comes from repeat resin production after the component has been qualified. A new acid source must fit that established route without changing the approved material result. This creates a barrier to a purely price-led substitution.
FMI expects German purchasers to weigh supply continuity against the expense of changing a validated formulation. European chemical registration also makes substance coverage part of the commercial discussion. These conditions favor a supplier able to explain the product's identity and delivery arrangements clearly. The growth opportunity is more likely to come from winning a new grade or an additional approved source than from replacing every incumbent through a single price reduction.
Japan
Japan has a documented domestic DDA supplier. UBE identifies itself as the sole Japanese manufacturer of the material and lists uses across resins, powder-paint curing, fragrance synthesis, and metalworking-fluid protection. This breadth distinguishes the national opportunity from a market dependent on a single imported polymer feedstock. It gives buyers several possible demand cycles within the same acid family.
FMI expects Japan's revenue to reach USD 72.9 million in 2036 from USD 44.5 million in 2026. The 5.1% CAGR applies to the 2026 to 2036 period. Japan and Germany have the same 2026 revenue allocation, but the German forecast grows somewhat faster. The Japanese share is projected at 6.7% in 2036.
The commercial issue is how an acid grade fits a customer's established process. A resin intermediate and a fragrance precursor need not be sold with the same specification priorities. An exporter approaching the country should define the intended use and the benchmark grade before assuming that a lower-cost offer can replace domestic material. Otherwise the qualification burden may outweigh the saving on a modest order.
FMI sees a continuing opening for both dependable core grades and narrowly differentiated products. The former serve repeat production, while the latter need a clear technical reason for the buyer to change. Regional competitors can offer an alternative origin, but an additional source earns value only if the customer accepts its finished conversion result. Japan's forecast therefore rests on gradual extension of qualified applications instead of a sudden broad change in buying behavior.
France
France gives the fragrance side of the market particular commercial relevance. FEBEA's annual review reports perfume exports of EUR 8.0 billion in 2025, up 1.9%. It nevertheless identifies an active downstream business in which a specialized acid-derived ingredient can earn a position independent of engineering-plastic output.
The French long-chain dicarboxylic acid market is forecast at USD 27.3 million in 2036, against USD 16.7 million in 2026. FMI projects a 5.1% CAGR from 2026 to 2036. France's share consequently eases from 3.0% to 2.5% as larger Asian markets expand faster. France grows at 5.1% a year, 1.9 points slower than the global rate. In the Long-Chain dicarboxylic acid market, France is joint seventh among the ten on 2026 revenue.
The opportunity in fragrance chemistry differs from bulk polymer supply. A synthesis route can depend on a particular chain length and an impurity profile that matters to the final ingredient. A producer should therefore avoid assuming that polymer-grade material is automatically suitable for a fragrance customer. The two channels involve different development effort and order sizes.
FMI expects France's value to come from a mix of established resin applications and specialized formulation demand. Suppliers seeking additional accounts need to identify the actual converting business and its product requirements. The commercial opportunity is strongest when a seller can connect its grade to a confirmed synthesis or resin route and provide continuity through that customer's production schedule.
Italy
Italy's chemical customers enter the forecast period after a weak production year. Federchimica's 2025 to 2026 industry review reports Italian chemical output down 3.2% in 2025 and describes continued pressure on the sector This limits the case for indiscriminate growth in material purchases. An acid supplier needs to establish where a particular coating, resin, adhesive, or ester formulation is gaining business despite that broader weakness.
FMI expects the Italian market to expand at a 5.1% CAGR between 2026 and 2036. Revenue rises from USD 16.7 million to USD 27.3 million. The forecast matches France's starting and ending revenue, but the commercial reasoning is different. Italy's opportunity is assessed through industrial formulation and conversion instead of the scale of finished fragrance exports.
For a formulator, changing a curing agent or resin intermediate affects more than its purchase price. The change must fit the chosen application and the customer's process. UBE's documented use of DDA in acrylic powder-paint curing shows one relevant route. Suppliers should identify the actual formulation before describing the addressable account.
FMI's view is that measured purchasing and selective grade development will coexist. Buyers under margin pressure have an incentive to compare sources, but they also have less capacity to absorb failed qualification work. A seller that supplies the agreed grade reliably and supports a specific conversion issue has a more credible offer than one relying on a general claim of greener chemistry. Recovering industrial confidence would help volumes, while formulation wins remain the more direct route to new sales.
United Kingdom
The United Kingdom's automotive supply chain illustrates why material demand needs a cautious reading. SMMT reported total vehicle production of about 764.7 thousand units in 2025, down 15.5%. Electrified vehicles nevertheless represented a record 41.7% of car output. The combination means that a changing product mix can support selected technical materials while overall factory volume remains weak.
FMI projects UK revenue of USD 18.2 million by 2036 from USD 11.1 million in 2026. The 5.1% CAGR over 2026 to 2036 leaves the country a relatively small national market. Its share moves from 2.0% to 1.7% during the period. The United Kingdom contributes USD 7.1 million of new revenue, last of ten.
For suppliers, the first issue is locating the material decision within an international component program. A UK assembly plant may receive a finished polymer part whose resin and monomer were purchased elsewhere. The national opportunity instead includes relevant domestic conversion and formulation purchases.
FMI expects customers working on a new component or specialty formulation to examine alternative grades selectively. Where the incumbent process is already accepted, changing acid origin creates testing work and scheduling risk. That favors a clear commercial proposal with an identified application and a realistic launch timetable. Suppliers can still gain business during a weak production cycle if their material enters an approved new program, but they should base stock commitments on confirmed orders instead of anticipated vehicle recovery alone.
Who are the notable companies in the Long-Chain Dicarboxylic Acid Market?
Notable companies in the Long-Chain Dicarboxylic Acid Market include Cathay Biotech, UBE Corporation and Evonik Industries.
The three companies occupy different positions in the value chain. Cathay Biotech offers a range of long-chain acids and operates biological production technology. UBE Corporation markets DDA for resin, coating, and fragrance routes. Evonik Industries supplies high-performance polyamides, including PA612, and its technical literature documents DC12-containing PA1012 chemistry. Treating these businesses as identical merchant-acid sellers would obscure the actual competitive decision.
For Cathay and UBE, competition includes acceptance of an acid grade and continuity of deliveries into a customer's process. Evonik's role is also relevant because polymer developers influence which monomers and material properties are selected. A successful downstream polymer can support acid demand, while an alternative chemistry can redirect it. The commercial boundary therefore needs to remain visible in both company comparison and market sizing.
FMI expects collaboration between monomer manufacturers and conversion specialists to remain important. A broader product catalog helps a supplier enter development discussions, but the repeat order attaches to a specific accepted grade. This assessment does not assign numerical market shares to the companies or count their entire polymer businesses as diacid revenue.
Key Developments in the Long-Chain Dicarboxylic Acid Market
- In its annual report issued in April 2026, Cathay described progress during 2025 in modified bio-based polyamide and composite projects. Some production lines were partly built and related composite and battery-case lines had entered equipment commissioning. The reported status supports a development opportunity without treating all projects as established acid demand.
Key Players in the Long-Chain Dicarboxylic Acid Market
- Cathay Biotech
- UBE Corporation
- Evonik Industries
Long-Chain Dicarboxylic Acid Market Report Scope
Table 6: Long-Chain Dicarboxylic Acid Market Report Scope
| Coverage field | Report scope |
|---|---|
| Market definition | C10 to C18 long-chain dicarboxylic acids, including dodecanedioic acid and related grades |
| Revenue boundary | Acid intermediate sales within the defined market, excluding the full value of downstream polymers, coatings, lubricants, and perfumes |
| Quantitative Units | USD million |
| Carbon-chain coverage | DC12 dodecanedioic acid. DC10 sebacic acid and DC13 to DC14. DC15 to DC18 |
| Application coverage | Nylon and polyamide. Coatings and powder coatings. Lubricants and greases. Fragrances and adhesives. Other |
| Production Route coverage | Fermentation-Based, Chemical Synthesis. |
| Named countries | China, United States, Germany, Japan, India, South Korea, France, Italy, United Kingdom, and Brazil |
| Additional geography | Rest-of-world aggregate |
| Companies discussed | Cathay Biotech, UBE Corporation, and Evonik Industries, with their value-chain roles distinguished |
Source: Future Market Insights analysis of the Long-Chain dicarboxylic acid market, 2026.
Long-Chain Dicarboxylic Acid Market Research Methodology
This assessment combines FMI's value and volume outlook with secondary review of original product documents, corporate disclosures, regulatory guidance, and national industry statistics. Segment and country comparisons retain the defined acid boundary. Company sales, polymer capacity, and finished-product exports serve different analytical purposes and are not added together. The commercial conclusions identify the connection between acid specifications and downstream conversion while preserving the reported status of individual investments.
Long-Chain Dicarboxylic Acid Market by Segments
Long-Chain Dicarboxylic Acid Market segmented by Carbon Chain:
- DC12 dodecanedioic acid
- DC10 sebacic acid and DC13 to DC14
- DC15 to DC18
Long-Chain Dicarboxylic Acid Market segmented by Application:
- Nylon and polyamide
- Coatings and powder coatings
- Lubricants and greases
- Fragrances and adhesives
- Other
Long-Chain Dicarboxylic Acid Market segmented by Production Route:
- Fermentation-Based
- Chemical Synthesis
Long-Chain Dicarboxylic Acid Market by Region
- North America
- United States
- Western Europe
- Germany
- France
- Italy
- United Kingdom
- East Asia
- China
- Japan
- South Korea
- South Asia
- India
- Latin America
- Brazil
- Additional geographic aggregate
- Rest of world
Research Sources and Bibliography
- Associacao Nacional dos Fabricantes de Veiculos Automotores. (2026, January 15). Producao e venda de autoveiculos crescem em 2025 e Anfavea projeta nova alta em 2026.
- Cathay Biotech Inc. (n.d.). DC12 product specifications. Accessed November 9, 2026.
- Cathay Biotech Inc. (n.d.). LCDAs product line. Company website. Accessed 9 November 2026.
- Cathay Biotech Inc. (2026, April 24). 2025 Annual Report. Corporate disclosure, including production and sales table and project discussion.
- Evonik Industries. (n.d.). VESTAMID: Product range and typical applications. Accessed November 9, 2026. https://www.evonik.com/en/company/businesslines/hp/polyamides/vestamid.html
- Evonik Industries. (n.d.). VESTAMID Terra: Technical biobased polyamides. Technical brochure. Accessed November 9, 2026. https://products.evonik.com/assets/33/09/VESTAMID_Terra_Biobased_polyamides_EN_EN_243309.pdf
- Evonik Industries. (2025, November 3). Evonik expands polyamides production in China, doubling capacity for Long-Chain Polyamides. https://www.evonik.com/en/news/press-releases/2025/11/evonik-expands-polyamides-production-in-china-doubling-capacity-for-long-chain-polyamides.html
- Evonik Resource Efficiency. (2017, September). Technical Information: Processing of VESTAMID L, D, E and Terra. https://products.evonik.com/assets/32/28/VESTAMID_Processing_EN_EN_243228.pdf
- European Union, Your Europe. (n.d.). Registering chemicals under REACH. Accessed November 9, 2026. https://europa.eu/youreurope/business/product-rules-compliance/chemicals-and-hazardous-substances/registering-chemicals-reach/indexamp_en.htm
- Federation des Entreprises de la Beaute. (2026, April). Annual Report 2025: French exports in 2025. https://www.febea.fr/sites/default/files/2026-04/FEBEA_RA25_WEB.pdf
- Federchimica. (2026). L'industria chimica in Italia: Rapporto 2025-2026, Lo scenario economico. Accessed November 9, 2026. https://www.federchimica.it/l-industria-chimica-in-italia---rapporto-2025-2026/lo-scenario-economico
- Republic of Korea, Ministry of Trade, Industry and Resources. (2026, July 16). Automobile Exports Reach USD 6.71 Billion in June 2026. https://english.motir.go.kr/eng/article/EATCLdfa319ada/2690/view
- Society of Indian Automobile Manufacturers. (2026, September 3). SIAM Annual Report 2025-2026. Annual-report summary and industry performance. https://www.siam.in/knowledge/annual-reports
- Society of Motor Manufacturers and Traders. (2026, January). Tough year for Auto but new models and Industrial Strategy can deliver growth. https://www.smmt.co.uk/tough-year-for-auto-but-new-models-and-industrial-strategy-can-deliver-growth/
- UBE Corporation. (n.d.). 1,12-Dodecanedioic acid (DDA). Accessed November 9, 2026. https://www.ube.com/ube/en/contents/chemical/fine/dda.html
- United States Environmental Protection Agency. (n.d.). TSCA Requirements for Importing Chemicals. Accessed November 9, 2026. https://www.epa.gov/tsca-import-export-requirements/tsca-requirements-importing-chemicals
- Verband der Automobilindustrie. (2026, January 5). Passenger car production in 2025 slightly above previous year's level. https://www.vda.de/en/press/press-releases/2026/260106_Passenger-car-production-in-2025-slightly-above-previous-year-s-level
This bibliography is provided for reader reference and is not exhaustive. The full report contains the complete reference list and detailed citations.
Table of Content
- Key Takeaways
- Market Size and CAGR
- Top Growth Driver
- Fastest Growing Segment
- Leading Region
- Key Companies
- Emerging Opportunities
- Executive Summary
- Global Market Outlook
- Demand-side Trends
- Supply-side Trends
- Technology Roadmap Analysis
- Analysis and Recommendations
- Analyst Perspective (What is happening? Why now? What should investors know?)
- Key Questions Answered
- How large is the market?
- What is the CAGR?
- What are key trends?
- Which region dominates?
- Who are the leaders?
Read More...
- Market Overview
- Market Coverage / Taxonomy
- Market Definition / Scope / Limitations
- Research Methodology
- Chapter Orientation
- Analytical Lens and Working Hypotheses
- Market Structure, Signals, and Trend Drivers
- Benchmarking and Cross-market Comparability
- Market Sizing, Forecasting, and Opportunity Mapping
- Research Design and Evidence Framework
- Desk Research Programme (Secondary Evidence)
- Expert Input and Fieldwork (Primary Evidence)
- Tooling, Models, and Reference Databases
- Data Engineering and Model Build
- Quality Assurance and Audit Trail
- Market Background
- Market Dynamics (Drivers, Restraints, Opportunity, Trends)
- Scenario Forecast (Optimistic, Likely, Conservative)
- Impact Analysis
- AI Impact
- Sustainability Impact
- Regulatory Impact
- Technology Impact
- Consumer / Buyer Analysis
- Purchase Drivers
- Adoption Barriers
- Buyer Journey
- Opportunity Map Analysis
- Product Life Cycle Analysis
- Supply Chain Analysis
- Investment Feasibility Matrix
- Value Chain Analysis
- PESTLE and Porter's Analysis
- Regulatory Landscape
- Regional Parent Market Outlook
- Production and Consumption Statistics
- Import and Export Statistics
- Global Market Analysis and Forecast, 2021 to 2036
- Historical Market Size Value (USD Million) Analysis, 2021 to 2025
- Current and Future Market Size Value (USD Million) Projections, 2026 to 2036
- Y-o-Y Growth Trend Analysis
- Absolute $ Opportunity Analysis
- Global Market Pricing Analysis, 2021 to 2036
- Global Market Analysis and Forecast, By Carbon Chain, 2021 to 2036
- Introduction / Key Findings
- Historical Market Size Value (USD Million) Analysis By Carbon Chain, 2021 to 2025
- Current and Future Market Size Value (USD Million) Analysis and Forecast By Carbon Chain, 2026 to 2036
- DC12 dodecanedioic acid
- DC10 sebacic acid and DC13 to DC14
- DC15 to DC18
- Y-o-Y Growth Trend Analysis By Carbon Chain, 2021 to 2025
- Absolute $ Opportunity Analysis By Carbon Chain, 2026 to 2036
- Global Market Analysis and Forecast, By Application, 2021 to 2036
- Introduction / Key Findings
- Historical Market Size Value (USD Million) Analysis By Application, 2021 to 2025
- Current and Future Market Size Value (USD Million) Analysis and Forecast By Application, 2026 to 2036
- Nylon and polyamide
- Coatings and powder coatings
- Lubricants and greases
- Fragrances and adhesives
- Other
- Y-o-Y Growth Trend Analysis By Application, 2021 to 2025
- Absolute $ Opportunity Analysis By Application, 2026 to 2036
- Global Market Analysis and Forecast, By Production Route, 2021 to 2036
- Introduction / Key Findings
- Historical Market Size Value (USD Million) Analysis By Production Route, 2021 to 2025
- Current and Future Market Size Value (USD Million) Analysis and Forecast By Production Route, 2026 to 2036
- Fermentation-Based
- Chemical Synthesis
- Y-o-Y Growth Trend Analysis By Production Route, 2021 to 2025
- Absolute $ Opportunity Analysis By Production Route, 2026 to 2036
- Global Market Analysis and Forecast, By Region, 2021 to 2036
- Introduction
- Historical Market Size Value (USD Million) Analysis By Region, 2021 to 2025
- Current Market Size Value (USD Million) Analysis and Forecast By Region, 2026 to 2036
- North America
- Western Europe
- East Asia
- South Asia
- Latin America
- Market Attractiveness Analysis By Region
- North America Market Analysis and Forecast, By Country, 2021 to 2036
- Historical Market Size Value (USD Million) Trend Analysis By Market Taxonomy, 2021 to 2025
- Market Size Value (USD Million) Forecast By Market Taxonomy, 2026 to 2036
- By Country
- United States
- By Carbon Chain
- By Application
- By Production Route
- By Country
- Market Attractiveness Analysis
- By Country
- By Carbon Chain
- By Application
- By Production Route
- Key Takeaways
- Western Europe Market Analysis and Forecast, By Country
- Historical Market Size Value (USD Million) Trend Analysis By Market Taxonomy, 2021 to 2025
- Market Size Value (USD Million) Forecast By Market Taxonomy, 2026 to 2036
- By Country
- Germany
- France
- Italy
- United Kingdom
- By Carbon Chain
- By Application
- By Production Route
- By Country
- Market Attractiveness Analysis
- By Country
- By Carbon Chain
- By Application
- By Production Route
- Key Takeaways
- East Asia Market Analysis and Forecast, By Country
- Historical Market Size Value (USD Million) Trend Analysis By Market Taxonomy, 2021 to 2025
- Market Size Value (USD Million) Forecast By Market Taxonomy, 2026 to 2036
- By Country
- China
- Japan
- South Korea
- By Carbon Chain
- By Application
- By Production Route
- By Country
- Market Attractiveness Analysis
- By Country
- By Carbon Chain
- By Application
- By Production Route
- Key Takeaways
- South Asia Market Analysis and Forecast, By Country
- Historical Market Size Value (USD Million) Trend Analysis By Market Taxonomy, 2021 to 2025
- Market Size Value (USD Million) Forecast By Market Taxonomy, 2026 to 2036
- By Country
- India
- By Carbon Chain
- By Application
- By Production Route
- By Country
- Market Attractiveness Analysis
- By Country
- By Carbon Chain
- By Application
- By Production Route
- Key Takeaways
- Latin America Market Analysis and Forecast, By Country
- Historical Market Size Value (USD Million) Trend Analysis By Market Taxonomy, 2021 to 2025
- Market Size Value (USD Million) Forecast By Market Taxonomy, 2026 to 2036
- By Country
- Brazil
- Additional geographic aggregate
- Rest of world
- By Carbon Chain
- By Application
- By Production Route
- By Country
- Market Attractiveness Analysis
- By Country
- By Carbon Chain
- By Application
- By Production Route
- Key Takeaways
- Key Countries Market Analysis
- United States
- Pricing Analysis
- Market Share Analysis, 2025
- By Carbon Chain
- By Application
- By Production Route
- Brazil
- Pricing Analysis
- Market Share Analysis, 2025
- By Carbon Chain
- By Application
- By Production Route
- Germany
- Pricing Analysis
- Market Share Analysis, 2025
- By Carbon Chain
- By Application
- By Production Route
- United Kingdom
- Pricing Analysis
- Market Share Analysis, 2025
- By Carbon Chain
- By Application
- By Production Route
- Italy
- Pricing Analysis
- Market Share Analysis, 2025
- By Carbon Chain
- By Application
- By Production Route
- France
- Pricing Analysis
- Market Share Analysis, 2025
- By Carbon Chain
- By Application
- By Production Route
- India
- Pricing Analysis
- Market Share Analysis, 2025
- By Carbon Chain
- By Application
- By Production Route
- China
- Pricing Analysis
- Market Share Analysis, 2025
- By Carbon Chain
- By Application
- By Production Route
- Japan
- Pricing Analysis
- Market Share Analysis, 2025
- By Carbon Chain
- By Application
- By Production Route
- South Korea
- Pricing Analysis
- Market Share Analysis, 2025
- By Carbon Chain
- By Application
- By Production Route
- United States
- Market Structure Analysis
- Competition Dashboard
- Competition Benchmarking
- Market Share Analysis of Top Players
- By Regional
- By Carbon Chain
- By Application
- By Production Route
- Emerging Startups
- Innovation Benchmarking
- Competition Analysis
- Competition Deep Dive
- Cathay Biotech
- Overview
- Product Portfolio
- Profitability by Market Segments
- Sales Footprint
- Strategy Overview
- Marketing Strategy
- Product Strategy
- Channel Strategy
- UBE Corporation
- Evonik Industries
- Cathay Biotech
- Case Studies
- Success Stories
- Recent Developments
- Competition Deep Dive
- Assumptions & Acronyms Used
List of Tables
- Table 1: Global Market Value (USD Million) Forecast by Region, 2021 to 2036
- Table 2: Global Market Value (USD Million) Forecast by Carbon Chain, 2021 to 2036
- Table 3: Global Market Value (USD Million) Forecast by Application, 2021 to 2036
- Table 4: Global Market Value (USD Million) Forecast by Production Route, 2021 to 2036
- Table 5: North America Market Value (USD Million) Forecast by Country, 2021 to 2036
- Table 6: North America Market Value (USD Million) Forecast by Carbon Chain, 2021 to 2036
- Table 7: North America Market Value (USD Million) Forecast by Application, 2021 to 2036
- Table 8: North America Market Value (USD Million) Forecast by Production Route, 2021 to 2036
- Table 9: Western Europe Market Value (USD Million) Forecast by Country, 2021 to 2036
- Table 10: Western Europe Market Value (USD Million) Forecast by Carbon Chain, 2021 to 2036
- Table 11: Western Europe Market Value (USD Million) Forecast by Application, 2021 to 2036
- Table 12: Western Europe Market Value (USD Million) Forecast by Production Route, 2021 to 2036
- Table 13: East Asia Market Value (USD Million) Forecast by Country, 2021 to 2036
- Table 14: East Asia Market Value (USD Million) Forecast by Carbon Chain, 2021 to 2036
- Table 15: East Asia Market Value (USD Million) Forecast by Application, 2021 to 2036
- Table 16: East Asia Market Value (USD Million) Forecast by Production Route, 2021 to 2036
- Table 17: South Asia Market Value (USD Million) Forecast by Country, 2021 to 2036
- Table 18: South Asia Market Value (USD Million) Forecast by Carbon Chain, 2021 to 2036
- Table 19: South Asia Market Value (USD Million) Forecast by Application, 2021 to 2036
- Table 20: South Asia Market Value (USD Million) Forecast by Production Route, 2021 to 2036
- Table 21: Latin America Market Value (USD Million) Forecast by Country, 2021 to 2036
- Table 22: Latin America Market Value (USD Million) Forecast by Carbon Chain, 2021 to 2036
- Table 23: Latin America Market Value (USD Million) Forecast by Application, 2021 to 2036
- Table 24: Latin America Market Value (USD Million) Forecast by Production Route, 2021 to 2036
List of Figures
- Figure 1: Global Market Pricing Analysis
- Figure 2: Global Market Value (USD Million) Forecast 2021-2036
- Figure 3: Global Market Value Share and BPS Analysis by Carbon Chain, 2026 and 2036
- Figure 4: Global Market Y-o-Y Growth Comparison by Carbon Chain, 2026-2036
- Figure 5: Global Market Attractiveness Analysis by Carbon Chain
- Figure 6: Global Market Value Share and BPS Analysis by Application, 2026 and 2036
- Figure 7: Global Market Y-o-Y Growth Comparison by Application, 2026-2036
- Figure 8: Global Market Attractiveness Analysis by Application
- Figure 9: Global Market Value Share and BPS Analysis by Production Route, 2026 and 2036
- Figure 10: Global Market Y-o-Y Growth Comparison by Production Route, 2026-2036
- Figure 11: Global Market Attractiveness Analysis by Production Route
- Figure 12: Global Market Value (USD Million) Share and BPS Analysis by Region, 2026 and 2036
- Figure 13: Global Market Y-o-Y Growth Comparison by Region, 2026-2036
- Figure 14: Global Market Attractiveness Analysis by Region
- Figure 15: North America Market Incremental Dollar Opportunity, 2026-2036
- Figure 16: Western Europe Market Incremental Dollar Opportunity, 2026-2036
- Figure 17: East Asia Market Incremental Dollar Opportunity, 2026-2036
- Figure 18: South Asia Market Incremental Dollar Opportunity, 2026-2036
- Figure 19: Latin America Market Incremental Dollar Opportunity, 2026-2036
- Figure 20: North America Market Value Share and BPS Analysis by Country, 2026 and 2036
- Figure 21: North America Market Value Share and BPS Analysis by Carbon Chain, 2026 and 2036
- Figure 22: North America Market Y-o-Y Growth Comparison by Carbon Chain, 2026-2036
- Figure 23: North America Market Attractiveness Analysis by Carbon Chain
- Figure 24: North America Market Value Share and BPS Analysis by Application, 2026 and 2036
- Figure 25: North America Market Y-o-Y Growth Comparison by Application, 2026-2036
- Figure 26: North America Market Attractiveness Analysis by Application
- Figure 27: North America Market Value Share and BPS Analysis by Production Route, 2026 and 2036
- Figure 28: North America Market Y-o-Y Growth Comparison by Production Route, 2026-2036
- Figure 29: North America Market Attractiveness Analysis by Production Route
- Figure 30: Western Europe Market Value Share and BPS Analysis by Country, 2026 and 2036
- Figure 31: Western Europe Market Value Share and BPS Analysis by Carbon Chain, 2026 and 2036
- Figure 32: Western Europe Market Y-o-Y Growth Comparison by Carbon Chain, 2026-2036
- Figure 33: Western Europe Market Attractiveness Analysis by Carbon Chain
- Figure 34: Western Europe Market Value Share and BPS Analysis by Application, 2026 and 2036
- Figure 35: Western Europe Market Y-o-Y Growth Comparison by Application, 2026-2036
- Figure 36: Western Europe Market Attractiveness Analysis by Application
- Figure 37: Western Europe Market Value Share and BPS Analysis by Production Route, 2026 and 2036
- Figure 38: Western Europe Market Y-o-Y Growth Comparison by Production Route, 2026-2036
- Figure 39: Western Europe Market Attractiveness Analysis by Production Route
- Figure 40: East Asia Market Value Share and BPS Analysis by Country, 2026 and 2036
- Figure 41: East Asia Market Value Share and BPS Analysis by Carbon Chain, 2026 and 2036
- Figure 42: East Asia Market Y-o-Y Growth Comparison by Carbon Chain, 2026-2036
- Figure 43: East Asia Market Attractiveness Analysis by Carbon Chain
- Figure 44: East Asia Market Value Share and BPS Analysis by Application, 2026 and 2036
- Figure 45: East Asia Market Y-o-Y Growth Comparison by Application, 2026-2036
- Figure 46: East Asia Market Attractiveness Analysis by Application
- Figure 47: East Asia Market Value Share and BPS Analysis by Production Route, 2026 and 2036
- Figure 48: East Asia Market Y-o-Y Growth Comparison by Production Route, 2026-2036
- Figure 49: East Asia Market Attractiveness Analysis by Production Route
- Figure 50: South Asia Market Value Share and BPS Analysis by Country, 2026 and 2036
- Figure 51: South Asia Market Value Share and BPS Analysis by Carbon Chain, 2026 and 2036
- Figure 52: South Asia Market Y-o-Y Growth Comparison by Carbon Chain, 2026-2036
- Figure 53: South Asia Market Attractiveness Analysis by Carbon Chain
- Figure 54: South Asia Market Value Share and BPS Analysis by Application, 2026 and 2036
- Figure 55: South Asia Market Y-o-Y Growth Comparison by Application, 2026-2036
- Figure 56: South Asia Market Attractiveness Analysis by Application
- Figure 57: South Asia Market Value Share and BPS Analysis by Production Route, 2026 and 2036
- Figure 58: South Asia Market Y-o-Y Growth Comparison by Production Route, 2026-2036
- Figure 59: South Asia Market Attractiveness Analysis by Production Route
- Figure 60: Latin America Market Value Share and BPS Analysis by Country, 2026 and 2036
- Figure 61: Latin America Market Value Share and BPS Analysis by Carbon Chain, 2026 and 2036
- Figure 62: Latin America Market Y-o-Y Growth Comparison by Carbon Chain, 2026-2036
- Figure 63: Latin America Market Attractiveness Analysis by Carbon Chain
- Figure 64: Latin America Market Value Share and BPS Analysis by Application, 2026 and 2036
- Figure 65: Latin America Market Y-o-Y Growth Comparison by Application, 2026-2036
- Figure 66: Latin America Market Attractiveness Analysis by Application
- Figure 67: Latin America Market Value Share and BPS Analysis by Production Route, 2026 and 2036
- Figure 68: Latin America Market Y-o-Y Growth Comparison by Production Route, 2026-2036
- Figure 69: Latin America Market Attractiveness Analysis by Production Route
- Figure 70: Global Market - Tier Structure Analysis
- Figure 71: Global Market - Company Share Analysis
Frequently Asked Questions
How big is the Long-Chain dicarboxylic acid market in 2026?
FMI estimates the market at USD 556.4 million in 2026, up from USD 520.0 million in 2025. It is forecast to reach USD 1,094.5 million by 2036 at a 7.0% CAGR.
Which carbon chain leads the Long-Chain dicarboxylic acid market in 2026?
DC12 dodecanedioic acid leads by carbon chain with 62.0% in 2026. All other segments together hold 38.0%.
Which application and production route lead in 2026?
Nylon and polyamide holds 48.0% by application and Fermentation-Based holds 60.0% by production route in FMI's 2026 assessment.
Which market is forecast to grow fastest through 2036?
India has the highest forecast CAGR at 9.1% during 2026 to 2036, followed by China at 8.1%.
Does every long-chain polyamide expansion create demand for these diacids?
No. The monomer route depends on the resin chemistry. For example, Evonik documents DC12 in PA1012, while its portfolio also includes other polyamide families.[5][6] Polymer capacity must be assessed by grade before it is associated with merchant acid purchases.
Preview the report firsthand - request a free sample
Get SampleGet the brochure for pricing and purchase details.
Get PDF
