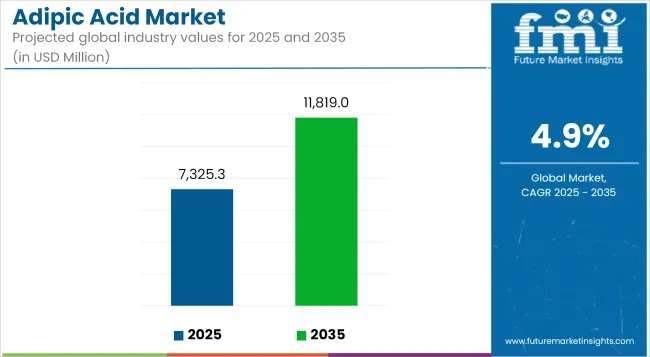
The global adipic acid market reached USD 6,983.1 million in 2024 and is expected to grow to USD 7,325.3 million in 2025. From 2025 to 2035, the market is projected to advance at a CAGR of 4.9%, reaching USD 11,819.0 million by the end of the forecast period. Growth is being supported by rising consumption in automotive, textile, and polyurethane manufacturing industries.

Adipic acid is being primarily utilized in the production of nylon 6,6, a high-strength polymer used extensively in automotive components, industrial applications, and durable textile products. Demand for lightweight and corrosion-resistant alternatives to metal parts in transportation is contributing to increased use of adipic acid-based compounds. In automotive design, parts made using nylon 6,6 are reducing overall vehicle weight and improving energy efficiency.
Polyurethanes, produced with adipic acid as a core input, are being applied in foam-based insulation, furniture cushioning, protective coatings, and footwear. These applications are being supported by growing demand for construction materials and flexible consumer goods with longer service life and design versatility.
In the electronics sector, the rapid expansion of smartphones, flat-screen displays, and compact devices is creating additional demand for high-performance polymer components. Adipic acid is being used as a chemical intermediate in specialty polymers that meet electrical insulation and durability requirements in electronic casings and structural assemblies.
Ongoing material innovation is enabling production of adipic acid from renewable feedstocks. Bio-based routes are being explored by manufacturers seeking to align production with lower environmental impact targets and reduced dependency on fossil resources. Investments are being made in fermentation and catalytic pathways that allow scale-up of greener adipic acid formulations.
Weight reduction in vehicles, growing use of engineered plastics, and steady development in textile durability standards are expected to maintain consistent demand across industries. The adipic acid market is projected to expand steadily through 2035 as its role in lightweight materials and chemical processing remains essential to industrial growth and material performance innovation.
The table below presents the annual growth rates of the global adipic acid market from 2025 to 2035. With a base of 2024 and extended to the current year 2025, the report studied how the industry growth trajectory moves from the first half of the year-that is, January to June, (H1)-to the second half comprising July to December, (H2).
This is an absolute comparison to offering the stakeholder's idea of how the sector has performed over time, with hints on developments that may emerge.
These figures indicate the growth of the sector in each half-year, between the years 2024 and 2025. The market is expected to grow at a CAGR of 4.4% in H1-2024. In H2, the growth rate increases.
| Particular | Value CAGR |
|---|---|
| H1 (2024 to 2034) | 4.4% |
| H2 (2024 to 2034) | 4.6% |
| H1 (2025 to 2035) | 4.8% |
| H2 (2025 to 2035) | 4.9% |
Moving into the subsequent period, from H1 2025 to H2 2025, the CAGR is projected to slightly decrease to 4.8% in the first half and relatively increase to 4.9% in the second half. In the first half (H1), the sector saw an increase of 40 BPS while in the second half (H2), there was a slight increase of 30 BPS.
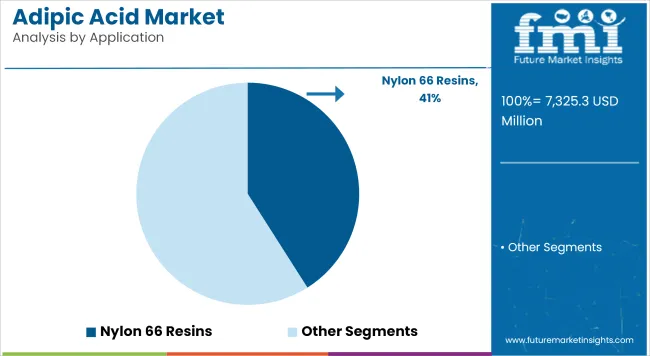
Nylon 66 resins are estimated to account for approximately 41% of the global adipic acid market share in 2025 and are projected to grow at a CAGR of 5.0% through 2035. Adipic acid is a key raw material used in the production of hexamethylenediamine, which is then polymerized to produce nylon 66.
This engineering thermoplastic is widely used in structural components for automotive parts, electrical connectors, industrial fasteners, and appliance housings. Its mechanical strength, thermal resistance, and dimensional stability make it suitable for high-load, high-temperature environments. As lightweighting initiatives gain momentum across industries, nylon 66 resins derived from adipic acid continue to replace metal parts and other heavier materials, especially in automotive and electrical applications.

| Segment | Value Share (2025) |
|---|---|
| Nylon 66 Fiber (Application) | 41% |
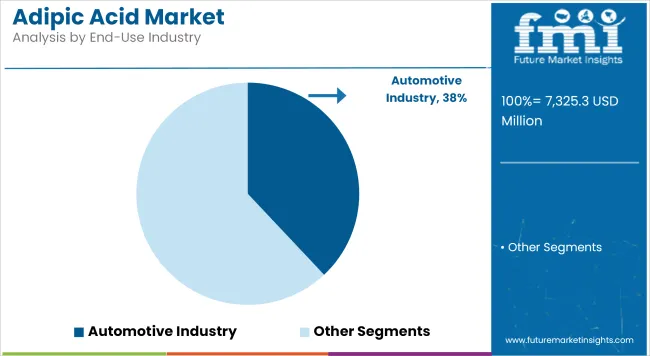
The automotive segment is projected to hold approximately 38% of the global adipic acid market share in 2025 and is expected to grow at a CAGR of 5.1% through 2035. Adipic acid-derived products, primarily nylon 66 and polyurethane foams, are used in manufacturing engine covers, air intake manifolds, cable ties, and seat cushioning.
The drive toward fuel efficiency, emission reduction, and electric vehicle component standardization is increasing the demand for lightweight, durable, and heat-resistant materials. In addition to performance, adipic acid derivatives are being optimized for recyclability and reduced environmental impact. OEMs and Tier 1 suppliers are also investing in bio-based adipic acid alternatives to meet sustainability mandates, further shaping the future growth trajectory of this market.

| Segment | Value Share (2025) |
|---|---|
| Automotive Industry (End-Use Industry) | 38% |
Growing Demand for Adipic Acid in Nylon 6,6 Production
Nylon 6,6, produced using adipic acid, is a key material in many industries, particularly textiles and automotive. In the textile sector, nylon 6,6 is used in clothing, carpets, and upholstery, offering durability and strength. The global textile market is projected to reach USD 1.23 trillion by 2025, driving up the demand for nylon fibers.
In the automotive industry, nylon 6,6 is used to make bumpers, engine components, interior parts, and more, thanks to its strength and resistance to heat. is expected to keep growing, especially with the rise of electric vehicles and the need for lightweight, durable materials. As these industries expand, especially in emerging markets, the demand for adipic acid, which is used to produce nylon 6,6, continues to rise.
With increasing use in textiles and automotive applications, adipic acid is becoming more essential to various industries around the world.
Rising Demand for Adipic Acid in Plastics and Plasticizers
Adipic acid is an important raw material in the production of plasticizers, special substances added to plastics to make them more flexible, durable, and processable. Most of the plasticizers based on adipic acid are used in the production of PVC, one of the most important plastics worldwide. It can be found in such applications as pipes, flooring, wires, and packaging.
Global demand for plastics continues to increase, especially for industries such as construction, packaging, and healthcare, which means the requirement for adipic acid is only going to keep on increasing. This makes the PVC market worth USD 1 trillion by 2025.
PVC is utilized in construction for pipes and window frames, and in healthcare for such needs as medical devices and IV bags. Since these industries will continue to expand, plasticizers-and hence adipic acid- will also see increased demand, placing it in the middle of a growing global plastic market.
Expanding Use of Adipic Acid in Polyurethanes
Adipic acid is an important raw material in the making of polyurethane foams used in a wide range of products, from furniture and mattresses to insulation and construction materials. Polyurethane foams are highly durable, comfortable, and thermally insulating, thus finding great applications in residential, commercial, and industrial settings.
The demand for thermal insulation material, like polyurethane foam, keeps on increasing with the greater demand for energy-efficient buildings on a worldwide scale. Besides that, the high demand for comfortable, durable mattresses, and furniture raises the demand for polyurethane-based products. Forecasts of the world mattress market to reach USD 50 billion by 2027 further prop the demand for adipic acid in foam.
The versatile material is also used in automotive parts and footwear. Because these industries will continue to grow, especially in emerging markets, demand for the adipic acid used to make these polyurethane products is expected to increase, hence supporting its key role in the manufacture of these essential items.
Competition from Alternative Materials in the Adipic Acid Market
Adipic acid faces significant competition from alternative chemicals and materials that may reduce its demand in various applications. One of the primary substitutes is bio-based plastics, which are gaining popularity due to their environmental benefits.
As industries increasingly focus on sustainability, bio-based polymers and plastics derived from renewable resources offer a greener alternative to conventional plastics made with adipic acid. This shift toward eco-friendly materials could decrease the need for traditional adipic acid-based products.
Polyamide 6 (nylon 6) is another competitor in the nylon production market. While nylon 6 (made from adipic acid) is widely used in textiles and automotive components, nylon 6 offers similar properties and is often produced using different raw materials, potentially reducing the reliance on adipic acid.
As these alternatives gain traction, particularly in eco-conscious markets, the adipic acid demand could be limited. Manufacturers may need to adapt by exploring more sustainable production methods and finding new ways to compete with these emerging materials.
Tier 1 companies include industry leaders with annual revenues exceeding USD 500-1000 million. These companies are currently capturing a significant share of 50-60% globally. These frontrunners are characterized by high production capacity and a wide product portfolio.
They are distinguished by extensive expertise in manufacturing and a broad geographical reach, underpinned by a robust consumer base. They provide a wide range of products to meet regulatory standards. Prominent companies within Tier 1 include: Asahi Kasei Corporation, Ascend Performance Materials, BASF SE, Invista, Lanxess Ag, and others.
Tier 2 companies encompass mid-sized participants with revenues ranging from USD 200-500 million, holding a presence in specific regions and exerting significant influence in local economies. These firms are distinguished by their robust presence overseas and in-depth industry expertise.
They possess strong technology capabilities and adhere strictly to regulatory requirements. However, while they may not always possess the latest cutting-edge technologies or maintain an extensive global reach. Noteworthy entities in Tier 2 include PetroChina Liaoyang Petrochemical, Radici Group, Rhodia
Tier 3 encompasses most of the small-scale enterprises operating within the regional sphere and catering to specialized needs with revenues below USD 50-200 million. These businesses are notably focused on meeting local demand and are hence categorized within the Tier 3 segment.
They are small-scale participants with limited geographical presence. In this context, Tier 3 is acknowledged as an informal sector, indicating a segment distinguished by a lack of extensive organization and formal structure in comparison to the structured one. Tier 3 Shandong Haili Chemical Industry Company Ltd., Shandong Hongye Chemical Company, Ltd., Solvay and others.
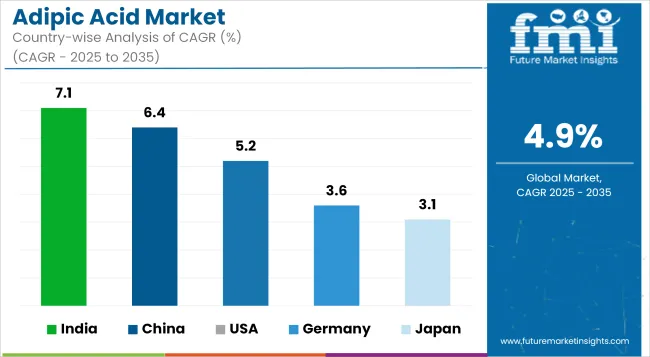
The section below covers assessments of adipic acid sales across key countries. Countries from East Asia, and Latin America, are anticipated to exhibit promising double-digit growth over the forecast period. All the below-listed countries are collectively set to reflect a CAGR of around 4.9% through the forecast period.

| Countries | Value CAGR (2025 to 2035) |
|---|---|
| India | 7.1% |
| China | 6.4% |
| USA | 5.2% |
| Germany | 3.6% |
| Japan | 3.1% |
China is the biggest producer of adipic acid and accounts for a considerable share of the global market. The country's huge industrial base in textiles and automotive manufacturing is the major reason for such high demand.
It is greatly used in the production of nylon 6,6, which has wide usage in textiles, automotive, and other industrial sectors. Due to ongoing expansion in the country's manufacturing sector, demand for adipic acid remains strong.
Also, China is at the forefront of bio-based adipic acid production as part of its push toward more sustainable practices. The country’s focus on green chemistry and eco-friendly production methods has made it a global leader in developing bio-based alternatives to traditional petrochemical-derived adipic acid.
China is also the largest consumer of adipic acid, fueled by its extensive manufacturing sectors in automotive, textiles, and construction. The rapid pace of industrialization and urbanization further accelerates the demand for adipic acid, as it is integral to a wide range of products, including polyurethanes and plastics.
The USA market is both a major consumer and producer of adipic acid, with demand mainly coming from industries such as automotive, textiles, and polyurethanes. The growing demand for lightweight automotive materials and durable textiles continues to drive the consumption of adipic acid.
In the automotive sector, it finds its application in the manufacture of nylon 6,6 used in strong, lightweight parts like bumpers, engine parts, and interior components. This demand is especially high with the emergence of electric vehicles, where lightweight materials are highly needed for energy efficiency.
The textile industry is also a consumer since adipic acid is utilized in the production of nylon fibers for clothing, carpets, and upholstery. Performance and durable textiles continue to be in demand, particularly for uses in high-end products.
Also, the polyurethane industry is another contributor to demand in the USA, where the production of polyurethane foams using adipic acid is done for furniture, mattresses, and insulation.
The USA is also a major producer of adipic acid, with large-scale production facilities concentrated in regions rich in petrochemical resources, supporting its key role in the global market.
Germany is a significant player in the global adipic acid market, both as a consumer and producer. As a major industrial hub, the country consumes large quantities of adipic acid, particularly for nylon production, polyurethanes, and plastics.
The demand is driven by the automotive and construction sectors, where adipic acid is used to produce nylon 6,6 for automotive parts and polyurethane foams for insulation and furniture. Germany’s advanced manufacturing industries rely heavily on adipic acid for the production of high-performance materials.
It also has considerable production capacities in Germany market with huge industries present within the textile, automobile, and chemical sectors. Germany is also noted for its development of even more environment-friendly ways of production, such as bio-based production of adipic acid.
Being at the helm of green chemistry, Germany continues to create developments in green processes for less environmental impact to cater to the increasing demand of adipic acid by various industries. A combination of high demand and innovation makes Germany the key player in the market for adipic acid.
Producers in the adipic acid market are responding to rising demand and pricing pressure by optimizing production processes and exploring alternative feedstocks. To meet the increasing needs from sectors like automotive and textiles, companies are scaling up their production capacities and improving efficiency. In response to raw material cost fluctuations, manufacturers are turning to renewable and bio-based feedstocks to reduce reliance on petroleum-derived inputs. These shifts help mitigate pricing volatility and ensure cost competitiveness. Many producers are also focusing on technological advancements to increase yield and minimize waste.
Industry Updates
In terms of Application, the industry is divided into Nylon 66 Fiber, Nylon 66 Resins, Polyurethanes, Plasticizers, Food and Beverage Additives, Adipate Esters, Others
In terms of the End-Use Industry, the industry is divided into Automotive Industry, Textile Industry, Construction & Building, Consumer Goods & Packaging, Food and Beverage Industry, and Others
Key countries of North America, Latin America, Western Europe, Eastern Europe, East Asia, South Asia, Middle East and Africa (MEA), have been covered in the report.
The global market was valued at USD 6,983.1 million in 2024.
The global market is set to reach USD 7,325.3 million in 2025.
Global demand is anticipated to rise at 4.9% CAGR.
The industry is projected to reach USD 11,819.0 million by 2035.
Asahi Kasei Corporation, Ascend Performance Materials, BASF SE, Invista, Lanxess Ag, PetroChina Liaoyang Petrochemical, Radici Group, Rhodia, Shandong Haili Chemical Industry Company Ltd., Shandong Hongye Chemical Company, Ltd., Solvay are prominent companies.


Full Research Suite comprises of:
Market outlook & trends analysis
Interviews & case studies
Strategic recommendations
Vendor profiles & capabilities analysis
5-year forecasts
8 regions and 60+ country-level data splits
Market segment data splits
12 months of continuous data updates
DELIVERED AS:
PDF EXCEL ONLINE
UK Adipic Acid Market Analysis – Demand, Growth & Forecast 2025-2035
USA Adipic Acid Market Analysis – Size & Industry Trends 2025-2035
Japan Adipic Acid Market Insights – Trends, Demand & Growth 2025-2035
India Adipic Acid Market Report – Trends, Demand & Industry Forecast 2025-2035
Germany Adipic Acid Market Trends – Size, Share & Industry Growth 2025-2035
Acid Resistant Pipe Market Forecast and Outlook 2025 to 2035
Acid Coil Cleaner Market Size and Share Forecast Outlook 2025 to 2035
Acid Filling and Leveling Machine Market Size and Share Forecast Outlook 2025 to 2035
Acid Chlorides Market Size and Share Forecast Outlook 2025 to 2035
Acid-Sensitive APIs Market Analysis - Size, Share, and Forecast Outlook 2025 to 2035
Acidified Whey Protein Market Analysis - Size, Share & Trends 2025 to 2035
Acid Dyes Market Growth - Trends & Forecast 2025 to 2035
Acidity Regulator Market Growth - Trends & Forecast 2025 to 2035
Acid Proof Lining Market Trends 2025 to 2035
Acid Citrate Dextrose Tube Market Trends – Growth & Industry Outlook 2024-2034
Acid Orange Market
Antacids Market Analysis – Size, Trends & Forecast 2025 to 2035
Lead Acid Battery Market Size and Share Forecast Outlook 2025 to 2035
Lead Acid Battery Recycling Market Size and Share Forecast Outlook 2025 to 2035
Feed Acidifier Market Analysis Size Share and Forecast Outlook 2025 to 2035

Thank you!
You will receive an email from our Business Development Manager. Please be sure to check your SPAM/JUNK folder too.
Chat With
MaRIA