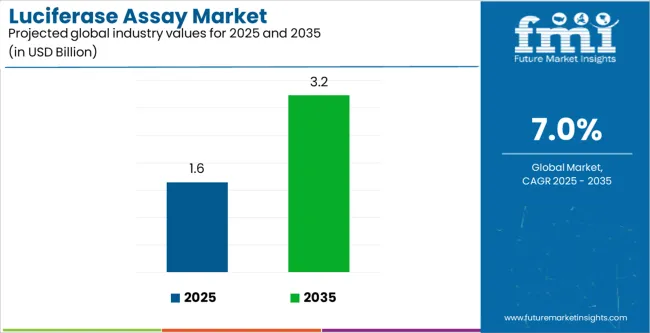
The luciferase assay market, valued at USD 1.6 billion in 2025 and projected to reach USD 3.2 billion by 2035 at a CAGR of 7.0%, is being shaped by several key dynamics that illustrate its growing relevance across life sciences and drug discovery. A primary driver is the expanding role of luciferase assays in gene expression analysis and molecular biology. These assays provide unmatched sensitivity, rapid results, and quantitative accuracy, making them indispensable for researchers investigating promoter activity, transcriptional regulation, and functional genomics. The growing reliance on these tools in both academic and industrial research underscores their strategic importance in modern biological studies.
Another critical factor influencing the market is the rising demand in drug discovery and development. Pharmaceutical and biotechnology companies increasingly depend on luciferase assays for high-throughput screening (HTS), enabling them to evaluate thousands of compounds quickly for efficacy, toxicity, and cellular response. With the global biopharmaceutical pipeline expanding, especially in oncology and rare diseases, the requirement for scalable and precise assay platforms is intensifying. Advancements in assay multiplexing are further amplifying their value, as researchers can now conduct simultaneous studies on multiple pathways, significantly improving throughput and productivity.
Automation and miniaturization represent another dynamic reshaping the landscape. As laboratory workflows become more complex, automated luciferase assay systems are being adopted to ensure reproducibility, reduce manual errors, and optimize resource use. Miniaturized assay formats not only lower reagent costs but also facilitate large-scale experiments, making them attractive for commercial laboratories and research institutes. This trend aligns with the broader movement toward cost-effective and sustainable lab operations, which is particularly relevant for institutions in emerging economies seeking advanced solutions within constrained budgets.
The market is also being propelled by the increasing integration of luciferase assays into personalized medicine and molecular diagnostics. With precision medicine initiatives gaining momentum, luciferase assays are playing a role in biomarker discovery, genetic testing, and post-translational modification analysis. Their adaptability to diverse biological targets enhances their appeal across a wide spectrum of therapeutic research areas, from infectious diseases to neurological disorders.
Geographic expansion adds another layer of opportunity. While North America and Europe dominate due to strong R&D infrastructure and funding, Asia-Pacific is emerging rapidly with significant investments in life sciences research, clinical trials, and biotech startups. The rising prevalence of academic and commercial research labs in China, India, and South Korea is creating a robust demand base, supported by government initiatives and international collaborations.
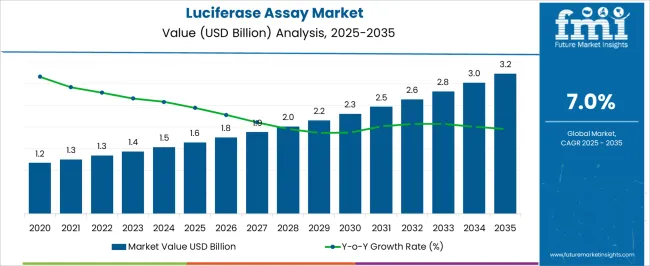
| Metric | Value |
|---|---|
| Luciferase Assay Market Estimated Value in (2025 E) | USD 1.6 billion |
| Luciferase Assay Market Forecast Value in (2035 F) | USD 3.2 billion |
| Forecast CAGR (2025 to 2035) | 7.0% |
The market is segmented by Product Type and Application and region. By Product Type, the market is divided into Luciferase Assays, Beta-Galactosidase Assays, Fluorescent Protein-Related Assays, and Chloramphenicol Acetyltransferase Assays. In terms of Application, the market is classified into Post-Translational Modification, Gene Expression, Protein-Protein Interaction, Metabolic Activity, and Others. Regionally, the market is classified into North America, Latin America, Western Europe, Eastern Europe, Balkan & Baltic Countries, Russia & Belarus, Central Asia, East Asia, South Asia & Pacific, and the Middle East & Africa.
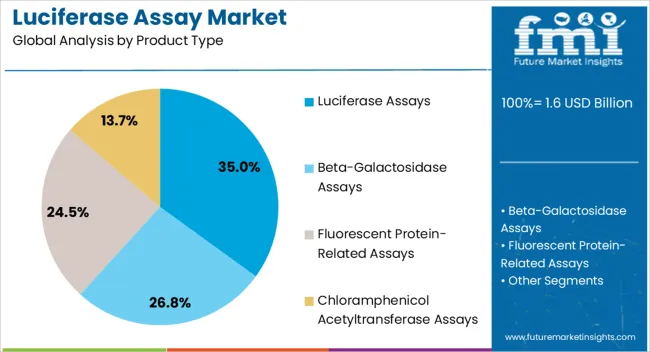
The luciferase assays product type is projected to hold 35.0% of the Luciferase Assay market revenue share in 2025, making it the leading product type. This dominance is attributed to the high sensitivity, reproducibility, and adaptability of luciferase assays for various research applications. Their ability to quantify gene expression and reporter activity accurately has made them a preferred choice for high-throughput screening and functional genomics studies.
The growing demand for automated and miniaturized assay platforms has further reinforced the adoption of luciferase assays, as they enable rapid and cost-effective experimentation. Additionally, the compatibility of luciferase assays with multiplexing techniques allows simultaneous analysis of multiple targets, improving research efficiency.
Increasing investments in drug discovery, molecular biology research, and translational studies have also contributed to the strong growth of this segment The widespread availability of luciferase assay kits and reagents, coupled with enhanced assay sensitivity and scalability, has solidified the segment’s position as the dominant product type in the market.
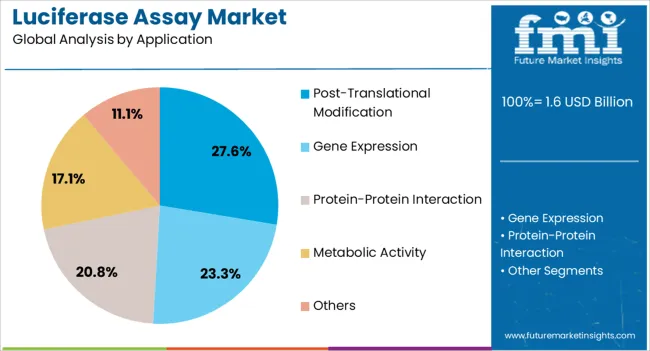
The post-translational modification application segment is expected to account for 27.6% of the Luciferase Assay market revenue share in 2025, positioning it as the leading application segment. The growth of this segment is driven by the critical role of luciferase assays in studying protein modifications, enzyme activities, and signaling pathways. The ability to monitor dynamic changes in protein function and interaction in real time has made these assays essential for advanced molecular biology research.
Integration with automated platforms and high-throughput screening systems has further enhanced the efficiency and reproducibility of post-translational modification studies. Increasing investments in drug discovery, targeted therapeutics, and functional genomics are fueling demand for reliable assay platforms in this application area.
Furthermore, the growing focus on personalized medicine and understanding disease mechanisms at the molecular level has accelerated the adoption of luciferase assays for post-translational modification analysis The convergence of technological innovation, research demand, and data-driven insights continues to reinforce the segment’s dominant position in the market.
| Drivers |
|
|---|---|
| Challenges |
|
| Attributes | Details |
|---|---|
| Product Type | Luciferase Assays |
| Market share in 2025 | 35.00% |
Luciferase assays are gaining popularity among researchers due to their compatibility with a wide range of products such as reagents, kits, and instruments. Moreover, the upsurge in drug discovery and development has led to the increasing adoption of these assays in recent years.
Furthermore, the increasing availability of advanced technologies, such as high-throughput screening systems and automated instrumentation, has made it easier to perform these assays on a large scale.
| Attributes | Details |
|---|---|
| Application | Protein-protein Interaction |
| Market Share in 2025 | 27.60% |
Rising need for understanding complex cellular processes and developing effective drugs to treat specific diseases has led researchers to use protein-protein interactions as a common method. Increasing focus on personalized medicine is driving the growth of the protein-protein interaction segment.
Personalized medicine involves developing drugs tailored to the genetic makeup of individual patients. To do this, researchers need to study the interactions between specific proteins involved in disease pathways.
| Countries | CAGR from 2025 to 2035 |
|---|---|
| United States | 3.20% |
| China | 6.00% |
| Germany | 2.50% |
| India | 7.60% |
| Australia | 5.30% |
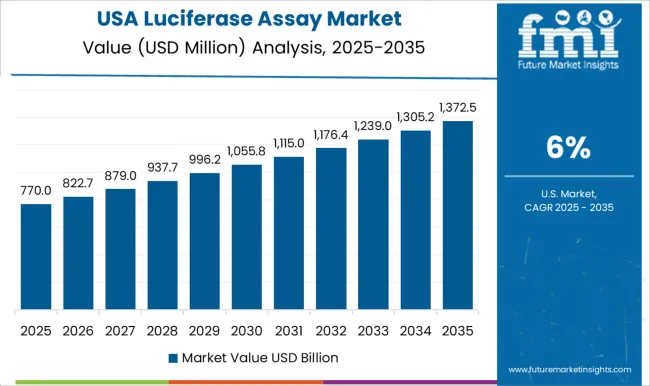
The CAGR of the market in the United States during the forecast period is anticipated to be 3.20%. The United States dominates the market in North America due to strong government financing for research into innovative test methodologies. Although demand for luciferase assays in this country has remained robust, operations targeting the market have recently shifted.
The market is expected to register a CAGR of 6.00% in China through 2035. The government plays a major role in the growth of the luciferase assay market in China by providing funding and facilities for drug discoveries and development.
China has greater development potential in this industry. Many firms are focusing their resources on economically growing regions, especially in the Asia Pacific, to explore product potential that is expected to increase luciferase assay sales.
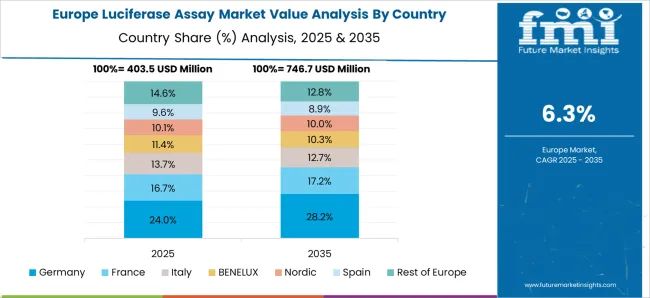
The market is expected to progress at a CAGR of 2.50% in Germany throughout the forecast period. The need for advanced technology is anticipated to drive the luciferase assay market in Germany.
By providing high sensitivity, low background, and real-time detection capabilities, these assays are gaining more market potential than traditional methods in the country. Moreover, the high usage of luciferase assays in laboratories across Germany, especially for pharmaceutical purposes, has been observed in recent years.
The market is expected to progress at a CAGR of 5.30% in Australia throughout the forecast period. Escalating demand for biotechnology and life science research is driving up the demand for the luciferase assay market in the region. Moreover, the expanding pharmaceutical industry is anticipated to gain a major market share in Australia in the coming years.
The market is expected to progress at a CAGR of 7.60% in India. Advancements in technology have led to the development of new and improved luciferase assay kits, making them more accessible and affordable to researchers and scientists in India.
Moreover, the luciferase assay market in India is expected to grow due to the increasing demand for personalized medicine in the region. As personalized medicine becomes more prevalent, there will be a need for more precise and efficient tools to diagnose and treat diseases.
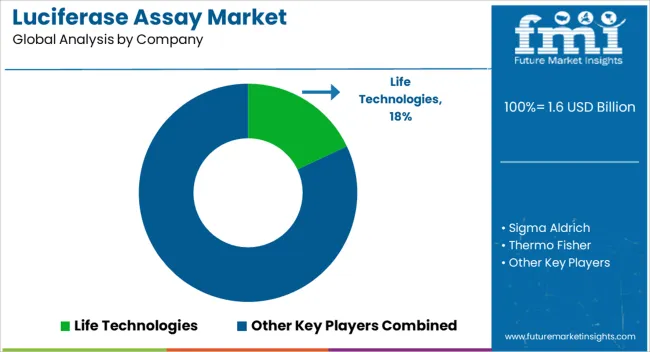
The luciferase assay market is highly competitive, with numerous players involved in the development and production of assay kits and reagents. Companies are constantly innovating and launching new products to stay ahead of the competition.
Additionally, partnerships, collaborations, and mergers and acquisitions are common strategies these players adopt to expand their market presence and enhance their product portfolio.
Thermo Fisher Scientific Inc.
Thermo Fisher Scientific Inc. is a leading biotechnology company that offers a wide range of products and services to the life science, healthcare, and industrial markets. The company has a global presence and operates through four business segments: Life Sciences Solutions, Analytical Instruments, Specialty Diagnostics, and Laboratory Products and Services.
One of the key products offered by Thermo Fisher Scientific Inc. is its range of Luciferase Assays. These assays are designed to measure the activity of luciferase enzymes, which are commonly used as reporter genes in molecular biology research.
The assay kits offered by Thermo Fisher Scientific Inc. are used to measure the expression of genes, monitor protein-protein interactions, and detect changes in cellular signaling pathways.
PerkinElmer Inc.
PerkinElmer Inc. is a global leader in providing innovative products, services, and solutions to the life sciences, diagnostics, and applied markets. The company's diverse portfolio includes a wide range of products, including analytical instruments, reagents, software, and consumables.
PerkinElmer's luciferase assays are among its most popular products, offering researchers a range of options for measuring gene expression and monitoring cellular signaling pathways.
PerkinElmer's assays are designed to be highly sensitive, reliable, and easy to use. The company offers a range of assay formats, including reporter gene assays, dual-luciferase reporter assays, and firefly assay kits.
Acquisition, Mergers, and Recent Development
| Attribute | Details |
|---|---|
| Estimated Market Size (2025) | USD 1,536.70 million |
| Projected Market Size (2035) | USD 3,022.90 million |
| Anticipated Growth Rate (2025 to 2035) | 7.00% |
| Forecast Period | 2025 to 2035 |
| Historical Data Available for | 2020 to 2025 |
| Market Analysis | USD million or billion for Value and Units for Volume |
| Key Regions Covered | North America; Latin America; Europe; Middle East & Africa (MEA); East Asia; South Asia and Oceania |
| Key Countries Covered | United States, Canada, Brazil, Mexico, Germany, Spain, Italy, France, United Kingdom, Russia, China, India, Australia & New Zealand, GCC Countries, and South Africa |
| Key Segments Covered | Product Type and Application |
| Key Companies Profiled | Promega Corporation; PerkinElmer Inc.; Thermo Fisher Scientific Inc.; Abcam plc; Geno Technology Inc.; BioTek Instruments, Inc.; Becton, Dickinson and Company; Merck KGaA; Cell Signaling Technology, Inc.; Danaher Corporation. |
| Report Coverage | Market Forecast, Company Share Analysis, Competition Intelligence, DROT Analysis, Market Dynamics and Challenges, and Strategic Growth Initiatives |
The global luciferase assay market is estimated to be valued at USD 1.6 billion in 2025.
The market size for the luciferase assay market is projected to reach USD 3.2 billion by 2035.
The luciferase assay market is expected to grow at a 7.0% CAGR between 2025 and 2035.
The key product types in luciferase assay market are luciferase assays, beta-galactosidase assays, fluorescent protein-related assays and chloramphenicol acetyltransferase assays.
In terms of application, post-translational modification segment to command 27.6% share in the luciferase assay market in 2025.


Our Research Products

The "Full Research Suite" delivers actionable market intel, deep dives on markets or technologies, so clients act faster, cut risk, and unlock growth.

The Leaderboard benchmarks and ranks top vendors, classifying them as Established Leaders, Leading Challengers, or Disruptors & Challengers.

Locates where complements amplify value and substitutes erode it, forecasting net impact by horizon

We deliver granular, decision-grade intel: market sizing, 5-year forecasts, pricing, adoption, usage, revenue, and operational KPIs—plus competitor tracking, regulation, and value chains—across 60 countries broadly.

Spot the shifts before they hit your P&L. We track inflection points, adoption curves, pricing moves, and ecosystem plays to show where demand is heading, why it is changing, and what to do next across high-growth markets and disruptive tech

Real-time reads of user behavior. We track shifting priorities, perceptions of today’s and next-gen services, and provider experience, then pace how fast tech moves from trial to adoption, blending buyer, consumer, and channel inputs with social signals (#WhySwitch, #UX).

Partner with our analyst team to build a custom report designed around your business priorities. From analysing market trends to assessing competitors or crafting bespoke datasets, we tailor insights to your needs.
Supplier Intelligence
Discovery & Profiling
Capacity & Footprint
Performance & Risk
Compliance & Governance
Commercial Readiness
Who Supplies Whom
Scorecards & Shortlists
Playbooks & Docs
Category Intelligence
Definition & Scope
Demand & Use Cases
Cost Drivers
Market Structure
Supply Chain Map
Trade & Policy
Operating Norms
Deliverables
Buyer Intelligence
Account Basics
Spend & Scope
Procurement Model
Vendor Requirements
Terms & Policies
Entry Strategy
Pain Points & Triggers
Outputs
Pricing Analysis
Benchmarks
Trends
Should-Cost
Indexation
Landed Cost
Commercial Terms
Deliverables
Brand Analysis
Positioning & Value Prop
Share & Presence
Customer Evidence
Go-to-Market
Digital & Reputation
Compliance & Trust
KPIs & Gaps
Outputs
Full Research Suite comprises of:
Market outlook & trends analysis
Interviews & case studies
Strategic recommendations
Vendor profiles & capabilities analysis
5-year forecasts
8 regions and 60+ country-level data splits
Market segment data splits
12 months of continuous data updates
DELIVERED AS:
PDF EXCEL ONLINE
Immunoassay Market Size and Share Forecast Outlook 2025 to 2035
Immunoassay CDMO Market Analysis – Size, Trends & Industry Outlook 2025-2035
Custom Assays Market
Lactose Assay Kit Market Size and Share Forecast Outlook 2025 to 2035
Diabetic Assays Market
ELISA POT Assay Kits Market Size and Share Forecast Outlook 2025 to 2035
Crude Oil Assay Testing Services Market
Multiplex Assay Market
Radioimmunoassay Market Growth - Trends & Forecast 2025 to 2035
Global Metabolism Assay Market Analysis – Size, Share & Forecast 2024-2034
The Neuro Immunoassay Market is segmented by product, and end user from 2025 to 2035
Lateral Flow Assay Component Market Size and Share Forecast Outlook 2025 to 2035
Animal Immunoassay Kits Market Analysis - Size, Share, and Forecast Outlook 2025 to 2035
Cytotoxicity Assays Market Size and Share Forecast Outlook 2025 to 2035
Angiogenesis Assays Market Insights – Growth & Forecast 2025 to 2035
Lateral Flow Assays Market Analysis - Size, Share & Forecast 2025 to 2035
Multiplex PCR Assays Market Size and Share Forecast Outlook 2025 to 2035
Mycology Immunoassays Testing Market Size and Share Forecast Outlook 2025 to 2035
Dual Biomarker Assays Market Analysis - Size, Share, & Forecast Outlook 2025 to 2035
Organ Function Assays Market

Thank you!
You will receive an email from our Business Development Manager. Please be sure to check your SPAM/JUNK folder too.
Chat With
MaRIA