Makeup Setting Spray Market Size and Share Forecast Outlook From 2024 to 2034

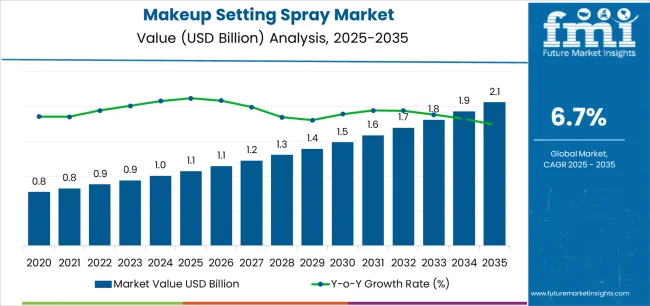
The makeup setting spray market is expected to increase at a CAGR of 7.1% over the forecast period. The market value is expected to rise from USD 1 billion in 2024 to USD 2 billion by 2034.

Makeup Setting Spray Market Size, Analysis and Insights

  • The beauty and cosmetics industry is experiencing growth due to consumers' desire to prolong and enhance their makeup, emphasizing the significance of setting sprays for maintaining a polished appearance.
  • The increasing daily makeup use, influenced by social media influence and Western beauty standards in emerging economies, is driving the demand for setting sprays as essential tools for achieving desired beauty effects.
  • Online tutorials and educational content on makeup application techniques are influencing more people to incorporate setting sprays into their beauty routines, driving market growth.
  • Developing setting sprays free from harmful ingredients due to consumer demand for safer and more sustainable beauty solutions.
  • Online shopping has revolutionized global access to brands and retailers, enabling consumers to explore and purchase setting sprays from various locations.
  • Setting sprays are popular due to their accessibility and popularity, as they offer both affordable and high-end options in both offline and virtual markets.
  • Beauty brands are constantly innovating their product offerings and marketing strategies to capture market share, with brand endorsements and collaborations with celebrities and makeup artists significantly influencing consumer perceptions.
Attributes Details
Makeup Setting Spray Market Size, 2024 USD 1 Billion
Projected Market Size, 2034 USD 2 Billion
Value-based CAGR (2024 to 2034) 7.1%

Key Opportunities for Makeup Setting Spray Manufacturers

The makeup setting spray market is poised for significant growth due to the incorporation of skincare benefits into its formulations.

  • The market is anticipated to experience a significant opportunity due to the global trend toward organic and vegan cosmetic products.
  • Urban Decay is introducing a range of vegan setting sprays, including SPF protection and hydration options, to cater to its diverse customer base.
  • Manufacturers are promoting the use of natural components in their cosmetics and facial care products to attract more customers.
  • The strategy aligns with the increasing demand for skincare-infused cosmetics, offering brands a chance to differentiate themselves in a competitive market and cater to evolving consumer preferences for holistic beauty solutions.
  • Developing specialized setting sprays for specific skincare needs, such as mattifying for oily skin or hydration for dry skin, can boost market penetration and consumer satisfaction.
  • Makeup setting spray brands can capitalize on evolving consumer preferences by embracing opportunities for product diversification and customization, driving market growth.

Challenges in the Makeup Setting Spray Market

The makeup setting spray market is facing numerous challenges that could potentially hinder its growth and sustainability.

  • Lack of awareness and understanding among consumers, particularly in emerging economies, hinders the market's ability to attract a broader audience.
  • Premium pricing of hair-setting sprays remains a significant concern for budget-conscious consumers in regions with lower per capita incomes.
  • Intense competition from alternative products like makeup setting powders and traditional methods diversifies consumer choices and impacts the market negatively.
  • Misconceptions and negative perceptions surrounding the potential adverse effects of setting sprays need to be addressed through effective marketing strategies by industry leaders.
  • Regulatory compliance regarding ingredient restrictions and labeling regulations adds complexity to product development and distribution processes across different regions and markets for manufacturers of makeup-setting sprays.
  • Growing competition within the market poses challenges for new entrants to differentiate themselves and gain market share, potentially leading to price wars and margin pressure, which affects profitability.
  • Educating consumers about the benefits and proper usage of makeup-setting sprays requires significant marketing efforts and resources to ensure alignment with consumer needs and preferences.
  • Environmental concerns associated with the packaging and formulation of makeup-setting sprays, including plastic waste and harmful chemicals, drive pressure on brands to adopt sustainable practices such as recyclable packaging and eco-friendly formulations.
  • Smaller brands encounter obstacles in establishing effective distribution channels and securing retail shelf space, particularly amidst the rise of e-commerce, requiring optimization of online presence and navigation of online retail complexities to effectively reach consumers.

Analysis of Top Countries Involved in Manufacturing, Distributing, and Using Makeup Setting Sprays

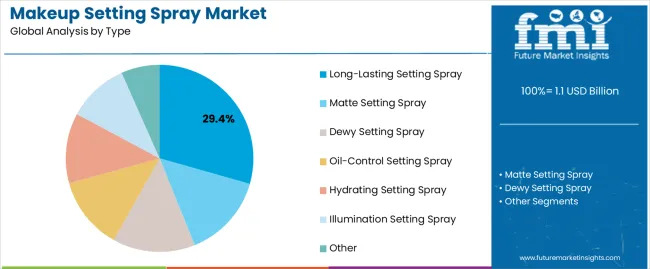
The Matte Setting Spray Segment Leads the Market by Product Type

Attributes Details
Top Type Matte Setting Spray
CAGR (2024 to 2034) 6.8%
  • The matte setting spray segment dominates the makeup setting spray market due to its popularity for matte finishes, effective oil control, long-lasting makeup hold, and versatility in usage.
  • These sprays are popular among individuals with oily or combination skin types, as they ensure makeup stays in place for extended periods without frequent touch-ups.
  • Versatile and suitable for various makeup styles and occasions, making them a reliable option for achieving a matte finish.
  • The segment's dominance in the market is attributed to consumer preference for specific cosmetic benefits like oil control and long-lasting wear.

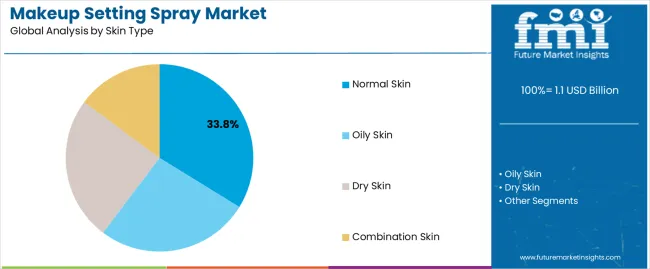
The Top Skin Type Comprises the Market in the Normal Skin Segment

Attributes Details
Top skin type Normal skin
CAGR (2024 to 2034) 6.5%
  • The normal skin type is the most common skin type, with a wide consumer base, a wide range of age groups, and diverse skincare needs.
  • Products catering to normal skin types offer versatility in usage, as they cater to a wide range of individuals with different skincare needs. Unlike other skin types, normal skin requires fewer specialized products, making it easier for consumers to find suitable products.
  • Individuals with normal skin often prioritize maintenance and prevention in their skincare routines, seeking products that help maintain skin balance and prevent issues like dryness or excess oiliness.
  • The market offers a variety of skincare products tailored to normal skin, including cleansers, moisturizers, and treatments, catering to diverse consumer preferences.
  • Balanced formulations with gentle ingredients promote hydration, nourishment, and overall skin health, appealing to consumers seeking effective yet gentle skincare solutions.

Makeup Setting Spray Industry Analysis by Top Investment Segments

Countries CAGR through 2034
United States 7.2%
United Kingdom 7.8%
China 7.4%
Japan 8.1%
South Korea 8.2%

The United States is Renowned for its Beauty and Innovation, Leading the Charge in Makeup-Setting Spray Trends

  • The United States has a large consumer base that is highly receptive to beauty and cosmetic products, driving a consistent demand for makeup-setting sprays.
  • The market is innovative, with continuous product launches and advancements catering to diverse consumer needs.
  • Celebrity endorsements and social media influencers significantly influence consumer choices, driving the adoption of makeup-setting sprays as part of mainstream beauty routines.
  • Health-conscious consumers seek natural and skin-friendly ingredients in makeup setting sprays, contributing to market growth.
  • The widespread availability of makeup setting sprays through retail channels like specialty stores, department stores, and online platforms enhances accessibility.
  • The fast-paced lifestyle in the USA fuels the demand for long-lasting makeup solutions.
  • The market is highly responsive to emerging beauty trends, fostering continuous growth in the makeup setting spray segment.

The United Kingdom is Establishing Itself as a Leader in the Dynamic Makeup Setting Spray Market

  • The United Kingdom's beauty-conscious population, driven by urbanization and fashion trends, is driving the growth of the makeup-setting spray market.
  • Consumers seek products that help achieve flawless and long-lasting makeup looks. Influencer marketing influences purchase decisions, with social media influencers and beauty bloggers endorsing makeup-setting sprays.
  • The market prefers premium, high-quality products, leading to the adoption of innovative and effective makeup setting sprays.
  • Online retail platforms offer convenient access to a wide range of makeup-setting sprays from domestic and international brands.
  • Seasonal changes and weather conditions also influence consumer preferences, with makeup setting sprays protecting against humidity and sweat.
  • The shift towards natural ingredients aligns with the trend towards clean beauty.

China is Witnessing a Surge in the Demand For Makeup-Setting Sprays, Attracting Rising Beauty Giants

  • China's beauty market is experiencing rapid growth due to rising disposable incomes, urbanization, and increasing beauty consciousness among consumers.
  • Social media platforms and key opinion leaders (KOLs) play a crucial role in shaping beauty trends and consumer preferences.
  • The Chinese market places a strong emphasis on skincare, with consumers seeking multifunctional makeup setting sprays that offer skincare benefits alongside makeup fixation.
  • Chinese consumers prefer high-quality imported beauty products, leading to the adoption of premium makeup setting sprays with advanced formulations and effective performance.
  • The expansion of beauty retail channels, including brick-and-mortar stores, online platforms, and social commerce, enhances accessibility to a wide range of makeup setting sprays.
  • Urbanization and exposure to Western beauty standards influence consumer preferences, driving the adoption of makeup-setting sprays as an essential component of modern beauty routines.
  • Increasing awareness of environmental sustainability prompts Chinese consumers to seek eco-friendly packaging and formulations.

Japan is Known for its Unwavering Obsession with Makeup Setting Sprays, Showcasing its Commitment to Beauty Excellence

  • Japan's sophisticated beauty market is characterized by innovation, product quality, and consumer awareness, leading to significant demand for makeup setting sprays.
  • The country's cultural emphasis on skincare and the adoption of premium products with advanced formulations are key factors in this market.
  • J-Beauty trends, characterized by simplicity and natural beauty, shape consumer preferences for makeup setting sprays.
  • Japanese consumers also prefer multifunctional products, such as hydration and UV protection, resulting in comprehensive beauty solutions.
  • Japan's well-developed retail infrastructure, including department stores and specialty beauty stores, offers extensive access to a diverse range of makeup-setting sprays from domestic and international brands.
  • Japan's embrace of technology also drives the development of cutting-edge makeup setting sprays, catering to tech-savvy consumers seeking innovative beauty solutions.

South Korea's Influence on Makeup-Setting Spray Trends, Specifically Focusing on K-Beauty's Reign

  • South Korea's beauty industry is renowned for its innovative beauty trends and advanced skincare technologies, leading to a significant demand for makeup-setting sprays.
  • The K-beauty trend, which emphasizes hydration, natural ingredients, and glowing skin, influences consumer preferences in the skincare-centric market.
  • Social commerce platforms and influencer marketing drive awareness and demand for makeup-setting sprays.
  • South Korean consumers prefer lightweight formulations, avoiding heavy textures that compromise skin comfort.
  • Packaging and design aesthetics are also important, with consumers drawn to visually appealing and functional packaging.
  • The expansion of beauty brands in the South Korean market offers a diverse range of makeup setting sprays, catering to diverse preferences and needs.

Competitive Landscape of the Makeup Setting Spray Market
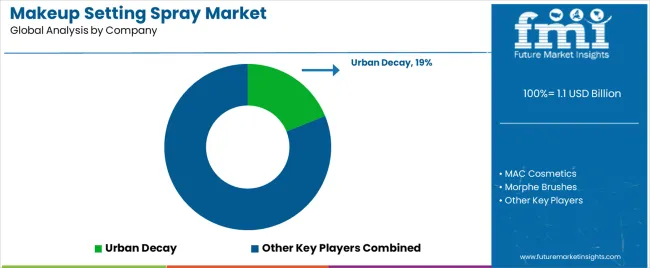
The makeup setting spray market is fiercely competitive, with leading brands constantly innovating to maintain market share and capture emerging trends. New entrants and niche brands challenge incumbents, driving diversity and innovation. Marketing strategies like influencer collaborations and social media campaigns shape brand perception and consumer loyalty. Sustainability and clean beauty are growing, with brands striving for transparency and eco-friendly practices.

Recent Development in the Makeup Setting Spray Market

  • In December 2023, RadiantCosmetics has unveiled its highly anticipated makeup setting spray range, featuring advanced formulations and sleek packaging, solidifying its reputation as a trendsetter in the cosmetics industry.
  • In March 2023, BeautyGlow Inc. launched its latest makeup setting spray line, featuring advanced formulations and eco-friendly packaging, demonstrating its commitment to sustainability and consumer satisfaction.
  • In September 2022, GlamourBeauty Corp. launched a groundbreaking makeup setting spray series, showcasing advanced formulations and chic packaging, solidifying its position as a leading cosmetics innovator.
  • In June 2021, LuminousBeauty unveiled its groundbreaking makeup setting spray collection, showcasing innovative formulas and luxurious packaging, demonstrating the company's dedication to excellence and consumer satisfaction.

Leading Companies in the Makeup Setting Spray Market

  • Urban Decay
  • MAC Cosmetics
  • Morphe Brushes
  • Milani Cosmetics
  • Cover FX
  • Ben Nye Makeup
  • Kat Von D Beauty
  • Tarte Cosmeticsamong
  • NYX Professional Makeup
  • e.l.f. Cosmetics

Top Segments Studied in the Makeup Setting Spray Market

By Type:

  • Matte Setting Spray
  • Dewy Setting Spray
  • Oil-Control Setting Spray
  • Hydrating Setting Spray
  • Long-Lasting Setting Spray
  • Illumination Setting Spray
  • Other

By Skin Type:

  • Normal Skin
  • Oily Skin
  • Dry Skin
  • Combination Skin

By Application:

  • Personal use
  • Profession use

By Distribution Channel:

  • Online Retailing
  • Specialty Beauty Stores
  • Drugstore and Pharmacies
  • Department Stores
  • Others

By Region:

  • North America
  • Latin America
  • Asia Pacific
  • Middle East and Africa (MEA)
  • Europe

Table of Content

  • 1. Executive Summary
  • 2. Market Overview
  • 3. Market Background
  • 4. Global Market Analysis 2019 to 2023 and Forecast, 2024 to 2034
  • 5. Global Market Analysis 2019 to 2023 and Forecast 2024 to 2034, By Type
    • 5.1. Matte Setting Spray
    • 5.2. Dewy Setting Spray
    • 5.3. Oil-Control Setting Spray
    • 5.4. Hydrating Setting Spray
    • 5.5. Long-Lasting Setting Spray
    • 5.6. Illuminating Setting Spray
    • 5.7. Others
  • 6. Global Market Analysis 2019 to 2023 and Forecast 2024 to 2034, By Skin Type
    • 6.1. Normal Skin
    • 6.2. Oily Skin
    • 6.3. Dry Skin
    • 6.4. Combination Skin
  • 7. Global Market Analysis 2019 to 2023 and Forecast 2024 to 2034, By Application
    • 7.1. Personal
    • 7.2. Professional
  • 8. Global Market Analysis 2019 to 2023 and Forecast 2024 to 2034, By Distribution Channel
    • 8.1. Online Retailing
    • 8.2. Specialty Beauty Stores
    • 8.3. Drugstores and Pharmacies
    • 8.4. Departmental Stores
    • 8.5. Others
  • 9. Global Market Analysis 2019 to 2023 and Forecast 2024 to 2034, By Region
    • 9.1. North America
    • 9.2. Latin America
    • 9.3. Western Europe
    • 9.4. Eastern Europe
    • 9.5. South Asia and Pacific
    • 9.6. East Asia
    • 9.7. Middle East and Africa
  • 10. North America Market Analysis 2019 to 2023 and Forecast 2024 to 2034, By Country
  • 11. Latin America Market Analysis 2019 to 2023 and Forecast 2024 to 2034, By Country
  • 12. Western Europe Market Analysis 2019 to 2023 and Forecast 2024 to 2034, By Country
  • 13. Eastern Europe Market Analysis 2019 to 2023 and Forecast 2024 to 2034, By Country
  • 14. South Asia and Pacific Market Analysis 2019 to 2023 and Forecast 2024 to 2034, By Country
  • 15. East Asia Market Analysis 2019 to 2023 and Forecast 2024 to 2034, By Country
  • 16. Middle East and Africa Market Analysis 2019 to 2023 and Forecast 2024 to 2034, By Country
  • 17. Key Countries Market Analysis
  • 18. Market Structure Analysis
  • 19. Competition Analysis
    • 19.1. Urban Decay
    • 19.2. MAC Cosmetics
    • 19.3. NYX Professional Makeup
    • 19.4. Maybelline New York
    • 19.5. Morphe Brushes
    • 19.6. Milani Cosmetics
    • 19.7. Smashbox Cosmetics
    • 19.8. Too Faced Cosmetics
    • 19.9. Cover FX
    • 19.10. Ben Nye Makeup
    • 19.11. Huda Beauty
  • 20. Assumptions & Acronyms Used
  • 21. Research Methodology

List of Tables

Table 1: Global Market Value (US$ Million) Forecast by Region, 2019 to 2034

Table 2: Global Market Volume (Units) Forecast by Region, 2019 to 2034

Table 3: Global Market Value (US$ Million) Forecast by Type, 2019 to 2034

Table 4: Global Market Volume (Units) Forecast by Type, 2019 to 2034

Table 5: Global Market Value (US$ Million) Forecast by Skin Type, 2019 to 2034

Table 6: Global Market Volume (Units) Forecast by Skin Type, 2019 to 2034

Table 7: Global Market Value (US$ Million) Forecast by Application, 2019 to 2034

Table 8: Global Market Volume (Units) Forecast by Application, 2019 to 2034

Table 9: Global Market Value (US$ Million) Forecast by Distribution Channel, 2019 to 2034

Table 10: Global Market Volume (Units) Forecast by Distribution Channel, 2019 to 2034

Table 11: North America Market Value (US$ Million) Forecast by Country, 2019 to 2034

Table 12: North America Market Volume (Units) Forecast by Country, 2019 to 2034

Table 13: North America Market Value (US$ Million) Forecast by Type, 2019 to 2034

Table 14: North America Market Volume (Units) Forecast by Type, 2019 to 2034

Table 15: North America Market Value (US$ Million) Forecast by Skin Type, 2019 to 2034

Table 16: North America Market Volume (Units) Forecast by Skin Type, 2019 to 2034

Table 17: North America Market Value (US$ Million) Forecast by Application, 2019 to 2034

Table 18: North America Market Volume (Units) Forecast by Application, 2019 to 2034

Table 19: North America Market Value (US$ Million) Forecast by Distribution Channel, 2019 to 2034

Table 20: North America Market Volume (Units) Forecast by Distribution Channel, 2019 to 2034

Table 21: Latin America Market Value (US$ Million) Forecast by Country, 2019 to 2034

Table 22: Latin America Market Volume (Units) Forecast by Country, 2019 to 2034

Table 23: Latin America Market Value (US$ Million) Forecast by Type, 2019 to 2034

Table 24: Latin America Market Volume (Units) Forecast by Type, 2019 to 2034

Table 25: Latin America Market Value (US$ Million) Forecast by Skin Type, 2019 to 2034

Table 26: Latin America Market Volume (Units) Forecast by Skin Type, 2019 to 2034

Table 27: Latin America Market Value (US$ Million) Forecast by Application, 2019 to 2034

Table 28: Latin America Market Volume (Units) Forecast by Application, 2019 to 2034

Table 29: Latin America Market Value (US$ Million) Forecast by Distribution Channel, 2019 to 2034

Table 30: Latin America Market Volume (Units) Forecast by Distribution Channel, 2019 to 2034

Table 31: Western Europe Market Value (US$ Million) Forecast by Country, 2019 to 2034

Table 32: Western Europe Market Volume (Units) Forecast by Country, 2019 to 2034

Table 33: Western Europe Market Value (US$ Million) Forecast by Type, 2019 to 2034

Table 34: Western Europe Market Volume (Units) Forecast by Type, 2019 to 2034

Table 35: Western Europe Market Value (US$ Million) Forecast by Skin Type, 2019 to 2034

Table 36: Western Europe Market Volume (Units) Forecast by Skin Type, 2019 to 2034

Table 37: Western Europe Market Value (US$ Million) Forecast by Application, 2019 to 2034

Table 38: Western Europe Market Volume (Units) Forecast by Application, 2019 to 2034

Table 39: Western Europe Market Value (US$ Million) Forecast by Distribution Channel, 2019 to 2034

Table 40: Western Europe Market Volume (Units) Forecast by Distribution Channel, 2019 to 2034

Table 41: Eastern Europe Market Value (US$ Million) Forecast by Country, 2019 to 2034

Table 42: Eastern Europe Market Volume (Units) Forecast by Country, 2019 to 2034

Table 43: Eastern Europe Market Value (US$ Million) Forecast by Type, 2019 to 2034

Table 44: Eastern Europe Market Volume (Units) Forecast by Type, 2019 to 2034

Table 45: Eastern Europe Market Value (US$ Million) Forecast by Skin Type, 2019 to 2034

Table 46: Eastern Europe Market Volume (Units) Forecast by Skin Type, 2019 to 2034

Table 47: Eastern Europe Market Value (US$ Million) Forecast by Application, 2019 to 2034

Table 48: Eastern Europe Market Volume (Units) Forecast by Application, 2019 to 2034

Table 49: Eastern Europe Market Value (US$ Million) Forecast by Distribution Channel, 2019 to 2034

Table 50: Eastern Europe Market Volume (Units) Forecast by Distribution Channel, 2019 to 2034

Table 51: South Asia and Pacific Market Value (US$ Million) Forecast by Country, 2019 to 2034

Table 52: South Asia and Pacific Market Volume (Units) Forecast by Country, 2019 to 2034

Table 53: South Asia and Pacific Market Value (US$ Million) Forecast by Type, 2019 to 2034

Table 54: South Asia and Pacific Market Volume (Units) Forecast by Type, 2019 to 2034

Table 55: South Asia and Pacific Market Value (US$ Million) Forecast by Skin Type, 2019 to 2034

Table 56: South Asia and Pacific Market Volume (Units) Forecast by Skin Type, 2019 to 2034

Table 57: South Asia and Pacific Market Value (US$ Million) Forecast by Application, 2019 to 2034

Table 58: South Asia and Pacific Market Volume (Units) Forecast by Application, 2019 to 2034

Table 59: South Asia and Pacific Market Value (US$ Million) Forecast by Distribution Channel, 2019 to 2034

Table 60: South Asia and Pacific Market Volume (Units) Forecast by Distribution Channel, 2019 to 2034

Table 61: East Asia Market Value (US$ Million) Forecast by Country, 2019 to 2034

Table 62: East Asia Market Volume (Units) Forecast by Country, 2019 to 2034

Table 63: East Asia Market Value (US$ Million) Forecast by Type, 2019 to 2034

Table 64: East Asia Market Volume (Units) Forecast by Type, 2019 to 2034

Table 65: East Asia Market Value (US$ Million) Forecast by Skin Type, 2019 to 2034

Table 66: East Asia Market Volume (Units) Forecast by Skin Type, 2019 to 2034

Table 67: East Asia Market Value (US$ Million) Forecast by Application, 2019 to 2034

Table 68: East Asia Market Volume (Units) Forecast by Application, 2019 to 2034

Table 69: East Asia Market Value (US$ Million) Forecast by Distribution Channel, 2019 to 2034

Table 70: East Asia Market Volume (Units) Forecast by Distribution Channel, 2019 to 2034

Table 71: Middle East and Africa Market Value (US$ Million) Forecast by Country, 2019 to 2034

Table 72: Middle East and Africa Market Volume (Units) Forecast by Country, 2019 to 2034

Table 73: Middle East and Africa Market Value (US$ Million) Forecast by Type, 2019 to 2034

Table 74: Middle East and Africa Market Volume (Units) Forecast by Type, 2019 to 2034

Table 75: Middle East and Africa Market Value (US$ Million) Forecast by Skin Type, 2019 to 2034

Table 76: Middle East and Africa Market Volume (Units) Forecast by Skin Type, 2019 to 2034

Table 77: Middle East and Africa Market Value (US$ Million) Forecast by Application, 2019 to 2034

Table 78: Middle East and Africa Market Volume (Units) Forecast by Application, 2019 to 2034

Table 79: Middle East and Africa Market Value (US$ Million) Forecast by Distribution Channel, 2019 to 2034

Table 80: Middle East and Africa Market Volume (Units) Forecast by Distribution Channel, 2019 to 2034

List of Figures

Figure 1: Global Market Value (US$ Million) by Type, 2024 to 2034

Figure 2: Global Market Value (US$ Million) by Skin Type, 2024 to 2034

Figure 3: Global Market Value (US$ Million) by Application, 2024 to 2034

Figure 4: Global Market Value (US$ Million) by Distribution Channel, 2024 to 2034

Figure 5: Global Market Value (US$ Million) by Region, 2024 to 2034

Figure 6: Global Market Value (US$ Million) Analysis by Region, 2019 to 2034

Figure 7: Global Market Volume (Units) Analysis by Region, 2019 to 2034

Figure 8: Global Market Value Share (%) and BPS Analysis by Region, 2024 to 2034

Figure 9: Global Market Y-o-Y Growth (%) Projections by Region, 2024 to 2034

Figure 10: Global Market Value (US$ Million) Analysis by Type, 2019 to 2034

Figure 11: Global Market Volume (Units) Analysis by Type, 2019 to 2034

Figure 12: Global Market Value Share (%) and BPS Analysis by Type, 2024 to 2034

Figure 13: Global Market Y-o-Y Growth (%) Projections by Type, 2024 to 2034

Figure 14: Global Market Value (US$ Million) Analysis by Skin Type, 2019 to 2034

Figure 15: Global Market Volume (Units) Analysis by Skin Type, 2019 to 2034

Figure 16: Global Market Value Share (%) and BPS Analysis by Skin Type, 2024 to 2034

Figure 17: Global Market Y-o-Y Growth (%) Projections by Skin Type, 2024 to 2034

Figure 18: Global Market Value (US$ Million) Analysis by Application, 2019 to 2034

Figure 19: Global Market Volume (Units) Analysis by Application, 2019 to 2034

Figure 20: Global Market Value Share (%) and BPS Analysis by Application, 2024 to 2034

Figure 21: Global Market Y-o-Y Growth (%) Projections by Application, 2024 to 2034

Figure 22: Global Market Value (US$ Million) Analysis by Distribution Channel, 2019 to 2034

Figure 23: Global Market Volume (Units) Analysis by Distribution Channel, 2019 to 2034

Figure 24: Global Market Value Share (%) and BPS Analysis by Distribution Channel, 2024 to 2034

Figure 25: Global Market Y-o-Y Growth (%) Projections by Distribution Channel, 2024 to 2034

Figure 26: Global Market Attractiveness by Type, 2024 to 2034

Figure 27: Global Market Attractiveness by Skin Type, 2024 to 2034

Figure 28: Global Market Attractiveness by Application, 2024 to 2034

Figure 29: Global Market Attractiveness by Distribution Channel, 2024 to 2034

Figure 30: Global Market Attractiveness by Region, 2024 to 2034

Figure 31: North America Market Value (US$ Million) by Type, 2024 to 2034

Figure 32: North America Market Value (US$ Million) by Skin Type, 2024 to 2034

Figure 33: North America Market Value (US$ Million) by Application, 2024 to 2034

Figure 34: North America Market Value (US$ Million) by Distribution Channel, 2024 to 2034

Figure 35: North America Market Value (US$ Million) by Country, 2024 to 2034

Figure 36: North America Market Value (US$ Million) Analysis by Country, 2019 to 2034

Figure 37: North America Market Volume (Units) Analysis by Country, 2019 to 2034

Figure 38: North America Market Value Share (%) and BPS Analysis by Country, 2024 to 2034

Figure 39: North America Market Y-o-Y Growth (%) Projections by Country, 2024 to 2034

Figure 40: North America Market Value (US$ Million) Analysis by Type, 2019 to 2034

Figure 41: North America Market Volume (Units) Analysis by Type, 2019 to 2034

Figure 42: North America Market Value Share (%) and BPS Analysis by Type, 2024 to 2034

Figure 43: North America Market Y-o-Y Growth (%) Projections by Type, 2024 to 2034

Figure 44: North America Market Value (US$ Million) Analysis by Skin Type, 2019 to 2034

Figure 45: North America Market Volume (Units) Analysis by Skin Type, 2019 to 2034

Figure 46: North America Market Value Share (%) and BPS Analysis by Skin Type, 2024 to 2034

Figure 47: North America Market Y-o-Y Growth (%) Projections by Skin Type, 2024 to 2034

Figure 48: North America Market Value (US$ Million) Analysis by Application, 2019 to 2034

Figure 49: North America Market Volume (Units) Analysis by Application, 2019 to 2034

Figure 50: North America Market Value Share (%) and BPS Analysis by Application, 2024 to 2034

Figure 51: North America Market Y-o-Y Growth (%) Projections by Application, 2024 to 2034

Figure 52: North America Market Value (US$ Million) Analysis by Distribution Channel, 2019 to 2034

Figure 53: North America Market Volume (Units) Analysis by Distribution Channel, 2019 to 2034

Figure 54: North America Market Value Share (%) and BPS Analysis by Distribution Channel, 2024 to 2034

Figure 55: North America Market Y-o-Y Growth (%) Projections by Distribution Channel, 2024 to 2034

Figure 56: North America Market Attractiveness by Type, 2024 to 2034

Figure 57: North America Market Attractiveness by Skin Type, 2024 to 2034

Figure 58: North America Market Attractiveness by Application, 2024 to 2034

Figure 59: North America Market Attractiveness by Distribution Channel, 2024 to 2034

Figure 60: North America Market Attractiveness by Country, 2024 to 2034

Figure 61: Latin America Market Value (US$ Million) by Type, 2024 to 2034

Figure 62: Latin America Market Value (US$ Million) by Skin Type, 2024 to 2034

Figure 63: Latin America Market Value (US$ Million) by Application, 2024 to 2034

Figure 64: Latin America Market Value (US$ Million) by Distribution Channel, 2024 to 2034

Figure 65: Latin America Market Value (US$ Million) by Country, 2024 to 2034

Figure 66: Latin America Market Value (US$ Million) Analysis by Country, 2019 to 2034

Figure 67: Latin America Market Volume (Units) Analysis by Country, 2019 to 2034

Figure 68: Latin America Market Value Share (%) and BPS Analysis by Country, 2024 to 2034

Figure 69: Latin America Market Y-o-Y Growth (%) Projections by Country, 2024 to 2034

Figure 70: Latin America Market Value (US$ Million) Analysis by Type, 2019 to 2034

Figure 71: Latin America Market Volume (Units) Analysis by Type, 2019 to 2034

Figure 72: Latin America Market Value Share (%) and BPS Analysis by Type, 2024 to 2034

Figure 73: Latin America Market Y-o-Y Growth (%) Projections by Type, 2024 to 2034

Figure 74: Latin America Market Value (US$ Million) Analysis by Skin Type, 2019 to 2034

Figure 75: Latin America Market Volume (Units) Analysis by Skin Type, 2019 to 2034

Figure 76: Latin America Market Value Share (%) and BPS Analysis by Skin Type, 2024 to 2034

Figure 77: Latin America Market Y-o-Y Growth (%) Projections by Skin Type, 2024 to 2034

Figure 78: Latin America Market Value (US$ Million) Analysis by Application, 2019 to 2034

Figure 79: Latin America Market Volume (Units) Analysis by Application, 2019 to 2034

Figure 80: Latin America Market Value Share (%) and BPS Analysis by Application, 2024 to 2034

Figure 81: Latin America Market Y-o-Y Growth (%) Projections by Application, 2024 to 2034

Figure 82: Latin America Market Value (US$ Million) Analysis by Distribution Channel, 2019 to 2034

Figure 83: Latin America Market Volume (Units) Analysis by Distribution Channel, 2019 to 2034

Figure 84: Latin America Market Value Share (%) and BPS Analysis by Distribution Channel, 2024 to 2034

Figure 85: Latin America Market Y-o-Y Growth (%) Projections by Distribution Channel, 2024 to 2034

Figure 86: Latin America Market Attractiveness by Type, 2024 to 2034

Figure 87: Latin America Market Attractiveness by Skin Type, 2024 to 2034

Figure 88: Latin America Market Attractiveness by Application, 2024 to 2034

Figure 89: Latin America Market Attractiveness by Distribution Channel, 2024 to 2034

Figure 90: Latin America Market Attractiveness by Country, 2024 to 2034

Figure 91: Western Europe Market Value (US$ Million) by Type, 2024 to 2034

Figure 92: Western Europe Market Value (US$ Million) by Skin Type, 2024 to 2034

Figure 93: Western Europe Market Value (US$ Million) by Application, 2024 to 2034

Figure 94: Western Europe Market Value (US$ Million) by Distribution Channel, 2024 to 2034

Figure 95: Western Europe Market Value (US$ Million) by Country, 2024 to 2034

Figure 96: Western Europe Market Value (US$ Million) Analysis by Country, 2019 to 2034

Figure 97: Western Europe Market Volume (Units) Analysis by Country, 2019 to 2034

Figure 98: Western Europe Market Value Share (%) and BPS Analysis by Country, 2024 to 2034

Figure 99: Western Europe Market Y-o-Y Growth (%) Projections by Country, 2024 to 2034

Figure 100: Western Europe Market Value (US$ Million) Analysis by Type, 2019 to 2034

Figure 101: Western Europe Market Volume (Units) Analysis by Type, 2019 to 2034

Figure 102: Western Europe Market Value Share (%) and BPS Analysis by Type, 2024 to 2034

Figure 103: Western Europe Market Y-o-Y Growth (%) Projections by Type, 2024 to 2034

Figure 104: Western Europe Market Value (US$ Million) Analysis by Skin Type, 2019 to 2034

Figure 105: Western Europe Market Volume (Units) Analysis by Skin Type, 2019 to 2034

Figure 106: Western Europe Market Value Share (%) and BPS Analysis by Skin Type, 2024 to 2034

Figure 107: Western Europe Market Y-o-Y Growth (%) Projections by Skin Type, 2024 to 2034

Figure 108: Western Europe Market Value (US$ Million) Analysis by Application, 2019 to 2034

Figure 109: Western Europe Market Volume (Units) Analysis by Application, 2019 to 2034

Figure 110: Western Europe Market Value Share (%) and BPS Analysis by Application, 2024 to 2034

Figure 111: Western Europe Market Y-o-Y Growth (%) Projections by Application, 2024 to 2034

Figure 112: Western Europe Market Value (US$ Million) Analysis by Distribution Channel, 2019 to 2034

Figure 113: Western Europe Market Volume (Units) Analysis by Distribution Channel, 2019 to 2034

Figure 114: Western Europe Market Value Share (%) and BPS Analysis by Distribution Channel, 2024 to 2034

Figure 115: Western Europe Market Y-o-Y Growth (%) Projections by Distribution Channel, 2024 to 2034

Figure 116: Western Europe Market Attractiveness by Type, 2024 to 2034

Figure 117: Western Europe Market Attractiveness by Skin Type, 2024 to 2034

Figure 118: Western Europe Market Attractiveness by Application, 2024 to 2034

Figure 119: Western Europe Market Attractiveness by Distribution Channel, 2024 to 2034

Figure 120: Western Europe Market Attractiveness by Country, 2024 to 2034

Figure 121: Eastern Europe Market Value (US$ Million) by Type, 2024 to 2034

Figure 122: Eastern Europe Market Value (US$ Million) by Skin Type, 2024 to 2034

Figure 123: Eastern Europe Market Value (US$ Million) by Application, 2024 to 2034

Figure 124: Eastern Europe Market Value (US$ Million) by Distribution Channel, 2024 to 2034

Figure 125: Eastern Europe Market Value (US$ Million) by Country, 2024 to 2034

Figure 126: Eastern Europe Market Value (US$ Million) Analysis by Country, 2019 to 2034

Figure 127: Eastern Europe Market Volume (Units) Analysis by Country, 2019 to 2034

Figure 128: Eastern Europe Market Value Share (%) and BPS Analysis by Country, 2024 to 2034

Figure 129: Eastern Europe Market Y-o-Y Growth (%) Projections by Country, 2024 to 2034

Figure 130: Eastern Europe Market Value (US$ Million) Analysis by Type, 2019 to 2034

Figure 131: Eastern Europe Market Volume (Units) Analysis by Type, 2019 to 2034

Figure 132: Eastern Europe Market Value Share (%) and BPS Analysis by Type, 2024 to 2034

Figure 133: Eastern Europe Market Y-o-Y Growth (%) Projections by Type, 2024 to 2034

Figure 134: Eastern Europe Market Value (US$ Million) Analysis by Skin Type, 2019 to 2034

Figure 135: Eastern Europe Market Volume (Units) Analysis by Skin Type, 2019 to 2034

Figure 136: Eastern Europe Market Value Share (%) and BPS Analysis by Skin Type, 2024 to 2034

Figure 137: Eastern Europe Market Y-o-Y Growth (%) Projections by Skin Type, 2024 to 2034

Figure 138: Eastern Europe Market Value (US$ Million) Analysis by Application, 2019 to 2034

Figure 139: Eastern Europe Market Volume (Units) Analysis by Application, 2019 to 2034

Figure 140: Eastern Europe Market Value Share (%) and BPS Analysis by Application, 2024 to 2034

Figure 141: Eastern Europe Market Y-o-Y Growth (%) Projections by Application, 2024 to 2034

Figure 142: Eastern Europe Market Value (US$ Million) Analysis by Distribution Channel, 2019 to 2034

Figure 143: Eastern Europe Market Volume (Units) Analysis by Distribution Channel, 2019 to 2034

Figure 144: Eastern Europe Market Value Share (%) and BPS Analysis by Distribution Channel, 2024 to 2034

Figure 145: Eastern Europe Market Y-o-Y Growth (%) Projections by Distribution Channel, 2024 to 2034

Figure 146: Eastern Europe Market Attractiveness by Type, 2024 to 2034

Figure 147: Eastern Europe Market Attractiveness by Skin Type, 2024 to 2034

Figure 148: Eastern Europe Market Attractiveness by Application, 2024 to 2034

Figure 149: Eastern Europe Market Attractiveness by Distribution Channel, 2024 to 2034

Figure 150: Eastern Europe Market Attractiveness by Country, 2024 to 2034

Figure 151: South Asia and Pacific Market Value (US$ Million) by Type, 2024 to 2034

Figure 152: South Asia and Pacific Market Value (US$ Million) by Skin Type, 2024 to 2034

Figure 153: South Asia and Pacific Market Value (US$ Million) by Application, 2024 to 2034

Figure 154: South Asia and Pacific Market Value (US$ Million) by Distribution Channel, 2024 to 2034

Figure 155: South Asia and Pacific Market Value (US$ Million) by Country, 2024 to 2034

Figure 156: South Asia and Pacific Market Value (US$ Million) Analysis by Country, 2019 to 2034

Figure 157: South Asia and Pacific Market Volume (Units) Analysis by Country, 2019 to 2034

Figure 158: South Asia and Pacific Market Value Share (%) and BPS Analysis by Country, 2024 to 2034

Figure 159: South Asia and Pacific Market Y-o-Y Growth (%) Projections by Country, 2024 to 2034

Figure 160: South Asia and Pacific Market Value (US$ Million) Analysis by Type, 2019 to 2034

Figure 161: South Asia and Pacific Market Volume (Units) Analysis by Type, 2019 to 2034

Figure 162: South Asia and Pacific Market Value Share (%) and BPS Analysis by Type, 2024 to 2034

Figure 163: South Asia and Pacific Market Y-o-Y Growth (%) Projections by Type, 2024 to 2034

Figure 164: South Asia and Pacific Market Value (US$ Million) Analysis by Skin Type, 2019 to 2034

Figure 165: South Asia and Pacific Market Volume (Units) Analysis by Skin Type, 2019 to 2034

Figure 166: South Asia and Pacific Market Value Share (%) and BPS Analysis by Skin Type, 2024 to 2034

Figure 167: South Asia and Pacific Market Y-o-Y Growth (%) Projections by Skin Type, 2024 to 2034

Figure 168: South Asia and Pacific Market Value (US$ Million) Analysis by Application, 2019 to 2034

Figure 169: South Asia and Pacific Market Volume (Units) Analysis by Application, 2019 to 2034

Figure 170: South Asia and Pacific Market Value Share (%) and BPS Analysis by Application, 2024 to 2034

Figure 171: South Asia and Pacific Market Y-o-Y Growth (%) Projections by Application, 2024 to 2034

Figure 172: South Asia and Pacific Market Value (US$ Million) Analysis by Distribution Channel, 2019 to 2034

Figure 173: South Asia and Pacific Market Volume (Units) Analysis by Distribution Channel, 2019 to 2034

Figure 174: South Asia and Pacific Market Value Share (%) and BPS Analysis by Distribution Channel, 2024 to 2034

Figure 175: South Asia and Pacific Market Y-o-Y Growth (%) Projections by Distribution Channel, 2024 to 2034

Figure 176: South Asia and Pacific Market Attractiveness by Type, 2024 to 2034

Figure 177: South Asia and Pacific Market Attractiveness by Skin Type, 2024 to 2034

Figure 178: South Asia and Pacific Market Attractiveness by Application, 2024 to 2034

Figure 179: South Asia and Pacific Market Attractiveness by Distribution Channel, 2024 to 2034

Figure 180: South Asia and Pacific Market Attractiveness by Country, 2024 to 2034

Figure 181: East Asia Market Value (US$ Million) by Type, 2024 to 2034

Figure 182: East Asia Market Value (US$ Million) by Skin Type, 2024 to 2034

Figure 183: East Asia Market Value (US$ Million) by Application, 2024 to 2034

Figure 184: East Asia Market Value (US$ Million) by Distribution Channel, 2024 to 2034

Figure 185: East Asia Market Value (US$ Million) by Country, 2024 to 2034

Figure 186: East Asia Market Value (US$ Million) Analysis by Country, 2019 to 2034

Figure 187: East Asia Market Volume (Units) Analysis by Country, 2019 to 2034

Figure 188: East Asia Market Value Share (%) and BPS Analysis by Country, 2024 to 2034

Figure 189: East Asia Market Y-o-Y Growth (%) Projections by Country, 2024 to 2034

Figure 190: East Asia Market Value (US$ Million) Analysis by Type, 2019 to 2034

Figure 191: East Asia Market Volume (Units) Analysis by Type, 2019 to 2034

Figure 192: East Asia Market Value Share (%) and BPS Analysis by Type, 2024 to 2034

Figure 193: East Asia Market Y-o-Y Growth (%) Projections by Type, 2024 to 2034

Figure 194: East Asia Market Value (US$ Million) Analysis by Skin Type, 2019 to 2034

Figure 195: East Asia Market Volume (Units) Analysis by Skin Type, 2019 to 2034

Figure 196: East Asia Market Value Share (%) and BPS Analysis by Skin Type, 2024 to 2034

Figure 197: East Asia Market Y-o-Y Growth (%) Projections by Skin Type, 2024 to 2034

Figure 198: East Asia Market Value (US$ Million) Analysis by Application, 2019 to 2034

Figure 199: East Asia Market Volume (Units) Analysis by Application, 2019 to 2034

Figure 200: East Asia Market Value Share (%) and BPS Analysis by Application, 2024 to 2034

Figure 201: East Asia Market Y-o-Y Growth (%) Projections by Application, 2024 to 2034

Figure 202: East Asia Market Value (US$ Million) Analysis by Distribution Channel, 2019 to 2034

Figure 203: East Asia Market Volume (Units) Analysis by Distribution Channel, 2019 to 2034

Figure 204: East Asia Market Value Share (%) and BPS Analysis by Distribution Channel, 2024 to 2034

Figure 205: East Asia Market Y-o-Y Growth (%) Projections by Distribution Channel, 2024 to 2034

Figure 206: East Asia Market Attractiveness by Type, 2024 to 2034

Figure 207: East Asia Market Attractiveness by Skin Type, 2024 to 2034

Figure 208: East Asia Market Attractiveness by Application, 2024 to 2034

Figure 209: East Asia Market Attractiveness by Distribution Channel, 2024 to 2034

Figure 210: East Asia Market Attractiveness by Country, 2024 to 2034

Figure 211: Middle East and Africa Market Value (US$ Million) by Type, 2024 to 2034

Figure 212: Middle East and Africa Market Value (US$ Million) by Skin Type, 2024 to 2034

Figure 213: Middle East and Africa Market Value (US$ Million) by Application, 2024 to 2034

Figure 214: Middle East and Africa Market Value (US$ Million) by Distribution Channel, 2024 to 2034

Figure 215: Middle East and Africa Market Value (US$ Million) by Country, 2024 to 2034

Figure 216: Middle East and Africa Market Value (US$ Million) Analysis by Country, 2019 to 2034

Figure 217: Middle East and Africa Market Volume (Units) Analysis by Country, 2019 to 2034

Figure 218: Middle East and Africa Market Value Share (%) and BPS Analysis by Country, 2024 to 2034

Figure 219: Middle East and Africa Market Y-o-Y Growth (%) Projections by Country, 2024 to 2034

Figure 220: Middle East and Africa Market Value (US$ Million) Analysis by Type, 2019 to 2034

Figure 221: Middle East and Africa Market Volume (Units) Analysis by Type, 2019 to 2034

Figure 222: Middle East and Africa Market Value Share (%) and BPS Analysis by Type, 2024 to 2034

Figure 223: Middle East and Africa Market Y-o-Y Growth (%) Projections by Type, 2024 to 2034

Figure 224: Middle East and Africa Market Value (US$ Million) Analysis by Skin Type, 2019 to 2034

Figure 225: Middle East and Africa Market Volume (Units) Analysis by Skin Type, 2019 to 2034

Figure 226: Middle East and Africa Market Value Share (%) and BPS Analysis by Skin Type, 2024 to 2034

Figure 227: Middle East and Africa Market Y-o-Y Growth (%) Projections by Skin Type, 2024 to 2034

Figure 228: Middle East and Africa Market Value (US$ Million) Analysis by Application, 2019 to 2034

Figure 229: Middle East and Africa Market Volume (Units) Analysis by Application, 2019 to 2034

Figure 230: Middle East and Africa Market Value Share (%) and BPS Analysis by Application, 2024 to 2034

Figure 231: Middle East and Africa Market Y-o-Y Growth (%) Projections by Application, 2024 to 2034

Figure 232: Middle East and Africa Market Value (US$ Million) Analysis by Distribution Channel, 2019 to 2034

Figure 233: Middle East and Africa Market Volume (Units) Analysis by Distribution Channel, 2019 to 2034

Figure 234: Middle East and Africa Market Value Share (%) and BPS Analysis by Distribution Channel, 2024 to 2034

Figure 235: Middle East and Africa Market Y-o-Y Growth (%) Projections by Distribution Channel, 2024 to 2034

Figure 236: Middle East and Africa Market Attractiveness by Type, 2024 to 2034

Figure 237: Middle East and Africa Market Attractiveness by Skin Type, 2024 to 2034

Figure 238: Middle East and Africa Market Attractiveness by Application, 2024 to 2034

Figure 239: Middle East and Africa Market Attractiveness by Distribution Channel, 2024 to 2034

Figure 240: Middle East and Africa Market Attractiveness by Country, 2024 to 2034

Frequently Asked Questions

What is the Expected Size of the Makeup Setting Spray Market in 2024?

The makeup setting spray market is projected to reach USD 1 billion by 2024.

Who are the Key Players in the Makeup Setting Spray Industry?

Key players in the makeup setting spray industry include Urban Decay.

What is the Anticipated Market Size by 2034?

The makeup setting spray market is anticipated to achieve a valuation of USD 2 billion by the end of 2034.

Which Segment Holds Prominence in the Makeup Setting Spray Market?

Matte setting sprays, such as matte or dewy finish, are expected to dominate the makeup setting spray market through 2034.

Explore Similar Insights

Future Market Insights

Makeup Setting Spray Market