

- Market Size (2026)
- USD 1.6 Bn
- Forecast (2036)
- USD 3.2 Bn
- CAGR (2026 to 2036)
- 6.9%
How big is the marine foam fire system market in 2026?
USD 1.6 billion in 2026 and USD 3.2 billion by 2036 at a 6.9% CAGR.
The marine foam fire system market is projected to grow from USD 1.5 million in 2025 to USD 3.2 billion by 2036 at 6.9% CAGR. Replacement planning starts with PFOS removal and then moves into system proof. Fluorine-free Foam is expected to hold 41.0% share in 2026. Fixed Foam Systems are estimated to secure 53.5% share for tankers and offshore units that prioritize permanent fire protection.
The marine foam fire system market is being influenced by a combination of growing maritime activity, persistent incident rates, and innovation in fluorine-free extinguishing technologies. UN Trade and Development reported 66.781 trillion ton-miles of distance-adjusted seaborne trade in 2024, reflecting continued expansion in global shipping demand. Increasing vessel movements also sustain the need for robust fire-protection systems, as EMSA recorded 2,659 marine casualties and incidents in 2024. Against this backdrop, manufacturers are accelerating the development of marine-specific foam concentrates that support environmental compliance without compromising firefighting effectiveness. Fomtec's January 2026 launch of Enviro NEO for fresh-water and seawater applications illustrates how product innovation is becoming a key competitive factor. Vessel operators are treating foam replacement as part of broader safety and asset-protection strategies, supporting ongoing demand for system upgrades and retrofits.
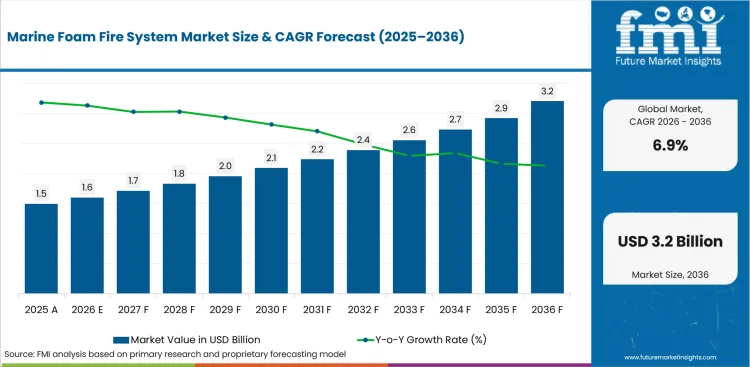
| Metric | Value |
|---|---|
| 2026 Market Size | USD 1.6 billion |
| 2036 Market Size | USD 3.2 billion |
| Forecast CAGR (2026-2036) | 6.9% |
| Leading Foam Type | Fluorine-free Foam |
| Fluorine-free Foam Share (2026) | 41.0% |
| Leading System Type | Fixed Foam Systems |
| Fixed Foam Systems Share (2026) | 53.5% |
| Fastest-growing Country | China |
| China CAGR by 2036 | 7.8% |
Summary of the Marine Foam Fire System Market
| Market Signal | Commercial Impact |
|---|---|
| Demand and Growth Drivers | The marine foam fire system market is expected to expand through 2036 as PFOS replacement programs accelerate vessel retrofit activity and survey-driven system upgrades.
|
| Product and Segment View | Fluorine-free foam concentrates, fixed foam systems, cargo protection applications, tanker installations, and service retrofit projects represent the leading commercial opportunities across the market.
|
| Geography and Growth Outlook | Asia continues to lead market expansion through shipbuilding activity, port infrastructure development, and growing compliance-driven retrofit programs.
|
| Competitive Landscape | Competition is increasingly centered on regulatory approvals, retrofit execution capabilities, and documentation support alongside proven marine fire protection performance.
|
| Analyst Perspective | Marine foam fire systems are evolving from conventional firefighting products into compliance-driven lifecycle solutions where certified performance and documented service records influence purchasing decisions.
- Nikhil Kaitwade, Principal Analyst at Future Market Insights |
Which factors support expansion in the marine foam fire system market?
Replacement spending is growing around compliance proof and fixed-system inspection needs across marine fire-risk zones.
- Foam replacement value depends on documentation that owners can present before ship survey dates.
- Supplier pricing starts with concentrate chemistry and then changes after compatibility checks and service labor are included.
- Operators create higher revenue per order by pairing foam supply with recommissioning packages.
- Buyer confidence improves after test reports confirm seawater suitability and existing proportioner compatibility.
Why is the marine foam fire system market growing?
Foam replacement is now part of inspection budgeting.
Shipowners need compliant media records and reliable discharge performance before survey closeout. The January 2026 PFOS rule gives marine fire extinguishing systems a clear replacement trigger. IMO stated that SOLAS Chapter II-2 and the 1994 and 2000 HSC Codes now prohibit PFOS-containing media. As enforcement increases, surveys focus more closely on fire‑system readiness and documentation. This scrutiny is reinforced by the operational risk environment, as EMSA reported in October 2025 with a May 2026 update that 2864 ships were involved in casualties or incidents in 2024. The regulatory requirement and the persistent incident base are making verified foam composition and recommissioning documentation essential elements of survey‑ready compliance.
How is the marine foam fire system market segmented?
The marine foam fire system industry is segmented by foam type and system type. Application and end use define the risk setting. Sales channel shows how buyers purchase foam systems and service support.
- Fluorine-free Foam is projected to secure 41.0% share in 2026 after PFOS replacement changes buyer specifications.
- Fixed Foam Systems are anticipated to hold 53.5% share in 2026 due to permanent discharge readiness needs in high-risk vessel spaces.
- Cargo / Tank Areas are forecast to represent 36.5% share in 2026 supported by liquid fuel exposure and central system planning.
- Tankers are estimated to account for 34.0% share in 2026 attributable to cargo fire exposure that keeps foam inspection central to vessel safety planning.
- Service Retrofit is likely to capture 46.0% share in 2026 after fleet replacement timing shifts more orders toward service-led work.
Which foam type category holds a notable share in the marine foam fire system market?
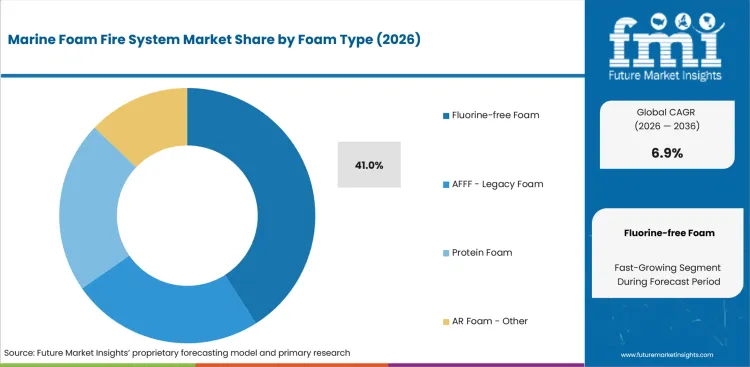
- Fluorine-free Foam is projected to account for 41.0% share in 2026 owing to PFOS replacement needs that favor compliant options over legacy concentrates.
- AFFF / Legacy Foam remains relevant only for installed-base review and phaseout planning across older fleets.
How does the system type segment perform in the marine foam fire system market?
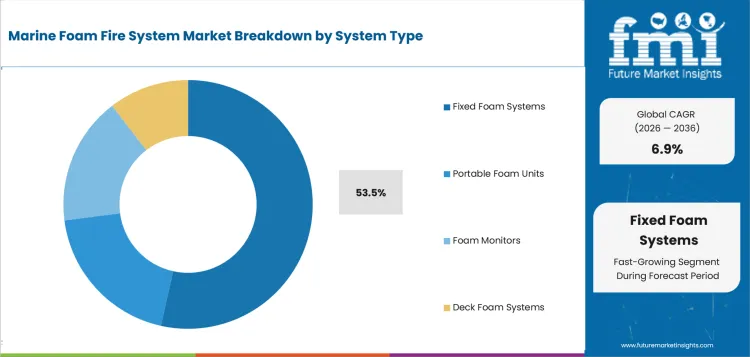
- Fixed Foam Systems are expected to represent 53.5% share in 2026 supported by immediate protection needs in defined hazard zones.
- Portable Foam Units retain demand for crew response before fixed discharge systems are activated.
What drives demand across the application segment in the marine foam fire system market?
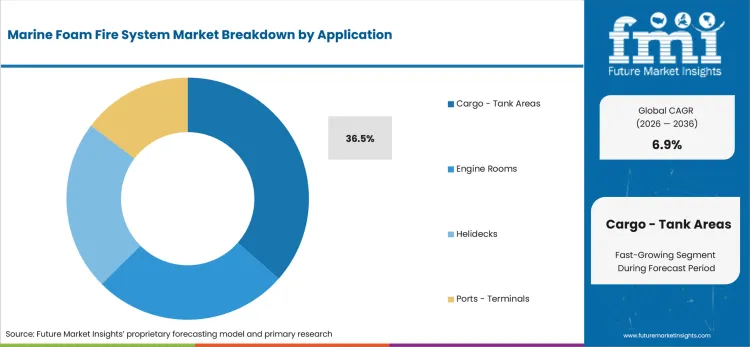
- Cargo / Tank Areas are projected to hold 36.5% share in 2026 owing to liquid cargo fire exposure that keeps this application central to foam demand.
- Helidecks gain relevance on offshore platforms that require fast crew response and clear discharge readiness.
Which end use segment shows a prominent position in the marine foam fire system market?
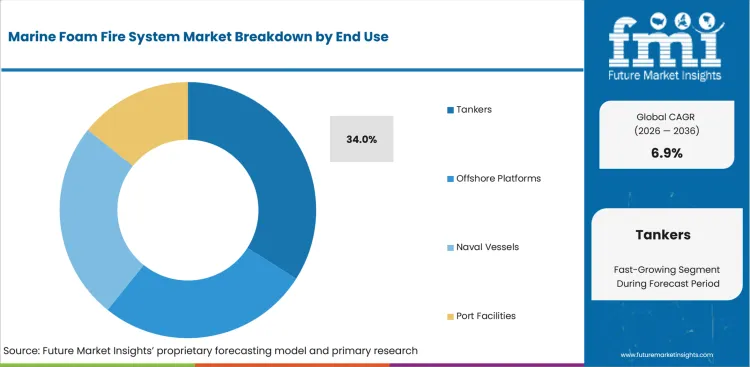
- Tankers are forecast to account for 34.0% share in 2026 driven by oil and chemical cargo hazards that sustain fixed foam spending.
- Offshore Platforms remain important owing to helideck and process-area requirements for reliable foam coverage.
How are buyers selecting across sales channel options in the marine foam fire system market?
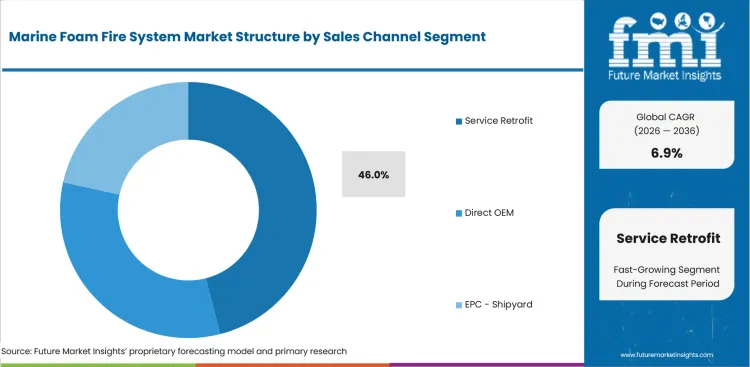
- Service Retrofit is estimated to hold 46.0% share in 2026 supported by foam changeout and recommissioning work that raise service revenue.
- Direct OEM sales remain relevant for shipyards that specify compliant foam systems before vessel delivery.
What are the drivers, restraints and opportunities in the marine foam fire system market?
PFOS replacement supports demand. Retrofit cost and approval work can still slow conversion across smaller fleets.
- Driver: PFOS compliance retrofits are expected to create demand for foam testing and replacement before vessel survey dates.
- Restraint: Retrofit cost friction can delay work after tank cleaning and equipment checks raise project budgets.
- Opportunity: Fluorine-free service bundles can help suppliers combine foam supply and system recommissioning.
PFOS Compliance Retrofit Outlook
Compliance requirements often begin during inspections rather than when foam systems are replaced. In December 2025, the UK Maritime and Coastguard Agency said amendments in force from 1 January 2026 include the PFOS foam prohibition and other fire protection requirements. That timing gives owners a practical reason to prepare composition evidence and disposal records before inspection closeout.
Tanker Deck Fire Risk Analysis
Tanker operators and marine terminals rely on firefighting foam to protect against potential fuel and liquid-cargo fires. As maritime trade grows, maintaining this protection remains a critical operational requirement. In September 2025, UN Trade and Development said distance-adjusted seaborne trade reached 66.781 trillion ton-miles in 2024. This scale keeps fuel-fire readiness inside operating budgets for terminals and tanker operators.
Fluorine-free Service Bundle Opportunity
The service opportunity is clearer after replacement work moves beyond the foam drum. Perimeter Solutions issued February 2025 transition guidance for moving from PFAS fluorinated foam to synthetic fluorine-free foam. Fomtec released Enviro NEO information in January 2026 for coastal and marine offshore installations using fresh water or seawater. These company actions show why PFAS-free firefighting foams can support testing and recommissioning packages.
Which countries are growing fastest in the marine foam fire system market?
China 7.0% CAGR, India 6.8% CAGR, United States 6.2% CAGR, South Korea 6.0% CAGR, Japan 5.7% CAGR, Germany 5.5% CAGR, France 5.3% CAGR, and United Kingdom 5.1% CAGR through 2036.
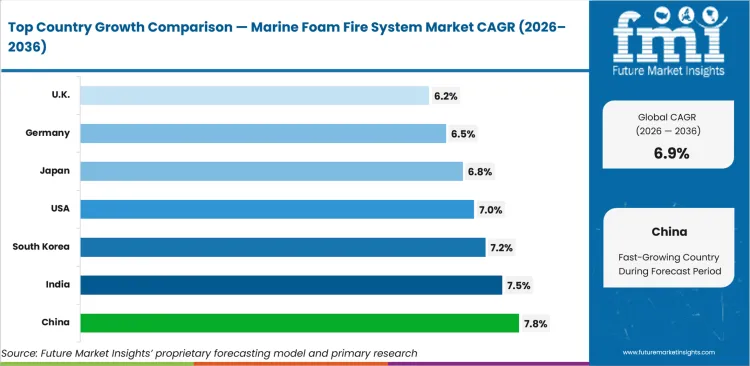
| Country | CAGR |
|---|---|
| China | 7.8% |
| India | 7.5% |
| South Korea | 7.2% |
| United States | 7.0% |
| Japan | 6.8% |
| Germany | 6.5% |
| United Kingdom | 6.2% |
| France | 6.0% |
Source: Future Market Insights, 2026.
How do country-level CAGRs compare in the marine foam fire system market?
China shows the most material country outlook. France records the most measured expansion profile among profiled markets.
- China's 7.8% CAGR by 2036 reflects port scale and shipbuilding depth that make replacement planning more active.
- India is expected to reach 7.5% CAGR by 2036, supported by major port growth and shipbuilding policy.
- South Korea's 7.2% CAGR by 2036 is shaped by shipbuilding concentration and port activity.
- The United States is anticipated to post 7.0% CAGR by 2036, driven by Gulf Coast retrofit demand and service-channel depth.
- Japan is estimated to rise at 6.8% CAGR by 2036, reflecting shipyard discipline and coastal logistics.
- Germany is forecast to grow at 6.5% CAGR by 2036, shaped by engineered specifications and port maintenance work.
- The United Kingdom is projected to expand at 6.2% CAGR by 2036 supported by port traffic and domestic foam expertise.
- France is expected to record 6.0% CAGR by 2036, supported by port concessions and liquid bulk exposure.
What is shaping marine foam fire system demand in China?
A 7.8% CAGR through 2036 reflects port scale and shipbuilding depth across coastal clusters.
Country Market Snapshot Table
| Parameter | Value |
|---|---|
| Market Size in 2025 (Value) | USD 301.5 million |
| Market Size in 2026 (Value) | USD 325.0 million |
| Market Forecast in 2036 (Value) | USD 688.8 million |
| CAGR (2026 to 2036) | 7.8% |
| Years Considered | 2021 to 2036 |
| Base Year | 2025 |
| Forecast Period | 2026 to 2036 |
| Units Considered | Value (USD million) |
| Leading Sub-Region | Yangtze River Delta and Bohai Bay clusters |
China Marine Foam Fire System Market Outlook
China demand starts with large port volumes and a deep shipyard base across coastal provinces. Buyers need foam supply that can scale across shipyards and port facilities.
Domestic foam manufacturers support cost-sensitive replacement work. Global suppliers remain relevant for export vessels that need international approvals and class-aligned documentation.
Key Growth Drivers
- Port throughput keeps fixed foam coverage inside planned safety budgets for shipyards and liquid-bulk terminals. According to the State Council in June 2025, Chinese ports handled 5.75 billion tonnes of cargo from January to April 2025. This operating scale makes replacement scheduling a regular responsibility for coastal marine assets and terminals.
- Container activity adds more berth-level points that need fire protection reviews and ready foam equipment. The State Council reported in June 2025 that Chinese ports handled 110 million TEU from January to April 2025. That movement supports terminal purchases for monitors and fixed foam networks.
- Domestic foam manufacturing improves supply access for shipyards and port operators that need faster replacement support.
- Shipbuilding depth supports OEM foam system demand across export vessels and domestic coastal fleets.
Key Restraints
- Fleet scale can make compliance execution uneven across ports and vessel operators. The State Council reported more than 5.75 billion tonnes of port cargo from January to April 2025. Large operating volumes can slow coordinated foam audits across terminals and ship service providers.
- Price-sensitive buyers can select lower-cost concentrates before full system compatibility is reviewed.
- Local and international approval requirements can lengthen supplier qualification for export vessels.
What makes China unique
China is distinctive for combining large port volumes with domestic foam manufacturing depth.
Key Companies
- Jiangsu Suolong Fire Science and Technology
- Shanghai Waysmos Fire Suppression
- Shanghai Jindun Fire-Fighting Security Equipment
- Johnson Controls China
Sales & Marketing Channels
- Shipyard procurement
- Port authority tenders
- Fire equipment distributors
- Oil terminal engineering channels
- Marine service contractors
- Direct manufacturer sales
Country Segment Breakdown Table
| Segment | Sub-Segments |
|---|---|
| By Foam Type | AFFF / Legacy Foam · Fluorine-free Foam · Protein Foam · AR Foam / Other |
| By System Type | Fixed Foam Systems · Portable Foam Units · Foam Monitors · Deck Foam Systems |
| By Application | Engine Rooms · Helidecks · Cargo / Tank Areas · Ports / Terminals |
| By End Use | Tankers · Offshore Platforms · Naval Vessels · Port Facilities |
| By Sales Channel | Direct OEM · EPC / Shipyard · Service Retrofit |
| Key Sub-Regions Covered, Manufacturing and port clusters | Shanghai · Ningbo-Zhoushan · Shenzhen · Qingdao · Tianjin · Guangzhou |
Frequently Asked Questions
How fast is China marine foam fire system market growing?
China is projected to record 7.8% CAGR from 2026 to 2036. Port scale and shipyard demand support this outlook.
Who leads China marine foam fire system market?
Jiangsu Suolong and Shanghai Waysmos compete alongside Shanghai Jindun and Johnson Controls China on foam supply and equipment channels.
What is driving adoption in China marine foam fire system market?
Port cargo scale and domestic foam supply are shaping replacement demand across China.
What supports marine foam fire system growth in India?
A 7.5% CAGR through 2036 reflects major port cargo growth and shipbuilding policy support.
Country Market Snapshot Table
| Parameter | Value |
|---|---|
| Market Size in 2025 (Value) | USD 144.2 million |
| Market Size in 2026 (Value) | USD 155.0 million |
| Market Forecast in 2036 (Value) | USD 319.5 million |
| CAGR (2026 to 2036) | 7.5% |
| Years Considered | 2021 to 2036 |
| Base Year | 2025 |
| Forecast Period | 2026 to 2036 |
| Units Considered | Value (USD million) |
| Leading Sub-Region | West coast and Tamil Nadu shipyard corridors |
India Marine Foam Fire System Market Outlook
In India, demand for marine firefighting foam is concentrated at major ports and oil terminals along key coastal corridors. While buyers remain highly price-sensitive, rising cargo volumes are increasing the need for inspection readiness and reliable fire-protection systems.
Domestic foam and fire equipment suppliers improve access to retrofit packages. Shipbuilding policy support can widen OEM demand for compliant marine safety systems.
Key Growth Drivers
- Port cargo growth gives fixed foam systems a clearer role in India's marine safety budgets. PIB reported in April 2026 that major ports handled 915.17 million tonnes in FY 2025 to 2026. That level of movement raises the need for foam readiness around berths and fuel-handling zones.
- Shipbuilding policy improves the OEM outlook by allowing new yards to specify compliant fire systems earlier. In May 2026, PIB reported a 2.5 million GT greenfield shipyard capacity plan at Thoothukudi. This creates a more direct route for marine foam packages in newbuild procurement.
- Oil and chemical berths create recurring inspection needs for foam monitors and tank-area systems.
- Domestic fire equipment suppliers improve lifecycle-cost options for port operators and shipyards.
Key Restraints
- Price sensitivity can slow full retrofit packages even when port activity is rising. PIB reported in March 2025 that major ports handled 853.57 million tonnes in FY 2024 to 2025. Buyers may still split foam purchase from cleaning and recommissioning work to manage cost.
- Skilled service coverage varies outside major clusters and can delay system recommissioning.
- Imported approvals may add qualification work for vessels built for export customers.
What makes India unique
India is distinctive for developing port retrofit demand alongside shipbuilding policy support.
Key Companies
- Foamtech Antifire Company
- HD Fire Protect
- NewAge Fire Protection Industries
- NewAge Fire Fighting Co.
- NAFFCO India
Sales & Marketing Channels
- Port authority tenders
- EPC contractor channels
- Shipyard procurement
- Marine safety distributors
- Oil terminal maintenance contractors
- Direct foam manufacturer sales
Country Segment Breakdown Table
| Segment | Sub-Segments |
|---|---|
| By Foam Type | AFFF / Legacy Foam · Fluorine-free Foam · Protein Foam · AR Foam / Other |
| By System Type | Fixed Foam Systems · Portable Foam Units · Foam Monitors · Deck Foam Systems |
| By Application | Engine Rooms · Helidecks · Cargo / Tank Areas · Ports / Terminals |
| By End Use | Tankers · Offshore Platforms · Naval Vessels · Port Facilities |
| By Sales Channel | Direct OEM · EPC / Shipyard · Service Retrofit |
| Key Sub-Regions Covered, Port and shipyard corridors | Gujarat · Maharashtra · Tamil Nadu · Andhra Pradesh · Kerala · Odisha |
Frequently Asked Questions
How fast is India marine foam fire system market growing?
India is anticipated to grow at 7.5% CAGR from 2026 to 2036. Port activity and shipyard investment support this path.
Who leads India marine foam fire system market?
Foamtech Antifire and HD Fire Protect compete alongside NewAge Fire Protection and NAFFCO India on foam and fire equipment supply.
What is driving adoption in India marine foam fire system market?
Major port growth and shipbuilding policy are shaping demand across India.
How does South Korea compare in the marine foam fire system market?
A 7.2% CAGR through 2036 reflects shipbuilding concentration and port container activity.
Country Market Snapshot Table
| Parameter | Value |
|---|---|
| Market Size in 2025 (Value) | USD 111.9 million |
| Market Size in 2026 (Value) | USD 120.0 million |
| Market Forecast in 2036 (Value) | USD 240.5 million |
| CAGR (2026 to 2036) | 7.2% |
| Years Considered | 2021 to 2036 |
| Base Year | 2025 |
| Forecast Period | 2026 to 2036 |
| Units Considered | Value (USD million) |
| Leading Sub-Region | Busan and Ulsan shipbuilding corridors |
South Korea Marine Foam Fire System Market Outlook
South Korea demand is propelled by shipyards and offshore module builders that need approved fire systems for new vessels. Port service companies then support foam inspection and equipment maintenance.
Local marine fire system suppliers improve access to deck foam and fixed system work. Global foam brands remain important for export vessels that need class-aligned documentation.
Key Growth Drivers
- Port container volume keeps terminal fire system demand visible for marine safety buyers. MOF reported in January 2025 that Korean trade ports handled 31.73 million TEU in 2024. This activity supports foam system review across container terminals and ship service corridors.
- Container growth adds retrofit visibility after higher berth use increases equipment inspection pressure. MOF reported in January 2025 that the 2024 container figure rose by 5.3% from the prior year. The increase gives operators another reason to keep monitors and fixed systems ready.
- Shipyard concentration supports OEM demand for fixed foam packages and deck foam systems.
- Local marine service companies improve inspection access across Busan and Ulsan corridors.
Key Restraints
- Export-vessel standards can increase documentation work before foam products are approved. Korean Register rules require alcohol-resistant foam for defined chemical tanker cargo conditions. That requirement makes supplier qualification and system records more important for export ship projects.
- Shipyard schedules can compress testing windows before vessel delivery.
- Service work can be delayed during peak dock occupancy periods.
What makes South Korea unique
South Korea is distinctive for placing shipyard concentration near marine fire system service capability.
Key Companies
- FAIN Co.
- Dong Bang Marine
- DAELIM Marine
- The Safety Co.
Sales & Marketing Channels
- Shipyard framework agreements
- Offshore module contractors
- Marine safety service providers
- Port maintenance procurement
- Distributor-led foam supply
- Class inspection support
Country Segment Breakdown Table
| Segment | Sub-Segments |
|---|---|
| By Foam Type | AFFF / Legacy Foam · Fluorine-free Foam · Protein Foam · AR Foam / Other |
| By System Type | Fixed Foam Systems · Portable Foam Units · Foam Monitors · Deck Foam Systems |
| By Application | Engine Rooms · Helidecks · Cargo / Tank Areas · Ports / Terminals |
| By End Use | Tankers · Offshore Platforms · Naval Vessels · Port Facilities |
| By Sales Channel | Direct OEM · EPC / Shipyard · Service Retrofit |
| Key Sub-Regions Covered, Shipbuilding and port clusters | Busan · Ulsan · Geoje · Incheon · Mokpo · Gwangyang |
Frequently Asked Questions
How fast is South Korea marine foam fire system market growing?
South Korea is expected to grow at 7.2% CAGR from 2026 to 2036. Shipbuilding and port activity support the forecast.
Who leads South Korea marine foam fire system market?
FAIN and Dong Bang Marine compete alongside DAELIM Marine and The Safety Co. on marine fire and service channels.
What is driving adoption in South Korea marine foam fire system market?
Shipyard concentration and Busan port activity support fixed foam system demand in South Korea.
How fast is the marine foam fire system market growing in the United States?
A 7.0% CAGR through 2036 reflects inspection-led retrofit demand across tanker and offshore service assets.
Country Market Snapshot Table
| Parameter | Value |
|---|---|
| Market Size in 2025 (Value) | USD 271.0 million |
| Market Size in 2026 (Value) | USD 290.0 million |
| Market Forecast in 2036 (Value) | USD 570.5 million |
| CAGR (2026 to 2036) | 7.0% |
| Years Considered | 2021 to 2036 |
| Base Year | 2025 |
| Forecast Period | 2026 to 2036 |
| Units Considered | Value (USD million) |
| Leading Sub-Region | Gulf Coast and Atlantic port corridors |
United States Marine Foam Fire System Market Outlook
United States demand is tied to Gulf Coast terminals and offshore service fleets that need fixed foam coverage around fuel handling areas. Buyers place more weight on documentation and inspection support before changing concentrates.
Service channels matter when foam changeout requires tank cleaning and proportioner checks. Suppliers that combine concentrate supply with survey paperwork gain better access to fleet operators.
Key Growth Drivers
- Gulf Coast liquid bulk activity keeps fixed foam systems inside planned safety budgets for terminals and offshore service fleets. The BTS January 2026 port performance report keeps port capacity and operating exposure visible for safety planning. That reporting context supports budget attention for fire protection around high-risk assets.
- Crane capacity points to complex terminal operations that need coordinated emergency planning. BTS reported in January 2026 that the top 25 container ports operated 570 ship-to-shore cranes in 2024. This equipment base makes fire response planning part of daily terminal reliability.
- Offshore support vessels add foam review needs across machinery spaces and helideck-adjacent zones.
- USCG inspection materials strengthen documentation-led selling for PFOS replacement and survey preparation.
Key Restraints
- Disposal planning can slow early retrofit work after PFAS handling adds environmental accountability. EPA designated PFOA and PFOS as CERCLA hazardous substances in April 2024. That decision can make foam removal and waste documentation more difficult for owners.
- Older proportioners can require compatibility checks before a fluorine-free concentrate is accepted.
- Small fleet operators may defer non-mandatory work until survey timing makes replacement unavoidable.
What makes United States unique
The United States is distinctive for pairing Gulf Coast fuel exposure with a large retrofit service network.
Key Companies
- Johnson Controls
- Perimeter Solutions
- Kidde Fire Systems
- The Hiller Companies
Sales & Marketing Channels
- Direct enterprise sales
- Port terminal safety procurement
- Offshore contractor channels
- Class survey preparation support
- Retrofit service partners
- Marine safety distributors
Country Segment Breakdown Table
| Segment | Sub-Segments |
|---|---|
| By Foam Type | AFFF / Legacy Foam · Fluorine-free Foam · Protein Foam · AR Foam / Other |
| By System Type | Fixed Foam Systems · Portable Foam Units · Foam Monitors · Deck Foam Systems |
| By Application | Engine Rooms · Helidecks · Cargo / Tank Areas · Ports / Terminals |
| By End Use | Tankers · Offshore Platforms · Naval Vessels · Port Facilities |
| By Sales Channel | Direct OEM · EPC / Shipyard · Service Retrofit |
| Key Sub-Regions Covered, Tanker and offshore corridors | Gulf Coast · Texas · Louisiana · Florida · Pacific ports · Atlantic ports |
Frequently Asked Questions
How fast is United States marine foam fire system market growing?
The United States is expected to expand at 7.0% CAGR from 2026 to 2036. Inspection-led retrofit work supports the outlook.
Who leads United States marine foam fire system market?
Johnson Controls and Perimeter Solutions compete alongside Kidde Fire Systems and Hiller on foam portfolios and marine service access.
What is driving adoption in United States marine foam fire system market?
Gulf Coast fuel handling and USCG inspection pressure are shaping compliant foam system purchases.
How is the marine foam fire system forecast developing in Japan?
A 6.8% CAGR through 2036 reflects shipyard discipline and port safety requirements.
Country Market Snapshot Table
| Parameter | Value |
|---|---|
| Market Size in 2025 (Value) | USD 117.0 million |
| Market Size in 2026 (Value) | USD 125.0 million |
| Market Forecast in 2036 (Value) | USD 241.3 million |
| CAGR (2026 to 2036) | 6.8% |
| Years Considered | 2021 to 2036 |
| Base Year | 2025 |
| Forecast Period | 2026 to 2036 |
| Units Considered | Value (USD million) |
| Leading Sub-Region | Tokyo Bay and Seto Inland Sea corridors |
Japan Marine Foam Fire System Market Outlook
Japan demand is propelled by dense coastal logistics and shipbuilding routines that favor proven equipment. Buyers review concentrate swaps carefully since fixed systems need predictable performance.
Local fire protection companies support shipyards and port operators via established safety procurement channels. Replacement activity is expected to stay measured and technically disciplined.
Key Growth Drivers
- Tokyo Bay activity signals concentrated marine risk zones that need clear berth-level fire planning. A 2026 AIS study identified 161 active berths across seven Tokyo Bay port areas. Dense berth activity makes fixed foam readiness more important for vessel and terminal operators.
- Port safety coverage remains a national operating issue for Japan's coastal economy. Japan Coast Guard materials in April 2024 stated that Japan had 87 specified ports. This port base supports steady demand for verified marine fire protection routines.
- Local fire equipment suppliers help shipyards manage approval checks and service response.
- Coastal tanker and energy logistics keep deck foam systems relevant for high-risk berths.
Key Restraints
- Safety review can slow replacement work when ship managers examine equipment risk carefully. JTSB reported 31 onboard hazardous-gas accident cases covering 2008 to 2024. The safety record encourages careful product acceptance before concentrate swaps are completed.
- Conservative procurement can extend product acceptance before fluorine-free concentrates are used.
- Service capacity outside major bays can limit rapid retrofit scheduling.
What makes Japan unique
Japan is distinctive for conservative specification behavior reinforced by dense coastal port operations.
Key Companies
- Nohmi Bosai
- Nippon Dry-Chemical
- Yamato Protec
- Hatsuta Seisakusho
Sales & Marketing Channels
- Shipyard procurement
- Port authority contracts
- Marine safety distributors
- Class inspection channels
- Direct manufacturer support
- Coastal vessel service networks
Country Segment Breakdown Table
| Segment | Sub-Segments |
|---|---|
| By Foam Type | AFFF / Legacy Foam · Fluorine-free Foam · Protein Foam · AR Foam / Other |
| By System Type | Fixed Foam Systems · Portable Foam Units · Foam Monitors · Deck Foam Systems |
| By Application | Engine Rooms · Helidecks · Cargo / Tank Areas · Ports / Terminals |
| By End Use | Tankers · Offshore Platforms · Naval Vessels · Port Facilities |
| By Sales Channel | Direct OEM · EPC / Shipyard · Service Retrofit |
| Key Sub-Regions Covered, Coastal logistics corridors | Tokyo Bay · Yokohama · Kobe · Osaka · Nagoya · Seto Inland Sea |
Frequently Asked Questions
How fast is Japan marine foam fire system market growing?
Japan is forecast to rise at 6.8% CAGR from 2026 to 2036. Shipyard discipline and port safety needs support this outlook.
Who leads Japan marine foam fire system market?
Nohmi Bosai and Nippon Dry-Chemical compete alongside Yamato Protec and Hatsuta Seisakusho on local fire protection access.
What is driving adoption in Japan marine foam fire system market?
Tokyo Bay activity and shipyard discipline support careful foam system replacement in Japan.
How is Germany performing in the marine foam fire system market?
A 6.5% CAGR through 2036 reflects engineered system demand and port-linked retrofit work.
Country Market Snapshot Table
| Parameter | Value |
|---|---|
| Market Size in 2025 (Value) | USD 103.3 million |
| Market Size in 2026 (Value) | USD 110.0 million |
| Market Forecast in 2036 (Value) | USD 206.5 million |
| CAGR (2026 to 2036) | 6.5% |
| Years Considered | 2021 to 2036 |
| Base Year | 2025 |
| Forecast Period | 2026 to 2036 |
| Units Considered | Value (USD million) |
| Leading Sub-Region | Hamburg and North Sea shipyard corridors |
Germany Marine Foam Fire System Market Outlook
Germany demand is specification-led across shipyard engineering and terminal maintenance. Buyers compare foam chemistry and system acceptance before approving replacement work.
Suppliers gain access through engineering contractors and port maintenance channels. Domestic foam and proportioning companies give buyers technical options for fluorine-free transitions.
Key Growth Drivers
- Hamburg activity supports terminal and ship service demand for fixed foam systems. Port of Hamburg reported in February 2026 that it handled 114.6 million tonnes of seaborne cargo in 2025. This operating base keeps fire protection and berth safety inside maintenance planning.
- National seaport scale sustains engineered fire protection work beyond one port cluster. The USA International Trade Administration reported in June 2026 that Germany had 21 seaports in 2025. A wider port base gives suppliers more routes for maintenance and retrofit work.
- German foam and proportioning suppliers improve local support for transition planning.
- EU chemical pressure pushes owners toward documented replacement programs.
Key Restraints
- Engineering reviews can raise retrofit budgets before a fluorine-free foam is accepted in fixed systems. Destatis recorded 279.6 million tonnes in German maritime goods transport in 2025. That traffic base makes careful system approval important across port and vessel assets.
- Compatibility checks can lengthen acceptance before fluorine-free foam is approved in fixed systems.
- Port maintenance windows can limit the timing available for tank cleaning and recommissioning.
What makes Germany unique
Germany is distinctive for engineering-heavy selection aligned with domestic foam transition capability.
Key Companies
- Minimax
- Dr. Sthamer
- FireDos
- Johnson Controls Germany
Sales & Marketing Channels
- Shipyard engineering procurement
- Terminal maintenance contracts
- Fire protection integrators
- Class-compliance advisory routes
- Direct technical sales
- Foam transition service programs
Country Segment Breakdown Table
| Segment | Sub-Segments |
|---|---|
| By Foam Type | AFFF / Legacy Foam · Fluorine-free Foam · Protein Foam · AR Foam / Other |
| By System Type | Fixed Foam Systems · Portable Foam Units · Foam Monitors · Deck Foam Systems |
| By Application | Engine Rooms · Helidecks · Cargo / Tank Areas · Ports / Terminals |
| By End Use | Tankers · Offshore Platforms · Naval Vessels · Port Facilities |
| By Sales Channel | Direct OEM · EPC / Shipyard · Service Retrofit |
| Key Sub-Regions Covered, Engineering and port corridors | Hamburg · Bremen/Bremerhaven · Wilhelmshaven · Rostock · Kiel · Lubeck |
Frequently Asked Questions
How fast is Germany marine foam fire system market growing?
Germany is forecast to expand at 6.5% CAGR from 2026 to 2036. Engineered retrofit work supports this demand path.
Who leads Germany marine foam fire system market?
Minimax and Dr. Sthamer compete alongside FireDos and Johnson Controls Germany on engineering and foam capability.
What is driving adoption in Germany marine foam fire system market?
Hamburg port activity and fluorine-free transition work support German demand.
What is the marine foam fire system outlook in the United Kingdom?
A 6.2% CAGR through 2036 reflects port traffic and domestic foam equipment expertise.
Country Market Snapshot Table
| Parameter | Value |
|---|---|
| Market Size in 2025 (Value) | USD 84.7 million |
| Market Size in 2026 (Value) | USD 90.0 million |
| Market Forecast in 2036 (Value) | USD 164.2 million |
| CAGR (2026 to 2036) | 6.2% |
| Years Considered | 2021 to 2036 |
| Base Year | 2025 |
| Forecast Period | 2026 to 2036 |
| Units Considered | Value (USD million) |
| Leading Sub-Region | North Sea and Channel port corridors |
United Kingdom Marine Foam Fire System Market Outlook
United Kingdom demand is shaped by ferry routes and offshore service activity that keep portable and fixed foam systems in maintenance plans. Port operators need replacement work that causes limited disruption during operating windows.
Channel access is service-led across repair yards and marine safety distributors. Local foam and monitor capability improves technical support for buyers.
Key Growth Drivers
- Port freight activity sustains fire protection budgets across marine terminals and ship repair channels. DfT reported in June 2026 that UK major ports handled 104.7 million tonnes of freight in Q1 2026. This activity keeps foam replacement in the maintenance discussion for terminal operators.
- Ro-Ro activity keeps deck and berth safety needs visible across ferry and freight routes that require dependable response planning. DfT recorded 22.1 million tonnes of Ro-Ro freight in Q1 2026. That movement supports continued checks for portable units and fixed foam coverage.
- Domestic suppliers improve access to foam and monitor support for ports and ship repair yards.
- Offshore service routes create recurring demand for portable units and fixed system checks.
Key Restraints
- Freight softness can slow discretionary upgrades when owners separate urgent compliance work from wider system renewal. DfT reported in June 2026 that total freight tonnage decreased 3% in Q1 2026. A softer traffic setting can make buyers phase retrofit spending.
- Smaller vessel owners may delay early replacement until survey deadlines increase urgency.
- Imported foam approvals can extend vendor review for ship managers handling mixed fleets.
What makes United Kingdom unique
The United Kingdom is distinctive for local foam manufacturing close to dense ferry routes and offshore service work.
Key Companies
- Angus Fire
- Survitec Group
- Johnson Controls UK
- VIKING Life-Saving Equipment UK
Sales & Marketing Channels
- Marine safety distributors
- Ship repair yards
- Port authority procurement
- Offshore contractor frameworks
- Direct supplier technical support
- Service inspection networks
Country Segment Breakdown Table
| Segment | Sub-Segments |
|---|---|
| By Foam Type | AFFF / Legacy Foam · Fluorine-free Foam · Protein Foam · AR Foam / Other |
| By System Type | Fixed Foam Systems · Portable Foam Units · Foam Monitors · Deck Foam Systems |
| By Application | Engine Rooms · Helidecks · Cargo / Tank Areas · Ports / Terminals |
| By End Use | Tankers · Offshore Platforms · Naval Vessels · Port Facilities |
| By Sales Channel | Direct OEM · EPC / Shipyard · Service Retrofit |
| Key Sub-Regions Covered, Ferry and offshore corridors | London Gateway · Southampton · Felixstowe · Aberdeen · Teesport · Liverpool |
Frequently Asked Questions
How fast is United Kingdom marine foam fire system market growing?
The United Kingdom is projected to grow at 6.2% CAGR from 2026 to 2036. Service-led replacement supports this outlook.
Who leads United Kingdom marine foam fire system market?
Angus Fire and Survitec Group compete alongside Johnson Controls UK and VIKING UK on marine foam and service access.
What is driving adoption in United Kingdom marine foam fire system market?
Port freight activity and domestic foam expertise support compliant replacement work in the United Kingdom.
What supports marine foam fire system growth in France?
A 6.0% CAGR through 2036 reflects port concessions and liquid bulk safety needs.
Country Market Snapshot Table
| Parameter | Value |
|---|---|
| Market Size in 2025 (Value) | USD 75.5 million |
| Market Size in 2026 (Value) | USD 80.0 million |
| Market Forecast in 2036 (Value) | USD 143.3 million |
| CAGR (2026 to 2036) | 6.0% |
| Years Considered | 2021 to 2036 |
| Base Year | 2025 |
| Forecast Period | 2026 to 2036 |
| Units Considered | Value (USD million) |
| Leading Sub-Region | Seine corridor and Mediterranean port clusters |
France Marine Foam Fire System Market Outlook
France demand is centered on major port corridors that combine container traffic and liquid bulk exposure. Port operators need foam systems that protect high-risk zones while limiting terminal downtime.
Procurement often moves through concession holders and marine engineering contractors. Local foam producers and service firms improve vendor access for compliant replacement programs.
Key Growth Drivers
- Seine corridor traffic supports fixed system demand across terminals that handle mixed cargo and liquid bulk exposure. HAROPA PORT reported in January 2026 that it handled 84.7 million tonnes of goods in 2025. This scale keeps fire protection planning visible across port concessions.
- Container activity adds terminal fire-risk exposure across crane and berth operations that require reliable emergency access. HAROPA PORT recorded 3.2 million TEU in 2025. That flow supports foam system checks around berths and cargo-handling areas.
- Liquid bulk and bunkering activity sustain foam monitor and tank-area inspection needs.
- Naval and ship repair activity supports specialized engineering channels.
Key Restraints
- Bulk exposure can create uneven retrofit timing when operators prioritize work by terminal risk and shutdown windows. HAROPA PORT reported in January 2026 that solid bulk traffic rose more than 10% in 2025. The increase can stretch maintenance planning across different cargo areas.
- Vendor approval can slow imported foam use in safety-critical port assets.
- Terminal downtime concerns can delay full system cleaning and recommissioning.
What makes France unique
France is distinctive for port concession activity supported by local fluorine-free foam manufacturing.
Key Companies
- BIOex
- DESAUTEL
- LEADER Group
- Johnson Controls France
Sales & Marketing Channels
- Port terminal procurement
- Marine engineering contractors
- Ship repair service providers
- Distributor-led foam supply
- Naval support channels
- Concession operator tenders
Country Segment Breakdown Table
| Segment | Sub-Segments |
|---|---|
| By Foam Type | AFFF / Legacy Foam · Fluorine-free Foam · Protein Foam · AR Foam / Other |
| By System Type | Fixed Foam Systems · Portable Foam Units · Foam Monitors · Deck Foam Systems |
| By Application | Engine Rooms · Helidecks · Cargo / Tank Areas · Ports / Terminals |
| By End Use | Tankers · Offshore Platforms · Naval Vessels · Port Facilities |
| By Sales Channel | Direct OEM · EPC / Shipyard · Service Retrofit |
| Key Sub-Regions Covered, Port concession corridors | Le Havre · Marseille-Fos · Dunkirk · Nantes Saint-Nazaire · Rouen · Bordeaux |
Frequently Asked Questions
How fast is France marine foam fire system market growing?
France is estimated to grow at 6.0% CAGR from 2026 to 2036. Port-led replacement supports this outlook.
Who leads France marine foam fire system market?
BIOex and DESAUTEL compete alongside LEADER Group and Johnson Controls France on foam and service access.
What is driving adoption in France marine foam fire system market?
Seine corridor traffic and local foam production support compliant fire system upgrades in France.
Who are the leading companies in the marine foam fire system market?
Johnson Controls and Perimeter Solutions are profiled alongside Fomtec and Angus Fire. Minimax and Dr. Sthamer add engineered and chemistry-led depth. Solberg and Kidde Fire Systems strengthen the safety-system field. FireDos and BIOex add equipment and foam depth.
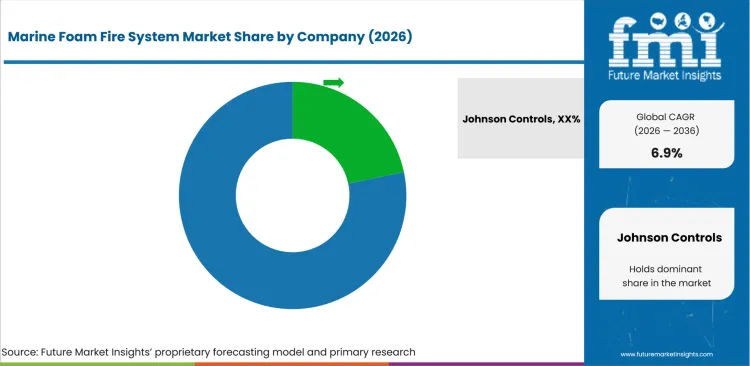
- Competition is based on marine approvals and fluorine-free foam transition records.
- Integrated suppliers compete on fixed systems and service documentation for shipowners.
- Foam specialists compete on seawater performance and proportioning behavior.
- Regional suppliers compete on response speed and nearby retrofit execution.
Integrated fire system providers compete with formulators and specialized service contractors, as buyers evaluate suppliers on more than product availability alone. Procurement decisions typically prioritize the depth of regulatory approvals and the availability of local inspection and commissioning support, which often determines the final contract award.
System suppliers are able to secure larger orders when foam packages are bundled with fire pump packages and compatible hardware for fixed installations, reducing interface risk for asset owners. Among fleet operators, foam replacement projects are frequently assessed alongside broader automatic fire‑suppression upgrades, particularly during dry‑dock periods when multiple onboard hazards are reviewed within a single modernization plan. Suppliers offering approved fluorine‑free foams supported by in‑house service crews are therefore better positioned, as consolidating products and services under one vendor simplifies composition verification and compliance record management for vessel owners.
How do top marine foam fire system market companies compare?
Global companies lead approval depth. Regional specialists improve service execution near ports and ship repair corridors.
| Company | Portfolio / Focus | Account Access | Footprint / Service Reach |
|---|---|---|---|
| Johnson Controls | Marine foam systems and hardware | Direct shipowner and navy channels | Global |
| Perimeter Solutions | SOLBERG fluorine-free transition support | Industrial and marine foam buyers | Global |
| Fomtec | Enviro SEA and fluorine-free concentrates | Distributor and ship service channels | Global |
| Angus Fire | Foams, monitors, nozzles, and cannons | UK and export channels | Global distributors |
| Minimax | Foam extinguishing systems and modernization | Engineering and EPC buyers | Global |
| Dr. Sthamer | STHAMEX MARINE foam products | Marine foam distributors | Europe and export markets |
| FireDos | Stationary and portable foam proportioners | System integrators | Global |
| BIOex | Marine ECOPOL foam products | Industrial and marine buyers | Europe and export markets |
Source: Future Market Insights competitive analysis, 2026.
Who are the key players in the marine foam fire system market?
The market includes global fire system companies and specialist foam formulators. Regional marine safety suppliers add service-led competition near vessel and terminal assets.
Key global companies leading the marine foam fire system market include:
- Johnson Controls
- Perimeter Solutions
- Fomtec
- Angus Fire
- Minimax
- Dr. Sthamer
- Solberg
- Kidde Fire Systems
- FireDos
- BIOex
Key Developments in Marine Foam Fire System Market
- In January 2026, Fomtec released Enviro NEO materials for coastal and offshore foam applications that may use fresh water or seawater.
- In February 2025, Perimeter Solutions issued SOLBERG transition guidance for operators moving from PFAS foam to fluorine-free foam.
- In November 2025, Angus Fire presented its FWM foam water geared monitor for fixed high-risk applications.
Key Players in the Marine Foam Fire System Market
Integrated Fire System Providers
- Johnson Controls
- Minimax
- Kidde Fire Systems
- FireDos
Foam Chemistry Specialists
- Perimeter Solutions
- Fomtec
- Angus Fire
- Dr. Sthamer
- Solberg
- BIOex
Regional and Channel Specialists
- Jiangsu Suolong Fire Science and Technology
- HD Fire Protect
- Foamtech Antifire Company
- FAIN Co.
- DESAUTEL
- The Hiller Companies
Report Scope
| Parameter | Details |
|---|---|
| Forecast period | 2026 to 2036 |
| Historical period | 2021 to 2025 |
| Quantitative unit | Value (USD million) |
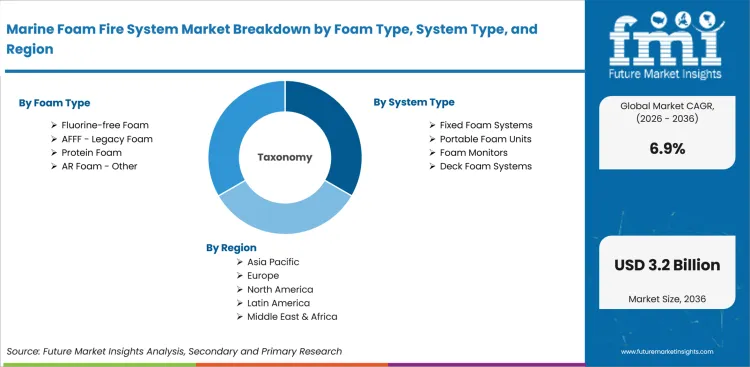
| Segmentation by Foam Type | AFFF / Legacy Foam, Fluorine-free Foam, Protein Foam, AR Foam / Other |
| Segmentation by System Type | Fixed Foam Systems, Portable Foam Units, Foam Monitors, Deck Foam Systems |
| Segmentation by Application | Engine Rooms, Helidecks, Cargo / Tank Areas, Ports / Terminals |
| Segmentation by End Use | Tankers, Offshore Platforms, Naval Vessels, Port Facilities |
| Segmentation by Sales Channel | Direct OEM, EPC / Shipyard, Service Retrofit |
| Regions covered | North America, Latin America, Europe, East Asia, South Asia and Pacific, Middle East and Africa |
| Countries covered | United States, United Kingdom, Germany, France, Japan, China, South Korea, India |
| Key companies profiled | Johnson Controls, Perimeter Solutions, Fomtec, Angus Fire, Minimax, Dr. Sthamer, Solberg, Kidde Fire Systems, FireDos, BIOex |
| Approach | Hybrid bottom-up and top-down methodology using verified product scope and retrofit timing |
Source: Future Market Insights, 2026.
Marine Foam Fire System Market - Scope & Definition
| Scope Item | Coverage |
|---|---|
| Market Definition | Marine foam fire systems include foam concentrates, fixed discharge networks, proportioning hardware, monitors, portable units, and deck foam systems used on ships and marine facilities. |
| Functions Covered | Fuel surface fire control, vapor suppression, foam blanket formation, re-ignition control, survey documentation support. |
| Applications Covered | Engine rooms, helidecks, cargo and tank areas, ports and terminals. |
| End-Use Industries | Tankers, offshore platforms, naval vessels, port facilities. |
| Grades Covered | AFFF / Legacy Foam, fluorine-free foam, protein foam, AR foam and other marine concentrates. |
| Inclusions | Foam concentrates, fixed foam systems, portable foam units, foam monitors, deck foam systems, retrofit service, and recommissioning support. |
| Exclusions | Dry chemical systems, water mist systems, gas suppression systems, standalone alarms, and general fire detection equipment. |
Marine Foam Fire System Market - Research Methodology
| Methodology Step | Description |
|---|---|
| Primary Research | FMI reviewed inputs from marine fire system suppliers, shipyard buyers, offshore safety teams, and port terminal maintenance managers. |
| Desk Research | Desk work reviewed IMO rules, maritime safety statistics, port traffic data, company product documents, and foam transition references. |
| Market Sizing & Forecasting | The model combined equipment value, retrofit pricing, foam replacement cycles, shipyard installation rates, and country-level maritime activity. |
| Data Validation | Forecasts were checked against port throughput, marine casualty data, supplier portfolios, and verified country company presence. |
Marine Foam Fire System Market Breakdown by Foam Type and Other Segments
Marine Foam Fire System Market Segmented by Foam Type
- AFFF / Legacy Foam
- Fluorine-free Foam
- Protein Foam
- AR Foam / Other
Marine Foam Fire System Market Segmented by System Type
- Fixed Foam Systems
- Portable Foam Units
- Foam Monitors
- Deck Foam Systems
Marine Foam Fire System Market Segmented by Application
- Engine Rooms
- Helidecks
- Cargo / Tank Areas
- Ports / Terminals
Marine Foam Fire System Market Segmented by End Use
- Tankers
- Offshore Platforms
- Naval Vessels
- Port Facilities
Marine Foam Fire System Market Segmented by Sales Channel
- Direct OEM
- EPC / Shipyard
- Service Retrofit
Marine Foam Fire System Market by Region
- North America
- Latin America
- Western Europe
- Eastern Europe
- East Asia
- South Asia and Pacific
- Middle East and Africa
Research Sources and Bibliography
- International Maritime Organization. (2026, January 9). Raft of shipping rules in force from 1 January 2026. International Maritime Organization.
- International Maritime Organization. (2026, January). SOLAS 2024 edition supplement January 2026. International Maritime Organization.
- Maritime and Coastguard Agency. (2025, December 15). MGN 713 (M): Fire protection regulations - adoptions of amendments in IMO resolutions in force on 1 Jan 2026. UK Government.
- European Maritime Safety Agency. (2025, October 7). Annual overview of marine casualties and incidents 2025. European Maritime Safety Agency.
- UN Trade and Development. (2025, September 24). Review of maritime transport 2025. UN Trade and Development.
- Bureau of Transportation Statistics. (2026, January). Port Performance Freight Statistics: 2026 annual report. USA Department of Transportation.
- Bureau of Transportation Statistics. (2025, March). Port Performance Freight Statistics: 2025 annual report. USA Department of Transportation.
- USA Environmental Protection Agency. (2024, April 19). Designation of perfluorooctanoic acid and perfluorooctanesulfonic acid as CERCLA hazardous substances. USA Environmental Protection Agency.
- Department for Transport. (2026, June 10). Port freight quarterly statistics: January to March 2026. UK Government.
- Port of Hamburg. (2026, February). Seaborne cargo throughput 2025. Port of Hamburg.
- USA International Trade Administration. (2026, June 9). Germany maritime industry. USA Department of Commerce.
- Federal Statistical Office of Germany. (2026). Goods transport on sea by main traffic relations. Destatis.
- HAROPA PORT. (2026, January 21). Record traffic and growing modal share in 2025 on the Seine corridor. HAROPA PORT.
- Japan Coast Guard. (2024, April 1). Japan Coast Guard annual report 2024. Japan Coast Guard.
- Japan Transport Safety Board. (2025, April 24). Marine accident investigation report MA2025-4. Japan Transport Safety Board.
- Hutten, M. (2026, January 28). High-resolution mapping of port dynamics from open-access AIS data in Tokyo Bay. arXiv.
- State Council of the People’s Republic of China. (2025, June 1). Cargo throughput at China’s ports logs solid growth in January to April. State Council of the People’s Republic of China.
- Ministry of Oceans and Fisheries. (2025, January 24). Korea’s ports handle record-high container volume of 31.73 million TEUs in 2024. Ministry of Oceans and Fisheries.
- Korean Register. (2024). Rules for classification of steel ships: Fire protection and fire extinction. Korean Register.
- Ministry of Ports, Shipping and Waterways. (2026, April 5). Major ports record 915 million tonnes cargo in FY 2025 to 2026. Press Information Bureau.
- Ministry of Ports, Shipping and Waterways. (2026, May 13). Landmark MoU signed for India’s first mega greenfield shipyard at Thoothukudi. Press Information Bureau.
- Ministry of Ports, Shipping and Waterways. (2025, March). Cargo handled by major ports during April to March 2024 to 2025. Government of India.
- Johnson Controls. (2025). Marine foam fire suppression systems. Johnson Controls.
- Perimeter Solutions. (2025, February). Transitioning from PFAS fluorinated foam to SOLBERG synthetic fluorine-free foam. Perimeter Solutions.
- Fomtec. (2024, January 25). ENVIRO SEA 3% technical data sheet. Fomtec.
- Fomtec. (2026, January). Enviro NEO technical information. Fomtec.
- Angus Fire. (2025, November 18). FWM foam water geared monitor. Angus Fire.
- Minimax. (2025). A fluorine-free future. Minimax.
- Dr. Sthamer. (2024). STHAMEX MARINE 3% F-20. Dr. Sthamer.
- FireDos. (2025). Stationary foam proportioners for fire extinguishing systems. FireDos.
- BIOex. (2025). Marine firefighting foam concentrates. BIOex.
- Jiangsu Suolong Fire Science and Technology. (2026). Firefighting foam concentrates. Suolong Fire.
- Shanghai Waysmos Fire Suppression. (2026). Foam concentrate and foam equipment. Shanghai Waysmos Fire Suppression.
- HD Fire Protect. (2026). Fire fighting foam and foam concentrate. HD Fire Protect.
- Foamtech Antifire Company. (2026). Fire fighting foam concentrates and fire suppression systems. Foamtech Antifire Company.
- NewAge Fire Fighting Co. (2026). Fire fighting equipment and foam systems. NewAge Fire Fighting Co.
This bibliography is provided for reader reference and includes primary government, regulator, port authority, official company, and technical sources used in the report.
This Report Answers
- The report estimates market size for 2026 and forecasts value through 2036 for the marine foam fire system market.
- Regional analysis assesses demand across more than 30 country and regional markets.
- Demand coverage explains how retrofit pressure and compliance needs shape purchasing behavior supported by service channel review for foam changeout.
- Segment analysis evaluates foam types and system categories including fluorine-free foam and fixed foam systems.
- Sales channel coverage reviews direct OEM and service retrofit routes with EPC and shipyard routes covered as part of the same route analysis.
- Country analysis identifies growth conditions across China and India with South Korea and the United States adding shipyard and offshore perspectives.
- Competitive review explains positioning across global fire system providers and specialist foam formulators.
- Scope definitions clarify inclusions and exclusions for marine foam fire systems used in vessels and port facilities.
- Methodology notes explain FMI sizing logic for retrofit demand and OEM demand.
- Segmentation coverage breaks demand down by foam type and system type while application and end use define the risk setting.
Frequently Asked Questions
What is the growth prospect for marine foam fire systems?
Demand for marine foam fire systems is expected to rise at a measured pace after PFOS replacement moves into survey-led retrofit work.
Why are shipowners investing in marine foam fire systems?
Shipowners are investing to maintain fire readiness and prove compliance before vessel inspections.
Why are service retrofit channels important in the marine foam fire system market?
Service retrofit channels matter when foam replacement requires tank cleaning and recommissioning work.
Which foam formats are gaining attention in marine applications?
Fluorine-free foam formats are gaining attention after buyers began prioritizing PFOS replacement options for marine use.
How do regulations influence marine foam fire system purchases?
Regulations influence purchases by making foam composition and survey records part of the buying decision.
Why is seawater compatibility important for marine foam systems?
Seawater compatibility matters for shipboard and offshore systems that often operate with seawater supply.
What role do fixed systems play in marine fire safety?
Fixed systems protect defined high-risk spaces and reduce reliance on manual setup during fuel fire events.
How do port terminals support marine foam system demand?
Port terminals support demand by maintaining foam systems around bunkering and liquid bulk berth areas.
What can slow marine foam fire system retrofits?
Retrofits can slow after owners face cleaning costs and compatibility checks. Limited service windows can add further delay during vessel operations.
Preview the report firsthand - request a free sample
Get SampleGet the brochure for pricing and purchase details.
Get PDFTable of Content
- Key Takeaways
- Market Size and CAGR
- Top Growth Driver
- Fastest Growing Segment
- Leading Region
- Key Companies
- Emerging Opportunities
- Executive Summary
- Global Market Outlook
- Demand-side Trends
- Supply-side Trends
- Technology Roadmap Analysis
- Analysis and Recommendations
- Analyst Perspective (What is happening? Why now? What should investors know?)
- Key Questions Answered
- How large is the market?
- What is the CAGR?
- What are key trends?
- Which region dominates?
- Who are the leaders?
- Market Overview
- Market Coverage / Taxonomy
- Market Definition / Scope / Limitations
- Research Methodology
- Chapter Orientation
- Analytical Lens and Working Hypotheses
- Market Structure, Signals, and Trend Drivers
- Benchmarking and Cross-market Comparability
- Market Sizing, Forecasting, and Opportunity Mapping
- Research Design and Evidence Framework
- Desk Research Programme (Secondary Evidence)
- Expert Input and Fieldwork (Primary Evidence)
- Tooling, Models, and Reference Databases
- Data Engineering and Model Build
- Quality Assurance and Audit Trail
- Market Background
- Market Dynamics (Drivers, Restraints, Opportunity, Trends)
- Scenario Forecast (Optimistic, Likely, Conservative)
- Impact Analysis
- AI Impact
- Sustainability Impact
- Regulatory Impact
- Technology Impact
- Consumer / Buyer Analysis
- Purchase Drivers
- Adoption Barriers
- Buyer Journey
- Opportunity Map Analysis
- Product Life Cycle Analysis
- Supply Chain Analysis
- Investment Feasibility Matrix
- Value Chain Analysis
- PESTLE and Porter's Analysis
- Regulatory Landscape
- Regional Parent Market Outlook
- Production and Consumption Statistics
- Import and Export Statistics
- Global Market Analysis and Forecast, 2021 to 2036
- Historical Market Size Value (USD Billion) & Volume (Unit) Analysis, 2021 to 2025
- Current and Future Market Size Value (USD Billion) & Volume (Unit) Projections, 2026 to 2036
- Y-o-Y Growth Trend Analysis
- Absolute $ Opportunity Analysis
- Global Market Pricing Analysis, 2021 to 2036
- Global Market Analysis and Forecast, By Foam Type, 2021 to 2036
- Introduction / Key Findings
- Historical Market Size Value (USD Billion) & Volume (Unit) Analysis By Foam Type, 2021 to 2025
- Current and Future Market Size Value (USD Billion) & Volume (Unit) Analysis and Forecast By Foam Type, 2026 to 2036
- Fluorine-free Foam
- AFFF - Legacy Foam
- Protein Foam
- AR Foam - Other
- Fluorine-free Foam
- Y-o-Y Growth Trend Analysis By Foam Type, 2021 to 2025
- Absolute $ Opportunity Analysis By Foam Type, 2026 to 2036
- Global Market Analysis and Forecast, By System Type, 2021 to 2036
- Introduction / Key Findings
- Historical Market Size Value (USD Billion) & Volume (Unit) Analysis By System Type, 2021 to 2025
- Current and Future Market Size Value (USD Billion) & Volume (Unit) Analysis and Forecast By System Type, 2026 to 2036
- Fixed Foam Systems
- Portable Foam Value (USD Billion) & Volume (Unit)s
- Foam Monitors
- Deck Foam Systems
- Fixed Foam Systems
- Y-o-Y Growth Trend Analysis By System Type, 2021 to 2025
- Absolute $ Opportunity Analysis By System Type, 2026 to 2036
- Global Market Analysis and Forecast, By Application, 2021 to 2036
- Introduction / Key Findings
- Historical Market Size Value (USD Billion) & Volume (Unit) Analysis By Application, 2021 to 2025
- Current and Future Market Size Value (USD Billion) & Volume (Unit) Analysis and Forecast By Application, 2026 to 2036
- Cargo - Tank Areas
- Engine Rooms
- Helidecks
- Ports - Terminals
- Cargo - Tank Areas
- Y-o-Y Growth Trend Analysis By Application, 2021 to 2025
- Absolute $ Opportunity Analysis By Application, 2026 to 2036
- Global Market Analysis and Forecast, By End Use, 2021 to 2036
- Introduction / Key Findings
- Historical Market Size Value (USD Billion) & Volume (Unit) Analysis By End Use, 2021 to 2025
- Current and Future Market Size Value (USD Billion) & Volume (Unit) Analysis and Forecast By End Use, 2026 to 2036
- Tankers
- Offshore Platforms
- Naval Vessels
- Port Facilities
- Tankers
- Y-o-Y Growth Trend Analysis By End Use, 2021 to 2025
- Absolute $ Opportunity Analysis By End Use, 2026 to 2036
- Global Market Analysis and Forecast, By Sales Channel, 2021 to 2036
- Introduction / Key Findings
- Historical Market Size Value (USD Billion) & Volume (Unit) Analysis By Sales Channel, 2021 to 2025
- Current and Future Market Size Value (USD Billion) & Volume (Unit) Analysis and Forecast By Sales Channel, 2026 to 2036
- Service Retrofit
- Direct OEM
- EPC - Shipyard
- Service Retrofit
- Y-o-Y Growth Trend Analysis By Sales Channel, 2021 to 2025
- Absolute $ Opportunity Analysis By Sales Channel, 2026 to 2036
- Global Market Analysis and Forecast, By Region, 2021 to 2036
- Introduction
- Historical Market Size Value (USD Billion) & Volume (Unit) Analysis By Region, 2021 to 2025
- Current Market Size Value (USD Billion) & Volume (Unit) Analysis and Forecast By Region, 2026 to 2036
- North America
- Latin America
- Western Europe
- Eastern Europe
- East Asia
- South Asia and Pacific
- Middle East & Africa
- Market Attractiveness Analysis By Region
- North America Market Analysis and Forecast, By Country, 2021 to 2036
- Historical Market Size Value (USD Billion) & Volume (Unit) Trend Analysis By Market Taxonomy, 2021 to 2025
- Market Size Value (USD Billion) & Volume (Unit) Forecast By Market Taxonomy, 2026 to 2036
- By Country
- USA
- Canada
- Mexico
- By Foam Type
- By System Type
- By Application
- By End Use
- By Sales Channel
- By Country
- Market Attractiveness Analysis
- By Country
- By Foam Type
- By System Type
- By Application
- By End Use
- By Sales Channel
- Key Takeaways
- Latin America Market Analysis and Forecast, By Country
- Historical Market Size Value (USD Billion) & Volume (Unit) Trend Analysis By Market Taxonomy, 2021 to 2025
- Market Size Value (USD Billion) & Volume (Unit) Forecast By Market Taxonomy, 2026 to 2036
- By Country
- Brazil
- Chile
- Rest of Latin America
- By Foam Type
- By System Type
- By Application
- By End Use
- By Sales Channel
- By Country
- Market Attractiveness Analysis
- By Country
- By Foam Type
- By System Type
- By Application
- By End Use
- By Sales Channel
- Key Takeaways
- Western Europe Market Analysis and Forecast, By Country
- Historical Market Size Value (USD Billion) & Volume (Unit) Trend Analysis By Market Taxonomy, 2021 to 2025
- Market Size Value (USD Billion) & Volume (Unit) Forecast By Market Taxonomy, 2026 to 2036
- By Country
- Germany
- UK
- Italy
- Spain
- France
- Nordic
- BENELUX
- Rest of Western Europe
- By Foam Type
- By System Type
- By Application
- By End Use
- By Sales Channel
- By Country
- Market Attractiveness Analysis
- By Country
- By Foam Type
- By System Type
- By Application
- By End Use
- By Sales Channel
- Key Takeaways
- Eastern Europe Market Analysis and Forecast, By Country
- Historical Market Size Value (USD Billion) & Volume (Unit) Trend Analysis By Market Taxonomy, 2021 to 2025
- Market Size Value (USD Billion) & Volume (Unit) Forecast By Market Taxonomy, 2026 to 2036
- By Country
- Russia
- Poland
- Hungary
- Balkan & Baltic
- Rest of Eastern Europe
- By Foam Type
- By System Type
- By Application
- By End Use
- By Sales Channel
- By Country
- Market Attractiveness Analysis
- By Country
- By Foam Type
- By System Type
- By Application
- By End Use
- By Sales Channel
- Key Takeaways
- East Asia Market Analysis and Forecast, By Country
- Historical Market Size Value (USD Billion) & Volume (Unit) Trend Analysis By Market Taxonomy, 2021 to 2025
- Market Size Value (USD Billion) & Volume (Unit) Forecast By Market Taxonomy, 2026 to 2036
- By Country
- China
- Japan
- South Korea
- By Foam Type
- By System Type
- By Application
- By End Use
- By Sales Channel
- By Country
- Market Attractiveness Analysis
- By Country
- By Foam Type
- By System Type
- By Application
- By End Use
- By Sales Channel
- Key Takeaways
- South Asia and Pacific Market Analysis and Forecast, By Country
- Historical Market Size Value (USD Billion) & Volume (Unit) Trend Analysis By Market Taxonomy, 2021 to 2025
- Market Size Value (USD Billion) & Volume (Unit) Forecast By Market Taxonomy, 2026 to 2036
- By Country
- India
- ASEAN
- Australia & New Zealand
- Rest of South Asia and Pacific
- By Foam Type
- By System Type
- By Application
- By End Use
- By Sales Channel
- By Country
- Market Attractiveness Analysis
- By Country
- By Foam Type
- By System Type
- By Application
- By End Use
- By Sales Channel
- Key Takeaways
- Middle East & Africa Market Analysis and Forecast, By Country
- Historical Market Size Value (USD Billion) & Volume (Unit) Trend Analysis By Market Taxonomy, 2021 to 2025
- Market Size Value (USD Billion) & Volume (Unit) Forecast By Market Taxonomy, 2026 to 2036
- By Country
- Kingdom of Saudi Arabia
- Other GCC Countries
- Türkiye
- South Africa
- Other African Union
- Rest of Middle East & Africa
- By Foam Type
- By System Type
- By Application
- By End Use
- By Sales Channel
- By Country
- Market Attractiveness Analysis
- By Country
- By Foam Type
- By System Type
- By Application
- By End Use
- By Sales Channel
- Key Takeaways
- Key Countries Market Analysis
- USA
- Pricing Analysis
- Market Share Analysis, 2025
- By Foam Type
- By System Type
- By Application
- By End Use
- By Sales Channel
- Canada
- Pricing Analysis
- Market Share Analysis, 2025
- By Foam Type
- By System Type
- By Application
- By End Use
- By Sales Channel
- Mexico
- Pricing Analysis
- Market Share Analysis, 2025
- By Foam Type
- By System Type
- By Application
- By End Use
- By Sales Channel
- Brazil
- Pricing Analysis
- Market Share Analysis, 2025
- By Foam Type
- By System Type
- By Application
- By End Use
- By Sales Channel
- Chile
- Pricing Analysis
- Market Share Analysis, 2025
- By Foam Type
- By System Type
- By Application
- By End Use
- By Sales Channel
- Germany
- Pricing Analysis
- Market Share Analysis, 2025
- By Foam Type
- By System Type
- By Application
- By End Use
- By Sales Channel
- UK
- Pricing Analysis
- Market Share Analysis, 2025
- By Foam Type
- By System Type
- By Application
- By End Use
- By Sales Channel
- Italy
- Pricing Analysis
- Market Share Analysis, 2025
- By Foam Type
- By System Type
- By Application
- By End Use
- By Sales Channel
- Spain
- Pricing Analysis
- Market Share Analysis, 2025
- By Foam Type
- By System Type
- By Application
- By End Use
- By Sales Channel
- France
- Pricing Analysis
- Market Share Analysis, 2025
- By Foam Type
- By System Type
- By Application
- By End Use
- By Sales Channel
- India
- Pricing Analysis
- Market Share Analysis, 2025
- By Foam Type
- By System Type
- By Application
- By End Use
- By Sales Channel
- ASEAN
- Pricing Analysis
- Market Share Analysis, 2025
- By Foam Type
- By System Type
- By Application
- By End Use
- By Sales Channel
- Australia & New Zealand
- Pricing Analysis
- Market Share Analysis, 2025
- By Foam Type
- By System Type
- By Application
- By End Use
- By Sales Channel
- China
- Pricing Analysis
- Market Share Analysis, 2025
- By Foam Type
- By System Type
- By Application
- By End Use
- By Sales Channel
- Japan
- Pricing Analysis
- Market Share Analysis, 2025
- By Foam Type
- By System Type
- By Application
- By End Use
- By Sales Channel
- South Korea
- Pricing Analysis
- Market Share Analysis, 2025
- By Foam Type
- By System Type
- By Application
- By End Use
- By Sales Channel
- Russia
- Pricing Analysis
- Market Share Analysis, 2025
- By Foam Type
- By System Type
- By Application
- By End Use
- By Sales Channel
- Poland
- Pricing Analysis
- Market Share Analysis, 2025
- By Foam Type
- By System Type
- By Application
- By End Use
- By Sales Channel
- Hungary
- Pricing Analysis
- Market Share Analysis, 2025
- By Foam Type
- By System Type
- By Application
- By End Use
- By Sales Channel
- Kingdom of Saudi Arabia
- Pricing Analysis
- Market Share Analysis, 2025
- By Foam Type
- By System Type
- By Application
- By End Use
- By Sales Channel
- Türkiye
- Pricing Analysis
- Market Share Analysis, 2025
- By Foam Type
- By System Type
- By Application
- By End Use
- By Sales Channel
- South Africa
- Pricing Analysis
- Market Share Analysis, 2025
- By Foam Type
- By System Type
- By Application
- By End Use
- By Sales Channel
- USA
- Market Structure Analysis
- Competition Dashboard
- Competition Benchmarking
- Market Share Analysis of Top Players
- By Regional
- By Foam Type
- By System Type
- By Application
- By End Use
- By Sales Channel
- Emerging Startups
- Innovation Benchmarking
- Competition Analysis
- Competition Deep Dive
- Johnson Controls
- Overview
- Product Portfolio
- Profitability by Market Segments (Product/Region/Sales Channel)
- Sales Footprint
- Strategy Overview
- Marketing Strategy
- Product Strategy
- Channel Strategy
- Perimeter Solutions
- Fomtec
- Angus Fire
- Minimax
- Dr. Sthamer
- Solberg
- Kidde Fire Systems
- FireDos
- BIOex
- Johnson Controls
- Case Studies
- Success Stories
- Recent Developments
- Competition Deep Dive
- Assumptions & Acronyms Used


